Pew Research Center

FOR RELEASE NOVEMBER 3, 2015

U.S. Public Becoming Less Religious

Modest Drop in Overall Rates of Belief and Practice, but Religiously Affiliated Americans Are as Observant as Before

FOR MEDIA OR OTHER INQUIRIES:

Communications Department
202.419.4372
www.pewresearch.org

RECOMMENDED CITATION

Pew Research Center, November 2015, "U.S. Public Becoming Less Religious"

About Pew Research Center

Pew Research Center is a nonpartisan, nonadvocacy fact tank that informs the public about the issues, attitudes and trends shaping the world. It does not take policy positions. The Center conducts public opinion polling, demographic research, computational social science research and other data-driven research. It studies politics and policy; news habits and media; the internet and technology; religion; race and ethnicity; international affairs; social, demographic and economic trends; science; research methodology and data science; and immigration and migration. Pew Research Center is a subsidiary of The Pew Charitable Trusts, its primary funder.

© Pew Research Center 2026

Table of contents

  • About Pew Research Center
  • U.S. Public Becoming Less Religious
  • Chapter 1: Importance of Religion and Religious Beliefs
  • Chapter 2: Religious Practices and Experiences
  • Chapter 3: Views of Religious Institutions
  • Chapter 4: Social and Political Attitudes
  • Appendix A: Methodology
  • Appendix B: Putting Findings From the Religious Landscape Study Into Context

U.S. Public Becoming Less Religious

Modest Drop in Overall Rates of Belief and Practice, but Religiously Affiliated Americans Are as Observant as Before

For the latest data from the 2023-24 Religious Landscape Study (RLS) on Americans’ religious identities, beliefs and practices, read our report “Decline of Christianity in the U.S. Has Slowed, May Have Leveled Off” and visit the interactive database “Religious Landscape Study.”

Is the American public becoming less religious? Yes, at least by some key measures of what it means to be a religious person. An extensive new survey of more than 35,000 U.S. adults finds that the percentages who say they believe in God, pray daily and regularly go to church or other religious services all have declined modestly in recent years.

But the Pew Research Center study also finds a great deal of stability in the U.S. religious landscape. The recent decrease in religious beliefs and behaviors is largely attributable to the “nones” – the growing minority of Americans, particularly in the Millennial generation, who say they do not belong to any organized faith. Among the roughly three-quarters of U.S. adults who do claim a religion, there has been no discernible drop in most measures of religious commitment. Indeed, by some conventional measures, religiously affiliated Americans are, on average, even more devout than they were a few years ago.

The 2014 Religious Landscape Study is a follow-up to an equally extensive survey on religion in America, conducted in 2007. An initial report on the findings from the 2014 study, released in May 2015, described the changing size and demographic characteristics of the nation’s major religious groups. This report focuses on Americans’ religious beliefs and practices and assesses how they have changed in recent years.

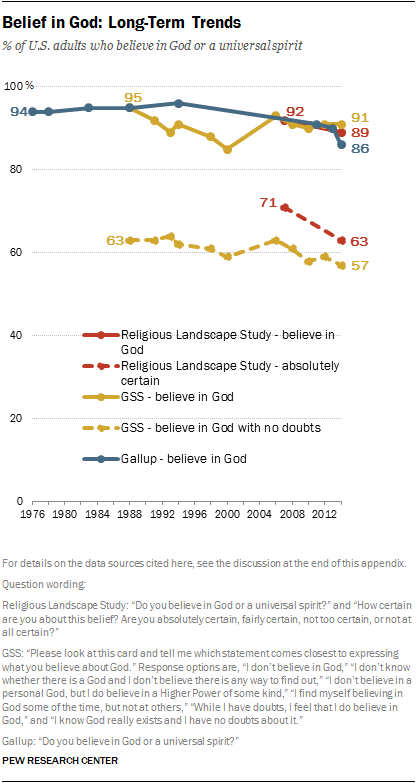
The share of U.S. adults who say they believe in God, while still remarkably high by comparison with other advanced industrial countries, has declined modestly, from approximately 92% to 89%, since Pew Research Center conducted its first Landscape Study in 2007.1 The share of Americans who say they are “absolutely certain” God exists has dropped more sharply, from 71% in 2007 to 63% in 2014. And the percentages who say they pray every day, attend religious services regularly and consider religion to be very important in their lives also have ticked down by small but statistically significant margins.

The falloff in traditional religious beliefs and practices coincides with changes in the religious composition of the U.S. public. A growing share of Americans are religiously unaffiliated, including some who self-identify as atheists or agnostics as well as many who describe their religion as “nothing in particular.” Altogether, the religiously unaffiliated (also called the “nones”) now account for 23% of the adult population, up from 16% in 2007.
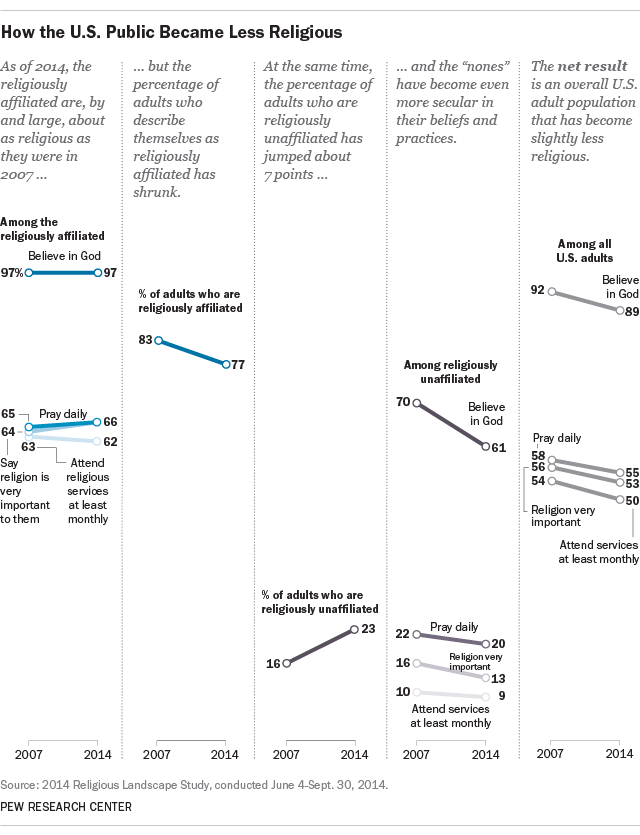
Pew Research Center surveys consistently show that not all religious “nones” are nonbelievers. In fact, the majority of Americans without a religious affiliation say they believe in God. As a group, however, the “nones” are far less religiously observant than Americans who identify with a specific faith. And, as the “nones” have grown in size, they also have become even less observant than they were when the original Religious Landscape Study was conducted in 2007. The growth of the “nones” as a share of the population, coupled with their declining levels of religious observance, is tugging down the nation’s overall rates of religious belief and practice.

At the same time, the vast majority of Americans (77% of all adults) continue to identify with some religious faith. And this religiously affiliated population – comprising a wide variety of Protestants as well as Catholics, Jews, Mormons, Muslims, Buddhists, Hindus and adherents of other faith traditions – is, on the whole, just as religiously committed today as when the study was first conducted in 2007. Fully two-thirds of religiously affiliated adults say they pray every day and that religion is very important to them, and roughly six-in-ten say they attend religious services at least once or twice a month; those numbers have changed little, if at all, in recent years. And nearly all religiously affiliated people in the survey (97%) continue to believe in God, though a declining share express this belief with absolute certainty (74% in 2014, down from 79% in 2007).

Growing Share of People Regularly Feel Spiritual Peace, Sense of Wonder

Indeed, by some measures, religiously affiliated people appear to have grown more religiously observant in recent years. The portion of religiously affiliated adults who say they regularly read scripture, share their faith with others and participate in small prayer groups or scripture study groups all have increased modestly since 2007. And roughly four-in-ten religiously affiliated adults (41%) now say they rely mainly on their religious beliefs for guidance on questions about right and wrong, up 7 percentage points in seven years.

The study also suggests that in some ways Americans are becoming more spiritual. About six-in-ten adults now say they regularly feel a deep sense of “spiritual peace and well-being,” up 7 percentage points since 2007. And 46% of Americans say they experience a deep sense of “wonder about the universe” at least once a week, also up 7 points over the same period.

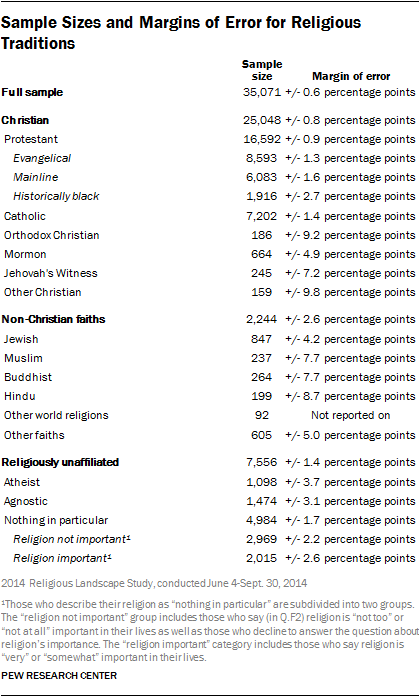
These are among the key findings of Pew Research Center’s 2014 U.S. Religious Landscape Study. The latest survey was conducted among a nationally representative sample of 35,071 adults interviewed by telephone, on both cellphones and landlines, from June 4-Sept. 30, 2014. Findings based on the full sample have a margin of sampling error of plus or minus 0.6 percentage points. (For a table of margins of error for sub-groups, as well as other methodological details, see Appendix A.)

As noted above, this is the second report on the results of the 2014 Religious Landscape Study. The first report, published in May 2015, focused on the changing religious composition of the U.S. public. It documented the continued, rapid growth of the religiously unaffiliated population and described the importance of generational replacement in driving the rise of the “nones.” As older cohorts of adults (comprised mainly of self-identified Christians) pass away, they are being replaced by a new cohort of young adults who display far lower levels of attachment to organized religion than their parents’ and grandparents’ generations did when they were the same age.

The same dynamic helps explain the declines in traditional measures of religious belief and practice. Millennials – especially the youngest Millennials, who have entered adulthood since the first Landscape Study was conducted – are far less religious than their elders. For example, only 27% of Millennials say they attend religious services on a weekly basis, compared with 51% of adults in the Silent generation. Four-in-ten of the youngest Millennials say they pray every day, compared with six-in-ten Baby Boomers and two-thirds of members of the Silent generation. Only about half of Millennials say they believe in God with absolute certainty, compared with seven-in-ten Americans in the Silent and Baby Boom cohorts. And only about four-in-ten Millennials say religion is very important in their lives, compared with more than half in the older generational cohorts.

In Many Ways, Younger Americans Are Less Religious Than Older Americans
Almost All Christian Groups Now More Accepting of Homosexuality

In addition to exploring religious beliefs and practices, the new Religious Landscape Study includes questions about Americans’ social and political values. In some ways, the basic patterns in religion and politics in the United States remain unchanged. Some religious groups (including evangelical Protestants and Mormons) are generally supportive of the Republican Party, while other groups (including Jews, religious “nones,” Hispanic Catholics and members of churches that belong to the historically black Protestant tradition) tend to be more Democratic in their partisan allegiances.

But while there is much continuity in the relationship of religion and politics in the U.S., not everything is fixed in stone. The Landscape Study shows, for example, that nearly all major religious groups have become significantly more accepting of homosexuality in recent years – even groups, such as evangelicals and Mormons, that traditionally have expressed strong opposition to same-sex relationships. Changing attitudes about homosexuality are linked to the same generational forces helping to reshape religious identity and practice in the United States, with Millennials expressing far more acceptance of homosexuality than older adults do. Fully half of Millennials who identify as evangelical Protestants, for instance, now say homosexuality should be accepted by society.2

The study also shows that the growth of the “nones” is having a particularly pronounced impact on the Democratic Party coalition. In fact, religious “nones” are now more numerous among Democrats and Democratic-leaning adults than are Catholics, evangelical Protestants, mainline Protestants or members of the historically black Protestant tradition. The religiously unaffiliated also are growing within the GOP, though not as quickly, and they remain far outnumbered by evangelicals and less numerous than Catholics or mainline Protestants within the Republican coalition.

Religious 'Nones' Now Largest Single Religious Group Among Democrats
Evangelicals Remain Largest Religious Group in GOP Coalition

The remainder of this Overview explores in greater depth the religious changes that are underway in the American public. It describes how the stability of religious practice among the shrinking share of the population that is religiously affiliated, coupled with declining rates of religious observance among the growing minority of religious “nones,” is producing overall declines in several key measures of religious practice. It explains the importance of generational replacement – the gradual supplanting of older generations by newer ones – in driving these trends. The Overview also highlights an increase in the share of Americans who say they regularly have certain spiritual experiences, describes the public’s views of religious institutions and briefly summarizes several key findings about the connection between religion and politics. Subsequent sections of the report provide additional information on all of these topics, with full details on the beliefs, practices and attitudes of many of the diverse religious groups that populate the U.S. religious landscape. And Appendix B includes a description of how the findings from the Religious Landscape Study compare with other major religion surveys.

Trends in Religious Beliefs and Practices

The new Religious Landscape Study shows that most people who identify with a religion ascribe a high level of importance to their personal faith and say they participate in religious activities on at least an occasional basis. In several important respects, the religiously affiliated are just as highly observant and engaged with their respective faith traditions today as they were when the Landscape Study was first conducted in 2007. While much is changing in American religious life, the level of religious observance exhibited by those who identify with a religion is, by and large, stable.

Relatively Steady Share of Religiously Affiliated Adults Say Religion ‘Very Important’ to Them

For example, two-thirds of religiously affiliated adults say religion is very important in their lives. One-quarter say religion is “somewhat” important in their lives, and about one-in-ten say religion is “not too” or “not at all” important to them (9%). These shares are little changed from 2007.

The amount of importance people attach to religion varies considerably depending on the religious tradition to which they belong.3 Large majorities (roughly eight-in-ten or more) of evangelical Protestants, as well as Protestants who belong to churches that are part of the historically black Protestant tradition, Mormons and Jehovah’s Witnesses say religion is “very important” in their lives, while roughly six-in-ten or fewer mainline Protestants and Catholics say the same.4 But across most religious traditions, and among the religiously affiliated group as a whole, there has been little change in the importance people attach to religion’s place in their lives.

Similarly, there has been little change in the share of religiously affiliated adults who say they pray regularly. And while there has been a bit of fluctuation in self-reported rates of attendance at religious services among some religious groups (e.g., among members of the historically black Protestant tradition), the overall picture here also is one of continuity rather than change; generally speaking, there has been little movement in the share of religiously affiliated adults who say they attend religious services regularly.5

No Decline in Share of Religiously Affiliated Who Say They Pray Daily, Minor Fluctuations in Self-Reported Rates of Religious Attendance

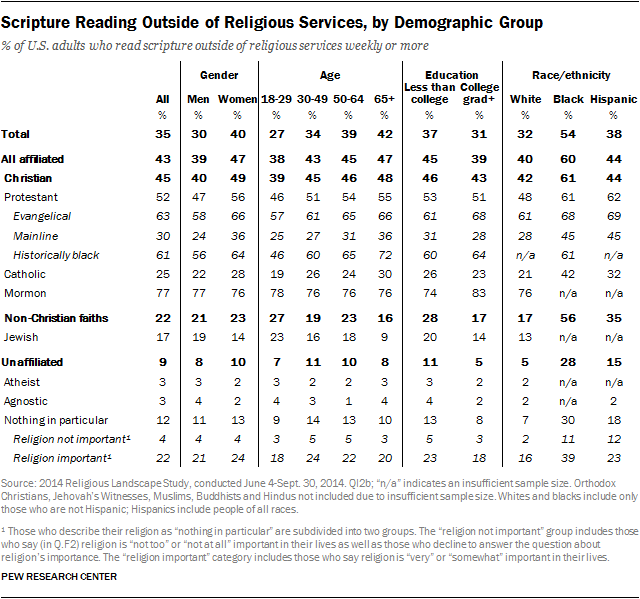
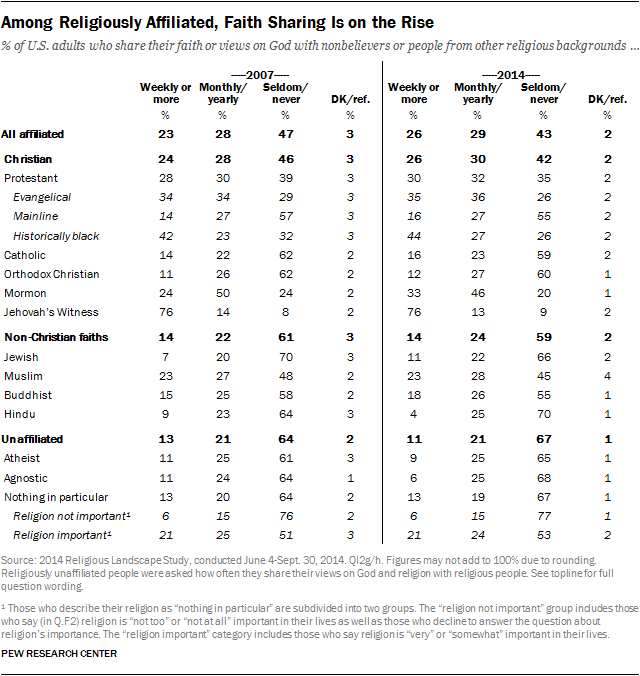
The survey shows, furthermore, that some indicators of religious practice have ticked upward slightly among the religiously affiliated. For example, 26% of religiously affiliated adults now say they share their faith with nonbelievers or people from other religious backgrounds at least once a week, up from 23% in 2007. More than four-in-ten religiously affiliated adults (43%) now say they read scripture outside of religious services at least once a week, up 3 percentage points since 2007. And fully three-in-ten religiously affiliated adults now say they participate in prayer groups or scripture study groups on a weekly basis, also up 3 points since 2007. The increasing share of religiously affiliated adults who read scripture and participate in small-group religious activities has helped hold steady the percentage of the overall population who engage in these practices despite the rapid growth of the religious “nones.”

Growing Share of Religiously Affiliated Say They Regularly Read Scripture, Participate in Prayer or Scripture Study Groups, Share Faith With Others

Unaffiliated Have Grown Less Religious

While stability is perhaps the best single word to sum up the Landscape Study’s findings about the religious beliefs and practices of religiously affiliated Americans, the trends among the religiously unaffiliated segment of the population look more like secularization. Not only have the unaffiliated grown in size, they also have become less religious over time.

The 'Nones' Are Becoming Increasingly Secular

For example, the share of religious “nones” who say religion is “very important” in their lives has declined by 3 percentage points in recent years, and the share saying religion is “somewhat” important in their lives has declined by 4 points. Meanwhile, the share of religiously unaffiliated adults who say religion is either “not too important” or “not at all important” to them has grown by 8 percentage points since 2007. Roughly two-thirds of the “nones” now say religion is of little importance in their lives, up from 57% in 2007.

Similarly, the Religious Landscape Study finds that 62% of religious “nones” now say they “seldom” or “never” pray, a 6-point increase since 2007. And while there has been little change in the rate at which “nones” report attending religious services (few did this more than a few times a year to begin with), the proportion of “nones” who say they do not believe in God has grown rapidly in recent years. Fully one-third of religiously unaffiliated adults now say they do not believe in God, up 11 points since 2007.

Among U.S. Population as a Whole, Modest Declines in Key Measures of Religious Observance

As a result of these two trends – growth and secularization among the religiously unaffiliated – the share of Americans who exhibit high religious commitment is declining.

For instance, the share of Americans saying religion is “very” or “somewhat” important in their lives has declined, while the share saying religion is “not too” or “not at all” important to them has grown by 5 percentage points. There has been a modest decline in the share of adults who say they pray at least monthly, while the share of people who say they seldom or never pray has increased by nearly 5 points. And about half of adults now say they attend religious services no more than a few times a year, up almost 5 points since 2007. Meanwhile, the share who report that they attend services weekly has dropped by nearly 4 points, to roughly 36%.

Share of Highly Religious People Shrinks Even as Number of Highly Religious People Holds Steady

Number of Religiously Affiliated Americans Saying Religion ‘Very Important’ to Them Holds Steady

These changes are happening even though the absolute number of Americans who are highly religiously engaged has not changed very much. In other words, the United States is growing less religious (in percentage terms) not because there are fewer highly religious people but rather because, as the overall U.S. population has grown, there are now many more nonreligious people than was the case just a few years ago.

One way to illustrate this dynamic is to use the survey’s findings to produce estimates of the number of Americans who exhibit a particular religious characteristic. In 2007, for instance, there were 227.2 million adults in the U.S., and 83.1% of them – 188.8 million adults – were religiously affiliated.6 Among this group, 64.5% indicated that religion was “very important” in their lives, meaning there were an estimated 121.8 million religiously affiliated adults for whom religion was “very important.” As of 2014, the U.S. adult population swelled to 244.8 million, and 76.5% – an estimated 187.3 million people – describe themselves as religiously affiliated. Nearly two-thirds of them say religion is “very important” in their lives, meaning there now are an estimated 122.7 million religiously affiliated adults for whom religion is “very important,” which is about the same as in 2007.7

Rapid Growth in Number of Religious ‘Nones’ Who Say Religion Is Not Important to Them

At the other end of the religion spectrum, there has been rapid growth in the number of unaffiliated adults who say religion is not important to them. In 2007, 16.1% of adults – 36.6 million people – described themselves as religious “nones.” And 57.5% of them said religion was “not too” or “not at all” important in their lives, yielding an estimate that 21.0 million adults were religious “nones” for whom religion was personally unimportant. By 2014, the religiously unaffiliated share of the population had grown to 22.8%, and the number of religious “nones” had ballooned to 55.8 million. And nearly two-thirds of the “nones” – 36.1 million adults – say religion is unimportant to them, an increase of roughly 15 million people in just seven years.

The data show similar patterns in questions about prayer and attendance at religious worship services. The number of religiously unaffiliated adults who say they seldom or never pray and the number who say they seldom or never attend services have grown rapidly. Meanwhile, the numbers of religiously affiliated adults who say they pray daily and attend services regularly have been comparatively stable. The result is that the percentages of Americans who pray daily and attend religious services regularly have declined modestly.

For more details on the study’s findings about trends in religious beliefs and practices, see Chapter 1 and Chapter 2.

Generational Differences

Who are the largely nonreligious adults whose ranks are growing, thus reducing the percentage of Americans who exhibit strong religious commitment? They are mainly young people just entering adulthood. Older Americans – those in the Silent generation, Baby Boomers and even Generation Xers – are, by and large, about as religious today as when the Religious Landscape Study was first conducted in 2007. But these three generational cohorts constitute a shrinking share of the total U.S. population, and, as their numbers begin to dwindle, they are being replaced by a new cohort of young adults (Millennials) who are, in many ways, far less religious than their parents’ and grandparents’ generations.8

For example, two-thirds of adults in the Silent generation say religion is “very important” in their lives and that they pray every day, as do about six-in-ten Baby Boomers and more than half of Generation Xers. By comparison with older adults, Millennials exhibit far lower rates of involvement with religion. Fewer than half of older Millennials (adults now in their late 20s and early 30s) and roughly four-in-ten younger Millennials (adults now in their late teens and early 20s) say religion is very important to them and that they pray daily. And a majority of Millennials say they attend religious services a few times a year at most. Millennials’ relatively low rates of religious involvement are attributable in part to the fact that many Millennials are religious “nones.” However, on several of these measures, even young adults who are religiously affiliated are less observant than their older counterparts. (For more details on how the beliefs and practices of younger religiously affiliated adults compare with those of older religiously affiliated adults, see Chapter 1 and Chapter 2.)

Members of Younger Generational Cohorts Far Less Observant Than Older Americans

It is possible, of course, that younger adults will become more religious with age. Analysis of the General Social Survey (GSS), for instance, shows that over the long term, people pray more regularly and report attending religious services a bit more often as they get older. And Gallup surveys conducted over several decades indicate that as people age, they become more likely to say religion is an important part of their lives.9

Similarly, the Religious Landscape Study finds that, at least on some measures, there is a tendency for people to become more religious as they get older. For example, Generation Xers, Baby Boomers and those in the Silent generation all have become somewhat more inclined in recent years to say they rely mainly on their religious beliefs when thinking about questions of right and wrong; they also are more likely to say they read scripture regularly and participate in prayer groups or scripture study groups on a frequent basis. Baby Boomers and those in the Silent generation also have become more likely to say their religion is the “one true faith leading to eternal life.” However, older Millennials have not become substantially more likely to participate in small-group religious activities or say they rely on religion for guidance on questions of right and wrong.

People in Older Generational Cohorts Increasingly Rely on Religion for Guidance on Questions of Right and Wrong

Furthermore, in the seven years since the first Religious Landscape Study was conducted, no generational cohort has become more religious as measured by self-assessments of religion’s importance in their lives, frequency of prayer or frequency of church attendance. Indeed, older Millennials – adults who were between the ages of 18 and 26 when the first Religious Landscape Study was conducted in 2007 and who today are in their late 20s and early 30s – are, if anything, less religiously observant today than they were in 2007 in these important ways. The share of older Millennials who say they seldom or never attend religious services has risen by 9 percentage points. And the share of older Millennials who say they seldom or never pray has risen by 6 points, as has the share who say religion is “not too” or “not at all” important in their lives.

Growing Share of Older Millennials Say Religion Unimportant to Them and That They Rarely Attend Religious Services

Rise of the ‘Nones’: Is It Just a Change in Nomenclature?

As the share of religiously unaffiliated Americans has risen rapidly in recent years, some observers have suggested that this is merely a change in labels. There always have been people who identify with a religion but are not particularly devout or active — self-identified Catholics, Methodists, Lutherans, Jews, etc. who do not regularly pray, attend religious services or participate in other religious activities. All that has really changed – so the thinking goes – is that these nominally affiliated but largely non-practicing individuals have begun to describe themselves as religious “nones,” while the share of Americans who are truly observant has not diminished.

The results of the Religious Landscape Study suggest that relabeling is part of what has taken place, but it is not the whole story. The religious beliefs and practices of the U.S. public as a whole also are changing.

Relabeling. To be sure, the growth of the “nones” is concentrated among people with low or moderate levels of religious commitment. For instance, among those who say religion is “not too important” or “not at all important” in their lives, there has been a sharp rise in the share who identify as “nones.” In the past, some of these people might have claimed a religious affiliation, but they increasingly describe themselves as atheist, agnostic or nothing in particular when asked about their religious identity (68% in 2014, up from 57% in 2007).

Declining Religiosity. At the same time, the share of the population with low levels of observance (e.g., those who seldom or never pray or go to religious services, and who say religion is unimportant in their lives) has, itself, grown. And the percentage of American adults who are highly observant – at least as measured by traditional indicators, such as their certainty of belief in God, frequency of prayer, self-reported rates of attendance at worship services and self-assessments of the importance of religion in their lives – has declined.

Generational Replacement. To understand what is driving religious change, it is important to recognize trends in American society as a whole, not just how individuals change over their lifetimes. Of course, some individuals grow more religious over time, while others grow less religious. And the “nones” may be growing in part because some people in their 40s, 50s and 60s who had only weak ties to religion are dropping any vestige of identification with the faith in which they were raised. But one of the major factors behind the growth of the “nones,” and the declines in traditional forms of religious observance, appears to be generational. Older generations of American adults who were overwhelmingly Christian by affiliation and comparatively devout in belief and behavior are gradually passing away. They are being replaced by a new generation of young people who are, on the whole, less inclined to identify with any branch of Christianity and more religiously unaffiliated than older cohorts ever were, even when they were young. And so far, members of the Millennial generation do not seem to be growing more religiously observant as they get older, at least by traditional measures. On the contrary, the oldest Millennials, now in their late 20s and early 30s, are generally less observant than they were seven years ago. If these trends continue, American society is likely to grow less religious even if those who are adults today maintain their current levels of religious commitment.

Less Religious, but More Spiritual?

While several key indicators of traditional forms of religious observance are declining, the Religious Landscape Study shows that the U.S. population may be becoming more spiritual in certain ways. Roughly six-in-ten adults now say they feel a deep sense of spiritual peace and well-being at least once a week, up 7 percentage points since 2007. And 46% of adults say they feel a deep sense of wonder about the universe on a weekly basis, also up sharply since 2007.

Groups that exhibit the highest levels of traditional forms of religious observance also are most likely to say they regularly experience a sense of spiritual peace and well-being. Nearly two-thirds of religiously affiliated adults, for instance, say they feel a deep sense of spiritual peace at least once a week, compared with four-in-ten religious “nones.” And among the religiously affiliated, about eight-in-ten Mormons and three-quarters of those in the evangelical and historically black Protestant traditions (some of the most religiously observant groups in the U.S.) say they experience a deep sense of spiritual peace at least once a week.

But there is little difference between the religiously affiliated and religious “nones” on the question about feelings of wonder about the universe. And the increases seen on both of the questions about spiritual experiences are demographically broad-based, having occurred among those who are religiously affiliated and religious “nones,” among people of all ages, among both men and women, and in all regions of the country.

Growing Share Experience Regular Feelings of Spiritual Peace, Well-Being; Wonder About Universe
Large Majority Regularly Feels Strong Sense of Gratitude

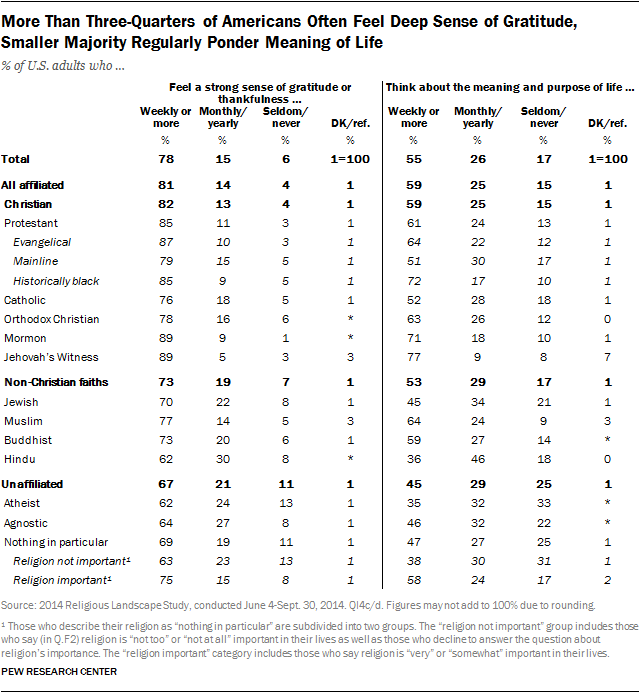
To explore other aspects of spirituality, the 2014 survey included two new questions that were not asked in the 2007 Religious Landscape Study. The first question asked respondents how often they feel a strong sense of gratitude or thankfulness. More than three-quarters of adults – including 82% of Christians – say they feel a strong sense of gratitude or thankfulness at least once a week. Large majorities of those belonging to non-Christian faiths (including 77% of Muslims, 73% of Buddhists, 70% of Jews and 62% of Hindus) also report regularly feeling a strong sense of gratitude, as do two-thirds of the religiously unaffiliated.

The study finds that regularly feeling a strong sense of gratitude is most common among those who are highly religiously observant. Fully 90% of those who say they attend religious services at least once a week also say they feel a deep sense of gratitude at least once a week, as do 88% of those who say religion is “very important” in their lives. But gratitude also is experienced regularly by many people who are not very religiously observant. For example, two-thirds of people who say they seldom or never attend religious services say they regularly feel a deep sense of gratitude (67%), as do 62% of those who say religion is “not too” or “not at all” important in their lives.

In addition to asking about feelings of gratitude, the new study also asked respondents how often they think about the meaning and purpose of life. Slightly more than half of Americans (55%) – including 59% of Christians, 53% of members of non-Christian faiths and 45% of religious “nones” – say they think about the meaning and purpose of life at least once a week. Regular contemplation of life’s meaning is most common among those who are religiously observant in a variety of ways. For example, two-thirds of those who say religion is “very important” in their lives (67%) also say they regularly think about the meaning and purpose of life, compared with 38% of those who say religion is “not too” or “not at all” important to them.

For more details on the study’s findings about Americans’ spiritual experiences, see Chapter 2.

Views of Religious Institutions

Religious Institutions Widely Viewed as Forces for Societal Good

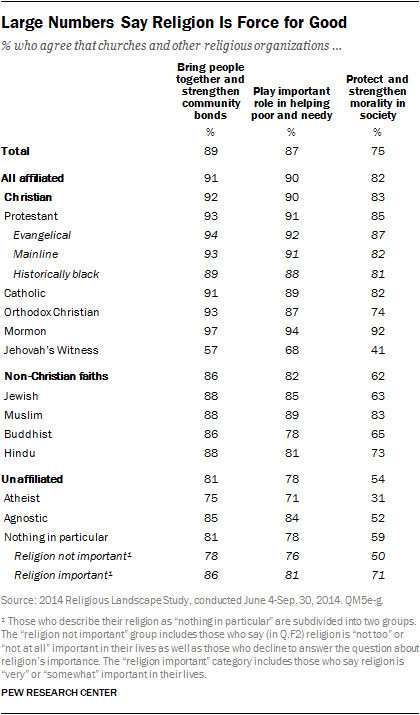
The new study shows that most Americans continue to view organized religion as a force for good in American society. Nearly nine-in-ten adults say churches and other religious institutions bring people together and strengthen community bonds and that they play an important role in helping the poor and needy. And three-quarters say churches and other religious institutions help protect and strengthen morality in society. Attitudes on these questions are little changed from 2012, when they were first asked in a Pew Research Center survey.

These views are widely held even by the religiously unaffiliated, though the survey suggests that many religious “nones” are ambivalent or hold conflicting views about organized religion’s impact on society. In addition to saying that churches and other religious institutions perform good works, large numbers of the unaffiliated also say religious institutions are too concerned with money and power, too involved in politics and too focused on rules.

When all of the survey’s questions about religious institutions are analyzed together, they show that 42% of adults have a mostly positive view of religious institutions – that is, they agree with all three positive statements (that religious institutions strengthen community bonds, help the poor and protect morality) while agreeing with no more than one negative statement, or they agree with two positive and zero negative statements. Far fewer adults (7%) express mostly negative views about churches and other religious organizations – meaning they agree with all three negative statements (that religious institutions are too concerned with money and power, too involved in politics and too focused on rules) while agreeing with no more than one positive statement, or they agree with two negative and zero positive statements. Half of the public expresses mixed views.

Views of Religious Institutions: Half Express Mixed Views, 4-in-10 Positive Reviews

Americans who identify with a religion are fairly evenly divided between those who express mostly positive views of religious institutions (49%) and those who express mixed views (46%). Few religiously affiliated adults (5%) express mostly negative views of religious institutions. Most religious “nones” (62%) express mixed views of religious institutions, with the remainder divided between those who express mostly positive views (21%) and those who express mostly negative views (16%).

For more details on American views of religious institutions, see Chapter 3.

Social and Political Values

Changing Religious Composition of Party Coalitions

In addition to exploring religious beliefs and practices, the new Religious Landscape Study also includes questions about Americans’ partisan allegiances and their social and political values. The survey data show that Christians are declining and religious “nones” are growing within both major political parties. But the changing religious composition of the U.S. population is particularly evident among the Democratic coalition.

Fewer than two-thirds of Democrats and Democratic-leaning adults now identify with any branch of Christianity, down 11 percentage points since 2007. Meanwhile, nearly three-in-ten Democrats say they have no religion, up 9 points in recent years. Religious “nones” now constitute the single largest religious category in the Democratic coalition. As recently as 2007, mainline Protestants, evangelical Protestants and Catholics were each about as numerous as – or more numerous than – the religiously unaffiliated among Democrats and Democratic-leaning adults.

Religious “nones” also are growing within the Republican coalition, but they are doing so at a slower rate; 14% of Republicans and Republican-leaning adults now say they have no religious affiliation, up modestly from 10% in 2007. More than eight-in-ten Republicans continue to identify with Christianity, including nearly four-in-ten Republicans and Republican-leaning adults who identify with evangelical Protestant denominations.

While the religious “nones” are growing within the population as a whole and especially among Democrats, their potential political impact is mitigated by comparatively low levels of engagement in the political process. About seven-in-ten adults who identify with a religion (71%) say they are sure they are registered to vote, but just 62% of religious “nones” say the same. And exit polls show that as a share of the electorate, religious “nones” are growing very slowly. In the 2012 presidential election, for instance, 12% of voters identified themselves as religiously unaffiliated, which was identical to the share in 2008 and only slightly higher than the shares in 2004 (10%) and 2000 (9%).

Views on Homosexuality and Abortion

Broad-Based Growth in Acceptance of Homosexuality, but Attitudes About Abortion Comparatively Stable

The new survey also asked respondents about their views on a number of social issues, including homosexuality. The survey finds that acceptance of homosexuality is growing rapidly even among religious groups that have traditionally been strongly opposed to it. For instance, more than a third of evangelical Protestants now say homosexuality should be accepted by American society, up 10 points since 2007. And acceptance of homosexuality has jumped by 12 points among Mormons.

Compared with views on homosexuality, there has been little change in Americans’ attitudes about abortion. Among the public as a whole, slightly more than half (53%) say abortion should be legal in all or most cases. Views on abortion have changed little across most major religious groups, although those who are unaffiliated and those who belong to historically black Protestant churches are somewhat more likely to support legal abortion than in the recent past.

The shifts in attitudes toward homosexuality among the largest religious groups are being driven partly by young adults, who are much more accepting of homosexuality than older Americans. Among evangelical Protestants, for example, 51% of Millennials say homosexuality should be accepted, compared with about a third of Baby Boomers and a fifth of those in the Silent generation. Similar patterns are seen among mainline Protestants, in the historically black Protestant tradition and among Catholics.

Deep Generational Divides in Views of Homosexuality and Same-Sex Marriage ...

The survey also finds generation gaps within many religious groups in attitudes about a variety of other social and political issues. Young adults generally express more politically liberal opinions than older people when asked about the environment, the proper size and scope of government, and immigration. One exception to this pattern is abortion; here, generational differences within religious groups are less consistent. For example, Millennials who are evangelical Protestants are no more supportive of abortion rights than evangelicals from the Baby Boom or Silent generations, and Millennials in the mainline Protestant tradition are somewhat less supportive of legal abortion (55%) than those in older generations. And while Catholics in the Silent generation are more opposed to legal abortion than other Catholics, there is little difference in the views of Catholic Baby Boomers, Generation Xers and Millennials.

For more details on the social and political views of religious groups, see Chapter 4.

Other Key Findings

The remainder of this report provides many more details on the study’s findings and on the religious beliefs and practices and social and political values of the religious groups that populate the U.S. landscape. Other key findings include:

  • Like the growth of the religiously unaffiliated, the growing share of people who exhibit low levels of traditional forms of religious observance is demographically broad-based. Religious commitment – as measured by respondents’ self-assessments of religion’s importance in their lives, frequency of prayer and religious attendance – has declined among men and women, college graduates and those with less education, married and unmarried respondents, people in every region of the country and people with various racial and ethnic backgrounds.
  • While the vast majority of Americans continue to say they believe in God, the share of adults who profess belief in God has declined from 92% to 89% since 2007, and the share of those who express absolutely certain belief in God has declined by 8 points during the same period. The decline in belief in God has been particularly steep among the religiously unaffiliated, but even Christians increasingly express uncertainty about the existence of God; while nearly all Christians in the survey (98%) believe in God, 76% now say they are absolutely certain that God exists, down from 80% in the first Religious Landscape Study in 2007.
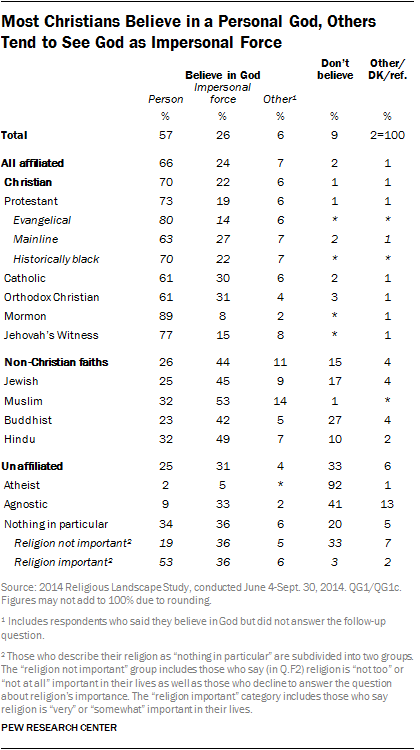
  • As was the case in 2007, there are important differences in the ways members of various religious traditions conceive of God. Seven-in-ten Christians say they think of God as a person with whom people can have a relationship, while 22% say they think of God as an impersonal force. Among members of non-Christian faiths, 26% say they think of God as a person, and 44% say they view God as an impersonal force; 15% of members of non-Christian faiths say they do not believe in God at all. Muslims are an important exception: Only 1% of U.S. Muslims say they do not believe in God or a universal spirit. (For more details on how Americans conceive of God, see Chapter 1.)
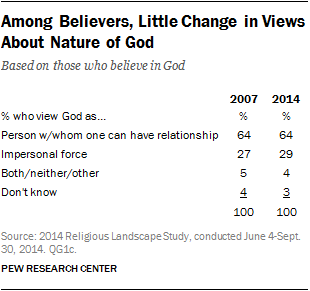
  • While the share of Americans who believe in God has ticked downward, among those who do believe in God, there has been very little change in views about God’s nature. Currently, roughly two-thirds of adults who believe in God (64%) say they see God as a person with whom they can have a relationship, and 29% say they view God as an impersonal force. When the Religious Landscape Study was first conducted in 2007, 64% of those who believed in God said they think of God as a person, and 27% said they view God as an impersonal force.
  • Six-in-ten adults – and three-quarters of Christians – believe the Bible or other holy scripture is the word of God. Roughly three-in-ten adults (31%) and four-in-ten Christians (39%) go a step further and say the Bible should be interpreted literally, word for word. Biblical literalism is most common among those in the historically black Protestant tradition (59%) and evangelical Protestant tradition (55%). Among religious “nones,” there has been a modest decline in the share who say the Bible is the word of God (from 25% in 2007 to 21% in 2014).
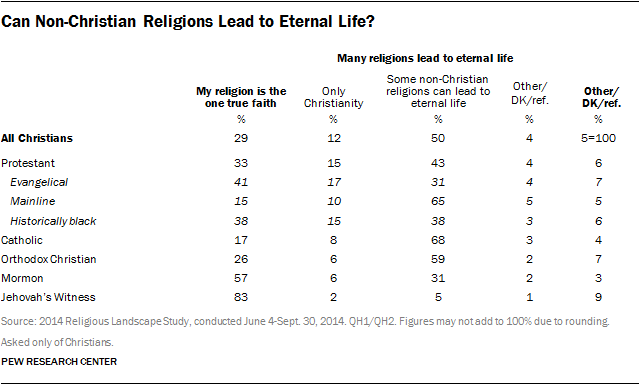
  • Adults who identify with a specific religion were asked whether they see their religion as “the one, true faith leading to eternal life” or if, in their view, “many religions can lead to eternal life.” Christians who believe that many religions can lead to eternal life were subsequently asked if “only Christian religions can lead to eternal life” or if “some non-Christian religions can lead to eternal life.” Among Christians, two-thirds say many religions can lead to eternal life, and most of them (50% of all Christians) say some non-Christian religions can lead to life everlasting. The view that some non-Christian faiths can lead to eternal life is held by roughly two-thirds of Catholics (68%) and mainline Protestants (65%), as well as 59% of Orthodox Christians. Fewer members of the historically black Protestant tradition (38%), evangelical Protestants (31%) and Mormons (31%) say some non-Christian religions can lead to salvation. Just 5% of Jehovah’s Witnesses say some non-Christian faiths can lead to eternal life. (For more details on Americans’ view of eternal life, including comparisons with 2007, see Chapter 1.)
  • Among those who are affiliated with a religion, 46% say they want their church or denomination to preserve its traditional beliefs and practices, while 34% want their church or denomination to adjust its traditional beliefs and practices in light of new circumstances. Far fewer (14%) say they want their religious group to adopt modern beliefs and practices. These results are very similar to those from the 2007 Religious Landscape Study. (For more details, see Chapter 1.)
  • Fully 85% of Jehovah’s Witnesses say they attend religious services at least once a week, as do 77% of Mormons. Most evangelical Protestants (58%) and members of historically black Protestant churches (53%) also report attending religious services at least once a week. Among most other religious groups, however, fewer than half of adherents say they attend religious services weekly.
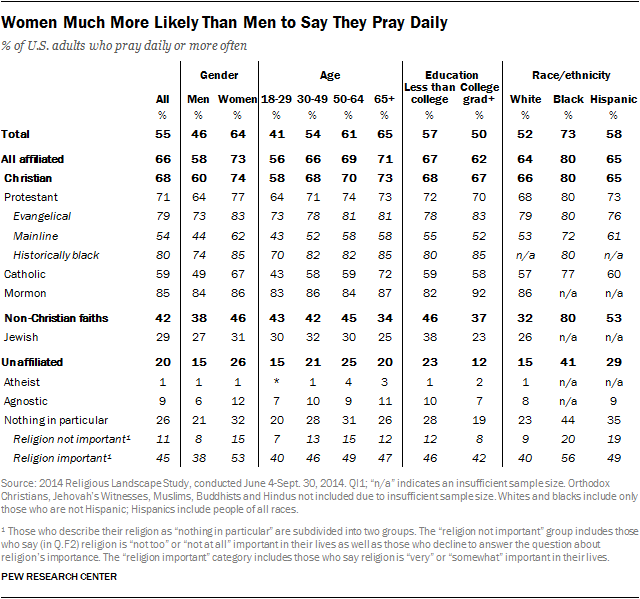
  • Nearly two-thirds of U.S. women (64%) say they pray every day. By comparison, fewer than half of U.S. men (46%) say they pray daily. Women also are more likely than men to say they attend religious services on a weekly basis (40% vs. 31%).
  • The survey asked respondents what they think about three changes that have taken place in American society over the last 50 years: more women in the workforce, more people having children without getting married and the growing population of immigrants. In regard to each of these changes, respondents were asked whether it “has been a change for the better, a change for the worse, or hasn’t this made much difference?” Large majorities in most religious groups say having more women in the workforce has been a change for the better. There is less consensus about more children being born out of wedlock. Most Christians and Muslims say this has been a change for the worse. Jews, by contrast, are more divided between those who see increasing out-of-wedlock births as a change for the worse and those who say it has not made much difference. And most atheists and agnostics say this development is neither positive nor negative.
  • The public is divided on the impact of immigration; 35% say the growing population of immigrants has been a change for the worse, but 26% say it is a change for the better and 30% say it has not made much difference. Nearly half of evangelical Protestants say the growing number of immigrants has been a change for the worse, far higher than the share of other religious groups who say the same. Full details on the questions about changes in American society are available in Chapter 4.

About the 2014 U.S. Religious Landscape Study

This is the second report on findings from the 2014 U.S. Religious Landscape Study, the centerpiece of which is a nationally representative telephone survey of 35,071 adults. The first report on the study’s findings was published on May 12, 2015; it focused on the changing religious composition of the United States and described the demographic characteristics of U.S. religious groups. It also summarized patterns in religious switching and intermarriage.

The new report describes the religious beliefs and practices of the U.S. public and assesses how they have changed over time. It also documents the social and political values of the religious groups that populate the U.S. religious landscape.

This is the second time Pew Research Center has conducted a Religious Landscape Study. The first was conducted in 2007, also with a telephone survey of more than 35,000 Americans. With more than 35,000 interviews each, both the 2007 and 2014 studies have margins of error of less than 1 percentage point, making it possible to identify even relatively small changes in the U.S. religious landscape.

Other findings from the 2014 Religious Landscape Study will be released later this year. In addition to the written reports, the Religious Landscape Study’s findings are available through a new interactive tool. The online presentation allows users to delve more deeply into the survey’s findings, build interactive maps or charts and explore the data most interesting to them.

Acknowledgments

Many individuals from Pew Research Center contributed to this report. Alan Cooperman, director of religion research, oversaw the effort and served as the primary editor. Gregory A. Smith, associate director for religion research, served as the primary researcher and wrote the Methodology. Cooperman, Smith and Sandra Stencel (associate director, editorial) co-authored the Overview. The chapter on religious beliefs was written by Senior Researcher Besheer Mohamed. Research Associate Becka A. Alper wrote the chapter on religious practices and experiences and co-wrote, with Smith, the appendix comparing findings from the Religious Landscape Study with other religion surveys. Senior Writer Caryle Murphy wrote the chapter on views of religious institutions. The chapter on social and political attitudes was written by Mohamed and Research Assistant Claire Gecewicz. Gecewicz prepared the detailed tables. The report was number checked by Alper, Gecewicz, Mohamed, Senior Researcher Jessica Martinez and Research Associate Elizabeth Sciupac. The report was edited by Stencel, Michael Lipka, Murphy and Aleksandra Sandstrom. Bill Webster created the graphics. Stacy Rosenberg, Russell Heimlich, Diana Yoo, Besheer Mohamed, Benjamin Wormald and Juan Carlos Esparza Ochoa developed the interactive tool.

Pew Research Center’s methods team provided advice on the sampling plan, questionnaire design, weighting strategy and data analysis. The methods team, led by Director of Survey Research Scott Keeter, includes incoming Director of Survey Research Courtney Kennedy, Research Methodologists Kyley McGeeney and Andrew Mercer, Research Assistant Nicholas Hatley and graduate student intern H. Yanna Yan.

Others at Pew Research Center who provided research guidance include President Michael Dimock, Vice President for Research Claudia Deane and Demographer Conrad Hackett. Communications support was provided by Andrew Cohen, Rhonda Stewart, Erin O’Connell and Stefan S. Cornibert.

John C. Green, director of the Ray C. Bliss Institute of Applied Politics at the University of Akron, served as a senior adviser on the Religious Landscape Studies, providing valuable advice on the survey questionnaires, categorization of respondents and drafts of the reports. Additionally, Pew Research Center received helpful comments on this report from Mike Hout, professor of sociology, New York University; Lyman A. Kellstedt, professor emeritus of political science, Wheaton College; and Corwin E. Smidt, professor emeritus of political science, Calvin College. We also received valuable advice from Luis Lugo, former director of Pew Research Center’s Religion & Public Life project, and the late Andrew Kohut, founding director of Pew Research Center.

Funding for the 2014 Religious Landscape Study comes from The Pew Charitable Trusts, which received generous support for the project from Lilly Endowment Inc.

While the analysis was guided by our consultations with the advisers, Pew Research Center is solely responsible for the interpretation and reporting of the data.

Roadmap to the Report

The remainder of this report explores in greater depth many of the key findings summarized in this Overview. Chapter 1 offers a detailed look at the religious beliefs of the U.S. population and how they have changed in recent years. Chapter 2 examines religious practices and experiences. Chapter 3 includes an analysis of the public’s views of religious institutions. Chapter 4 describes the social and political values of many religious groups in the United States. Appendix A describes the methodology used to conduct the study. Appendix B compares findings from the Religious Landscape Studies with other major religion surveys and puts the current results into the context of longer-term trends.
Chapter 1: Importance of Religion and Religious Beliefs

While religion remains important in the lives of most Americans, the 2014 Religious Landscape Study finds that Americans as a whole have become somewhat less religious in recent years by certain traditional measures of religious commitment. For instance, fewer U.S. adults now say religion is very important in their lives than did so seven years ago, when Pew Research Center conducted a similarly extensive religion survey. Fewer adults also express absolutely certain belief in God, say they believe in heaven or say their religion’s sacred text is the word of God.

The change in Americans’ religious beliefs coincides with the rising share of the U.S. public that is not affiliated with any religion. The unaffiliated not only make up a growing portion of the population, they also are growing increasingly secular, at least on some key measures of religious belief. For instance, fewer religious “nones” say religion is very important to them than was the case in 2007, and fewer say they believe in God or believe in heaven or hell.

Among people who do identify with a religion, however, there has been little, if any, change on many measures of religious belief. People who are affiliated with a religious tradition are as likely now as in the recent past to say religion is very important in their lives and to believe in heaven. They also are as likely to believe in God, although the share of religiously affiliated adults who believe in God with absolute certainty has declined somewhat.

When seeking guidance on questions of right and wrong, a plurality of Americans say they rely primarily on their common sense and personal experiences. But there has been a noticeable increase in the share of religiously affiliated adults who say they turn to their religious teachings for guidance.

This chapter takes a detailed look at the religious beliefs of U.S. adults – including members of a variety of religious groups – and compares the results of the current study with the 2007 Religious Landscape Study. The chapter also examines Americans’ views on religion and salvation, religion and modernity, and religion and morality.

Importance of Religion

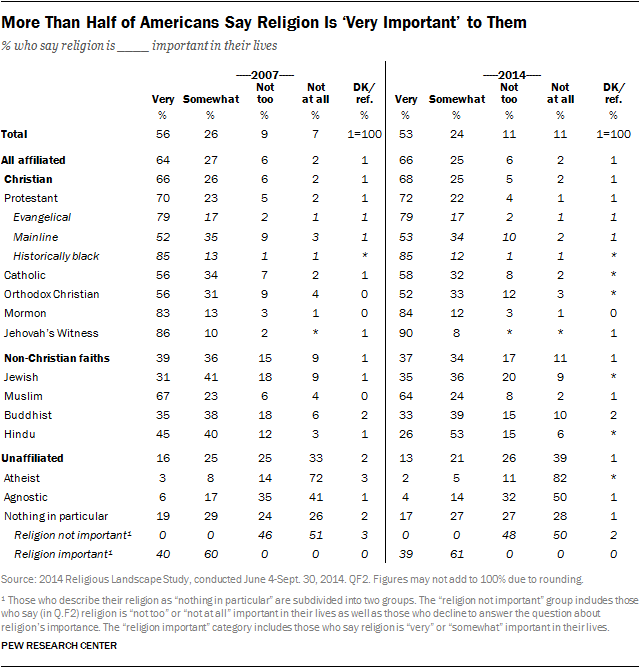
Three-quarters of U.S. adults say religion is at least “somewhat” important in their lives, with more than half (53%) saying it is “very” important. Approximately one-in-five say religion is “not too” (11%) or “not at all” important in their lives (11%).

Although religion remains important to many Americans, its importance has slipped modestly in the last seven years. In 2007, Americans were more likely to say religion was very important (56%) or somewhat important (26%) to them than they are today. Only 16% of respondents in 2007 said religion was not too or not at all important to them.

The decline in the share of Americans who say religion is very important in their lives is closely tied to the growth of the religiously unaffiliated, whose share of the population has risen from 16% to 23% over the past seven years. Compared with those who are religiously affiliated, religious “nones” are far less likely to describe religion as a key part of their lives; just 13% say religion is very important to them. Furthermore, the share of the “nones” who say religion is not an important part of their lives has grown considerably in recent years. Today, two-thirds of the unaffiliated (65%) say religion is not too or not at all important to them, up from 57% in 2007.

For Americans who are religiously affiliated, the importance people attach to religion varies somewhat by religious tradition. Roughly eight-in-ten or more Jehovah’s Witnesses (90%), members of historically black Protestant churches (85%), Mormons (84%) and evangelical Protestants (79%) say religion is very important in their lives. These figures have stayed about the same in recent years.

Smaller majorities of most other religious groups say religion plays a very important role in their lives. This includes 64% of Muslims, 58% of Catholics and 53% of mainline Protestants. Roughly half of Orthodox Christians (52%) also say this. Fewer Jews, Buddhists and Hindus say religion is very important to them, but most members of those groups indicate that religion is at least somewhat important in their lives.

The survey also finds that older adults are more likely than younger adults to say religion is very important in their lives, and women are more likely than men to express this view. Additionally, those with a college degree typically are less likely than those with lower levels of education to say religion is very important in their lives. And blacks are much more likely than whites or Hispanics to say religion is very important in their lives. These patterns are seen in the population as a whole and within many – though not all – religious groups.

Belief in God

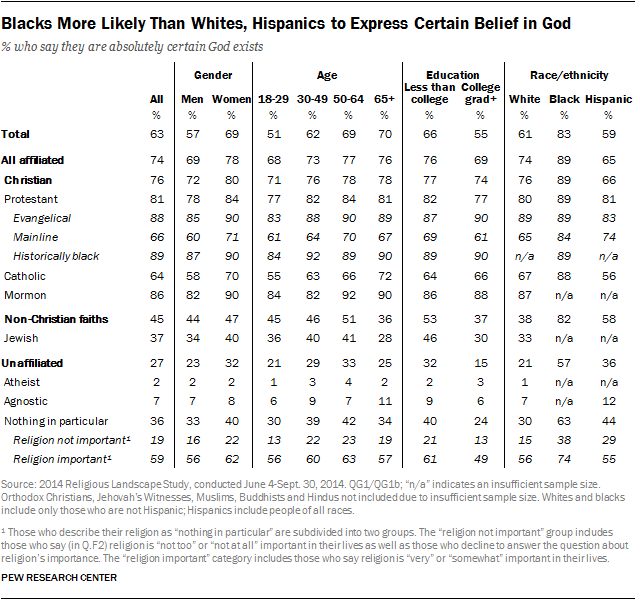
Nearly nine-in-ten Americans (89%) say they believe in “God or a universal spirit,” and most of them (63% of all adults) are absolutely certain in this belief. There has been a modest decline in the share of Americans who believe in God since the Religious Landscape Study was first conducted in 2007 (from 92% to 89%), and a bigger drop in the share of Americans who say they believe in God with absolute certainty (from 71% to 63%).

Majorities of adherents of most Christian traditions say they believe in God with absolute certainty. But this conviction has declined noticeably in recent years among several Christian groups. The largest drops have been among mainline Protestants (down from 73% in 2007 to 66% today), Catholics (from 72% to 64%) and Orthodox Christians (from 71% to 61%).

Among non-Christians, the pattern is mixed. Most Muslims (84%) are absolutely certain that God exists, but far fewer Hindus (41%), Jews (37%) or Buddhists (29%) are certain there is a God or universal spirit.

As was the case in 2007, most religiously unaffiliated people continue to express some level of belief in God or a universal spirit. However, the share of religious “nones” who believe in God has dropped substantially in recent years (from 70% in 2007 to 61% today). And religious “nones” who believe in God are far less certain about this belief compared with those who identify with a religion. In fact, most religiously unaffiliated believers say they are less than absolutely certain about God’s existence.

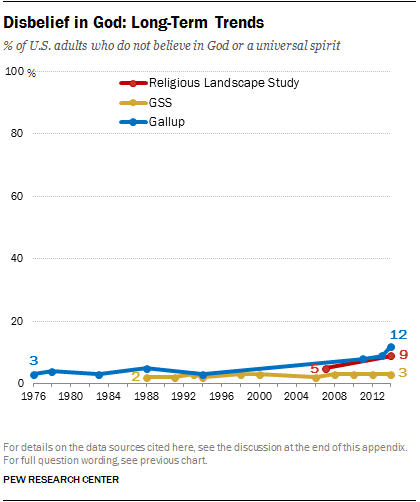
Nearly one-in-ten U.S. adults overall (9%) now say they do not believe in God, up from 5% in 2007.

Women are much more likely than men to say they are absolutely certain about God’s existence (69% vs. 57%), and older Americans are much more likely than younger adults to say they are absolutely convinced that God exists. Two-thirds of those with less than a college degree express certainty about God’s existence, compared with 55% of college graduates. Additionally, 83% of blacks say they are absolutely certain about God’s existence, while roughly six-in-ten whites (61%) and Hispanics (59%) hold this view.

There is considerable variation in the way members of different religious groups conceive of God. For example, seven-in-ten Christians think of God as a person with whom people can have a relationship. Only about a quarter of those who belong to non-Christian faiths (26%) share this view. Among non-Christian faiths, it is more common to see God as an impersonal force.

Among the religiously unaffiliated, roughly three-in-ten (31%) say God is an impersonal force, a quarter say God is best viewed as a person and a third say God does not exist. However, among the subset of religious “nones” who describe their religion as “nothing in particular” and who also say religion is very or somewhat important in their lives, a slim majority (53%) say they believe in a personal God.

Although the share of adults who believe in God has declined modestly in recent years, among those who do believe in God, views about the nature of God are little changed since 2007. In both 2007 and 2014, roughly two-thirds of people who believe in God said they think of God as a person, while just under three-in-ten see God as an impersonal force.

Beliefs About the Afterlife

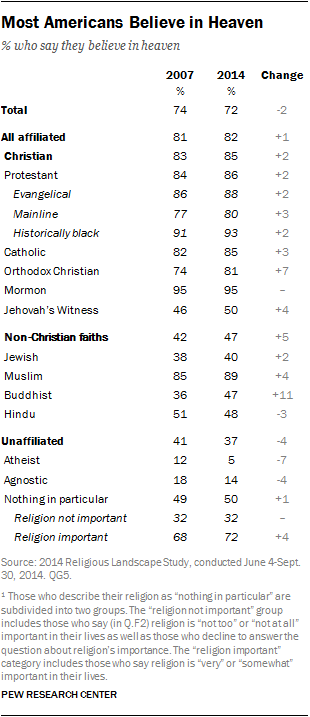
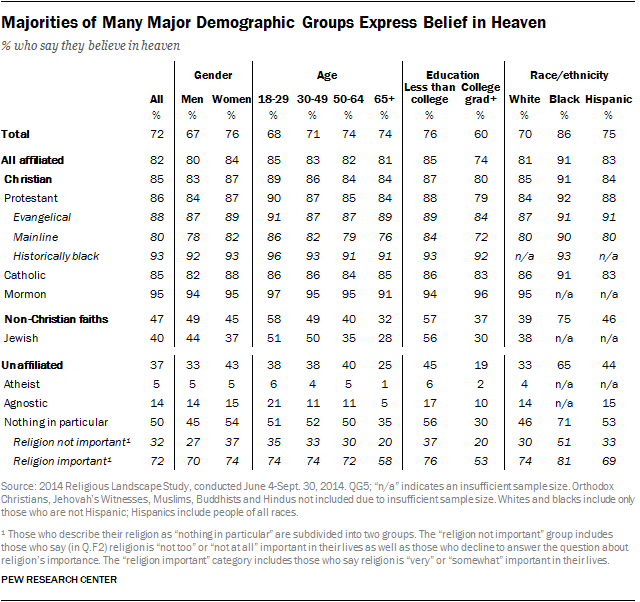
Roughly seven-in-ten Americans (72%) believe in “a heaven, where people who have led good lives are eternally rewarded.”

Belief in heaven is nearly universal among Mormons (95%) and members of the historically black Protestant tradition (93%). Belief in heaven also is widely held by evangelical Protestants (88%), Catholics (85%), Orthodox Christians (81%) and mainline Protestants (80%).

The vast majority of Muslims (89%) also believe in heaven. About half of Hindus in the survey (48%) say they believe in heaven, as do 47% of Buddhists surveyed.

The only groups where significantly fewer than half say they believe in heaven are Jews (40%) and the unaffiliated (37%). While relatively few atheists or agnostics believe in heaven, a large share of those whose religion is “nothing in particular” and who also say religion is at least somewhat important in their lives do believe in heaven (72%).

The survey also finds that, overall, women are more likely than men to say they believe in heaven, and those with less than a college degree are more likely than those with a college degree to express this view. Slightly bigger shares of blacks and Hispanics than whites say they believe in heaven, and older Americans are slightly more likely than younger adults to hold this belief. In many cases, however, these demographic differences in belief in heaven are smaller within religious traditions than among the public as a whole. Among evangelical Protestants, for example, men are just as likely as women to believe in heaven, and young people are just as likely as older evangelicals to hold this belief.

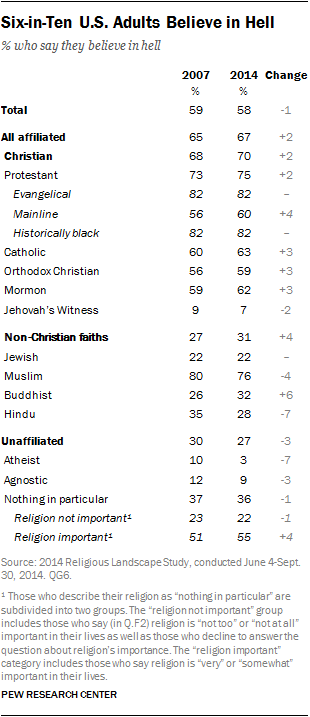
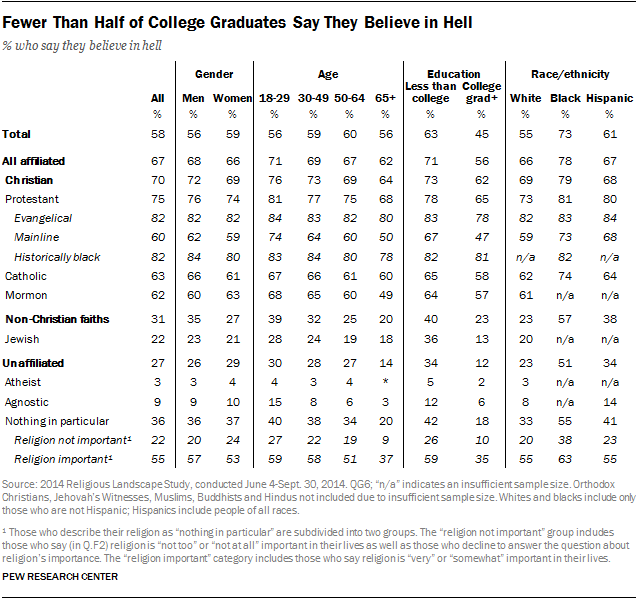
Belief in “hell, where people who have lived bad lives and die without being sorry are eternally punished,” is less widespread than belief in heaven. About six-in-ten Americans (58%) believe in hell, little changed from 2007.

Belief in hell is most common among members of historically black Protestant churches (82%) and evangelical Protestant churches (82%). Somewhat fewer Catholics (63%), Mormons (62%), mainline Protestants (60%) and Orthodox Christians (59%) say they believe in hell.

Three-quarters of U.S. Muslims (76%) believe in hell, but belief in hell is less common among other non-Christian groups, including Buddhists (32%), Hindus (28%), Jews (22%) and the religiously unaffiliated (27%).

U.S. adults with less than a college degree are more likely than college graduates to say they believe in hell, and blacks are more likely than Hispanics and whites to believe in hell. However, there are minimal differences between men and women and between younger and older adults on this question.

Beliefs About Holy Scripture

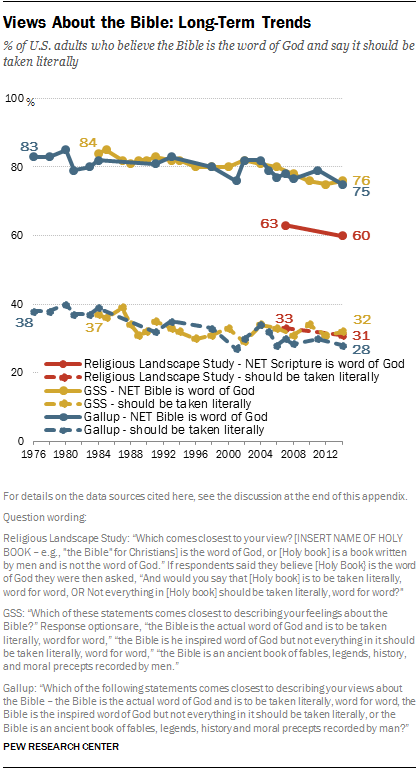
Six-in-ten Americans (60%) view their religion’s sacred text as the word of God. This represents a slight decline from 2007, when 63% of the public held this view. Within most religious groups, there has been little movement on this question, but among the unaffiliated, there has been a modest decline in the share who view the Bible as the word of God (from 25% to 21%).

Three-quarters of Christians believe the Bible is the word of God, including about nine-in-ten evangelicals (88%), Mormons (91%) and Jehovah’s Witnesses (94%). Among members of other Christian traditions, smaller majorities say the Bible is the word of God.

Although there is widespread agreement across Christian groups on this question, there is disagreement about whether the Bible can be taken “literally, word for word.” Most evangelical Protestants (55%) and members of historically black Protestant churches (59%) believe the Bible should be taken literally, but fewer Christians from other traditions espouse a literalist view of the Bible. There has been little change in recent years in the share of Christians who believe the Bible should be interpreted literally, word for word.

Most Muslims (83%) accept the Quran (also spelled Koran) as the word of God. Far fewer Jews (37%), Hindus (29%) and Buddhists (15%) say their scripture is the word of God.

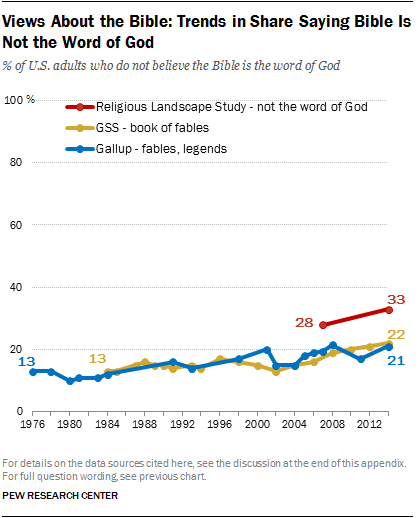
The share of the unaffiliated who believe the Bible was written by men and is not the word of God has risen by 8 percentage points in recent years, from 64% in 2007 to 72% in 2014. But while most religious “nones” say the Bible was written by men, about half of those who say they have no particular religion and who also say religion is at least somewhat important in their lives believe the Bible is the word of God (51%).

As on some other traditional measures of religious belief, older adults are more likely than younger adults to say their religion’s holy text is the word of God. And those with less than a college degree also are much more likely than college graduates to say their religion’s scripture is the word of God. Additionally, more women than men and more blacks than Hispanics and whites say their religion’s holy text is the word of God. For the most part, however, differences in beliefs about the Bible are larger across religious traditions (e.g., between evangelicals and Catholics and religious “nones”) than differences between demographic groups within the same religious tradition.

Beliefs About Religion and Modernity

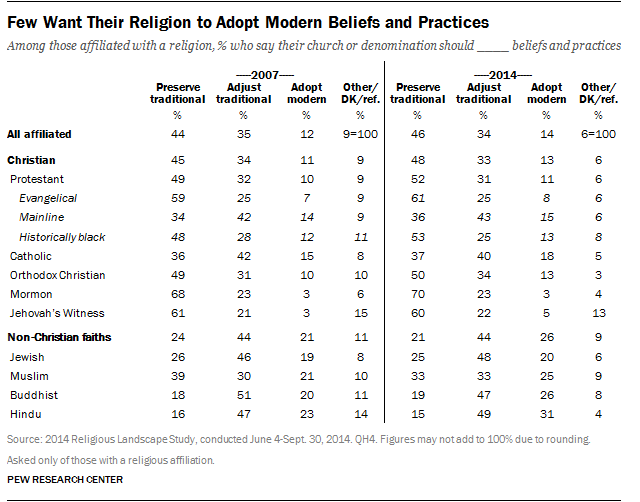
Respondents in the survey who are affiliated with a religion were asked to choose one of three statements that best reflects their view of how their religion should engage with modernity. A plurality of religiously affiliated Americans (46%) believe their religion should “preserve traditional beliefs and practices.” A third (34%) say their congregation or denomination should “adjust traditional beliefs and practices in light of new circumstances.” Only 14% of people who are affiliated with a religious tradition say their religion should “adopt modern beliefs and practices.”

These findings are little changed from 2007, when 44% of affiliated respondents said their religion should preserve its traditional beliefs and practices, 35% said their religion should adjust its traditional beliefs and 12% said their religion should adopt modern beliefs and practices.

The belief that their religion should preserve traditional practices is held by most Mormons (70%), Jehovah’s Witnesses (60%), evangelical Protestants (61%) and members of historically black Protestant churches (53%), as well as half of Orthodox Christians (50%).

Muslims are closely divided on whether their religion should preserve traditional beliefs and practices or adjust traditional beliefs and practices in light of new circumstances. Among other religious groups, including Jews, mainline Protestants and Catholics, the most common view is that religions should adjust traditional practices.

Paths to Eternal Life

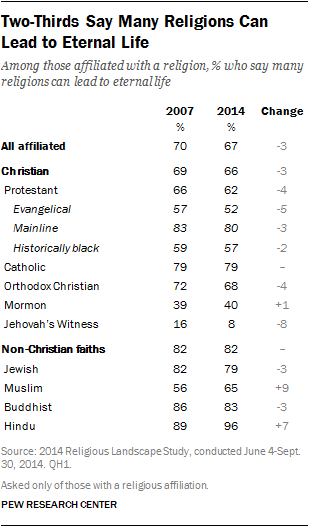
Two-thirds of those who identify with a religious group say many religions (not just their own) can lead to eternal life, down slightly from 2007, when 70% of all religiously affiliated adults said this.

This view is held by the vast majority of mainline Protestants (80%) and Catholics (79%), as well as smaller majorities of Orthodox Christians (68%) and members of historically black Protestant churches (57%) and about half of evangelicals (52%). Fewer than half of Mormons (40%) and only about one-in-ten Jehovah’s Witnesses (8%) believe that many religions can lead to eternal life.

Among the non-Christian religious traditions that are large enough to be analyzed, most say many religions can lead to eternal life.

Most Christians who say many religions can lead to eternal life also say non-Christian religions can lead to heaven. In fact, half of all Christians say some non-Christian faiths can lead to eternal life, while about four-in-ten say either that theirs is the one true faith leading to eternal life or that only Christianity can result in everlasting life. About one-in-ten Christians express no opinion or provide other views on these matters.

Two-thirds of Catholics (68%) and mainline Protestants (65%) say some non-Christian religions can lead to eternal life, as do 59% of Orthodox Christians. This view is less common among other Christian groups. Roughly four-in-ten members of historically black Protestant denominations (38%) say some non-Christian religions can lead to eternal life, as do three-in-ten evangelical Protestants and Mormons (31% each). Very few Jehovah’s Witnesses (5%) believe this.

Religion and Morality

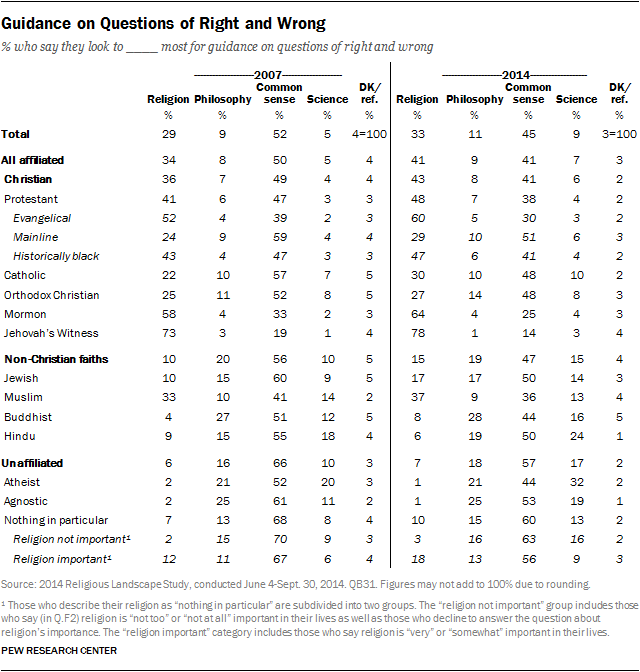
When looking for answers to questions about right and wrong, more Americans say they turn to practical experience and common sense (45%) than to any other source of guidance. The next most common source of guidance is religious beliefs and teachings (33%), while far fewer turn to philosophy and reason (11%) or scientific information (9%).

Since the 2007 Religious Landscape Study, however, the share of U.S. adults who say they turn to practical experience has decreased by 7 percentage points (from 52% to 45%) while the share who say they look to religious teachings has increased by 4 points (from 29% to 33%). This turn to religious teachings as a source of moral guidance has occurred across many religious traditions, with the largest increases among evangelical Protestants and Catholics.

Six-in-ten or more evangelical Protestants, Mormons and Jehovah’s Witnesses say they turn to religious teachings and beliefs for moral guidance. Members of historically black Protestant churches are more divided: 47% say they rely on religious teachings while 41% rely on practical experience. Fewer Catholics (30%), mainline Protestants (29%) and Orthodox Christians (27%) turn primarily to religion for guidance on questions of right and wrong.

Fewer religious “nones” now say they use common sense and practical experience as their main source of guidance in this area (57%) than said this in 2007 (66%). But instead of finding guidance through religious teachings, more of the “nones” are turning to scientific information; the share who say they rely on scientific information has increased from 10% to 17% in recent years. The reliance on science is most common among self-identified atheists; one-third of this group (32%) relies primarily on scientific information for guidance on questions of right and wrong.

Nearly two-thirds of U.S. adults (64%) say that whether something is right or wrong depends on the situation, while a third say there are clear and absolute standards for what is right or wrong. In 2007, a different question about moral absolutes found that 39% of Americans completely agreed with the statement “there are clear and absolute standards for what is right and wrong.”

While Christians overall are more likely than members of other religious groups to say there are absolute standards for right and wrong, there are large differences within Christianity. Nearly six-in-ten Mormons (57%) and Jehovah’s Witnesses (57%) say there are clear standards for right and wrong. Evangelical Protestants are divided in their opinions, with 50% saying there are absolute standards and 48% saying it depends on the situation. Fewer Orthodox Christians (33%), mainline Protestants (32%), Catholics (30%) and members of the historically black Protestant tradition (29%) say there are clear and absolute standards of right and wrong.

Among members of non-Christian faiths, about three-quarters assert that determining right from wrong is often situational. Similarly, more than eight-in-ten atheists and agnostics express this view, as do three-quarters of those whose religion is “nothing in particular.”

Chapter 2: Religious Practices and Experiences

Participation in several traditional forms of religious observance has declined in recent years. For example, the share of Americans who say they attend religious services at least once a week has ticked down by 3 percentage points since 2007, as has the share who say they pray every day.

These declines are closely connected to the continued growth of the religiously unaffiliated population. Religious “nones” are far less religiously observant than people who identify with a religion. But among those who are affiliated with a religion, levels of worship attendance and personal prayer have both been very steady since 2007.

While religious service attendance and frequency of prayer have declined among the general public, some indicators of religious engagement have ticked upward, such as the percentage of religiously affiliated adults who share their faith regularly. Growing numbers of Americans also say they regularly feel a deep sense of spiritual peace and well-being or say they feel a deep sense of wonder about the universe.

This chapter explores the ways in which American adults engage in religious practices and experiences, highlighting both how religious participation is changing and how it varies across religious groups.

Worship Service Attendance

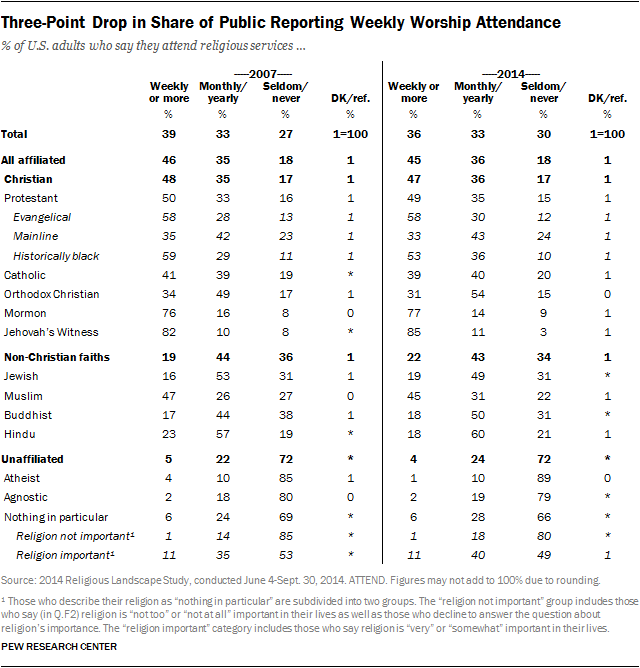
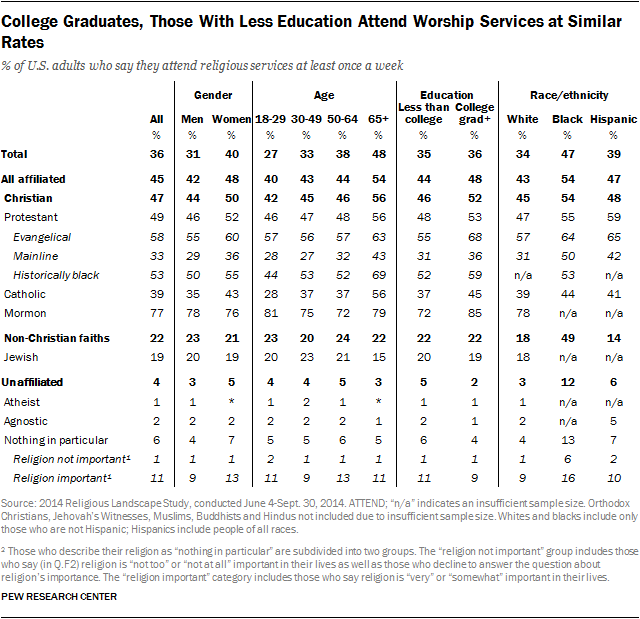
Overall, 36% of Americans now say they attend religious services at least once a week, down from 39% in 2007. This decline is accompanied by a rise in the share of U.S. adults who say they seldom or never attend religious services (from 27% in 2007 to 30% in 2014).10

As they do on many traditional measures of religious observance, Jehovah’s Witnesses and Mormons report the highest levels of regular worship attendance; 85% of Jehovah’s Witnesses say they attend religious services at least once a week, as do 77% of Mormons. Most evangelical Protestants (58%) and roughly half of members of the historically black Protestant tradition (53%) also say they attend religious services at least once a week, though the share of people in the historically black Protestant tradition reporting weekly worship attendance has declined 6 percentage points since 2007. Among other Christian groups, smaller shares (including 39% of Catholics and 33% of mainline Protestants) say they attend church weekly.

Regular attendance among members of non-Christian faiths has remained relatively stable since 2007.

Fully 72% of religiously unaffiliated adults say they seldom or never attend religious services, including nearly nine-in-ten self-identified atheists (89%) and eight-in-ten agnostics (79%). Attending worship services is more common among religious “nones” who describe their religion as “nothing in particular.”

More women than men say they attend religious services at least once a week (40% vs. 31%). This gender gap is evident among a variety of Christian groups, though not among Mormons. And among Christians overall, more blacks than Hispanics and whites say they attend religious services weekly or more.

Older Americans are more likely than younger Americans to say they attend services at least once a week. Among Christian groups, the age gap is particularly large for Catholics; most Catholics ages 65 and older (56%) say they go to church every week, compared with half as many Catholic adults under age 30 (28%). There also are large differences by age among members of the historically black Protestant tradition and mainline Protestants. Age differences in worship attendance are smaller or nonexistent among evangelical Protestants, Mormons and Jews.

Among the adult population overall, there is virtually no difference in frequency of religious service attendance between college graduates and those with less education. Among many Christian groups, however, college graduates are at least somewhat more likely than those with less education to say they attend religious services regularly.

Congregational Membership

Half of U.S. adults say they belong to a local house of worship. Among Christian groups, about seven-in-ten people who identify with the historically black Protestant tradition (72%) and the evangelical Protestant tradition (69%) say they belong to a local congregation. Roughly six-in-ten Catholics (59%) and 57% of mainline Protestants say they are official members of a church. This question was not asked as part of the 2007 Religious Landscape Study.

Adherents of non-Christian religions tend to be less likely than Christians to report official membership in a house of worship. Only one-in-five Buddhists and Hindus are members of a house of worship, along with roughly a third of Muslims (34%). This survey finds that about half of U.S. Jews (53%) say they belong to a synagogue, though other surveys have found lower membership rates, perhaps in part due to different question wording.

Just 8% of U.S. adults who describe themselves, religiously, as atheist, agnostic or “nothing in particular” belong to a local house of worship.

Participation in Scripture Study or Prayer Groups

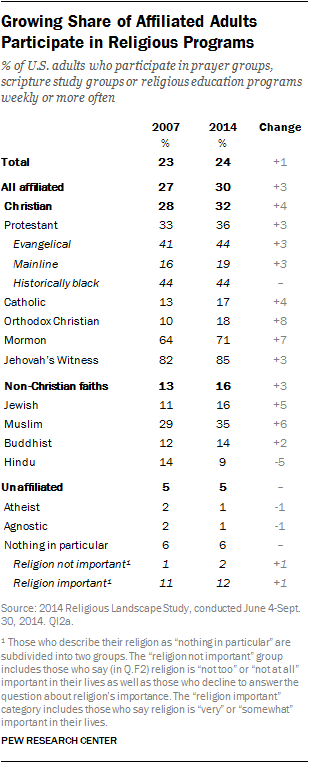
A quarter of American adults (24%) say they participate in prayer groups, scripture study groups or other types of religious education at least once a week. Although the share of Americans who identify with a religion has been shrinking, the percentage of religiously affiliated adults who report participation in prayer groups, scripture study groups or religious education programs is somewhat higher today than it was in 2007 (30% vs. 27%).

Again, Jehovah’s Witnesses and Mormons are notable for their high levels of weekly involvement in these types of groups (85% and 71%, respectively). More than four-in-ten members of evangelical and historically black Protestant churches also participate in such programs at least once a week (44% each).

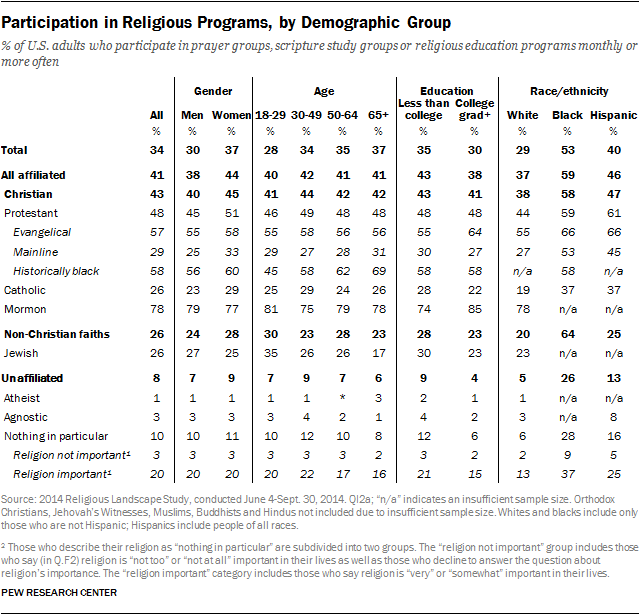
Some of the demographic groups that are especially religiously observant in other ways – including blacks, older adults, women and adults without a college degree – also are more likely than others to say they participate in prayer groups, scripture study groups or religious education programs at least monthly. In several cases, however, these demographic differences are smaller within religious traditions than among the public as a whole.

Private Devotions

While a majority of Americans continue to say they pray at least once a day (55%), the share of U.S. adults who seldom or never pray has increased from 18% to 23% since 2007. This change is mainly tied to the growing share of Americans who say they have no religious affiliation. Religiously unaffiliated adults pray far less frequently compared with those who identify with a religion, and an increasing share of religious “nones” say they seldom or never pray.

Among those who do identify with a religious group, there have been only modest changes in self-reported frequency of prayer. Jehovah’s Witnesses remain among the most prayerful religious groups, with fully 90% saying they pray daily. Large majorities of Mormons (85%), members of the historically black Protestant tradition (80%) and evangelical Protestants (79%) also say they pray every day. Smaller majorities of Catholics (59%), Orthodox Christians (57%) and mainline Protestants (54%) report praying daily.

As with other measures of religious involvement, women are considerably more likely than men to say they pray daily, a pattern seen among many religious traditions. Similarly, older adults engage in daily prayer at much higher rates than younger adults, both among Americans overall and across several religious groups. And across the religiously affiliated and unaffiliated, blacks are much more likely than Hispanics and whites to say they pray on a daily basis.

College graduates are less likely than others to say they pray daily, at least in part because college graduates are far more likely than those with less education to identify as atheists or agnostics (and very few atheists and agnostics pray regularly). Among Christians, there is little difference in frequency of prayer between college graduates and those with less education. And among Mormons and evangelical Protestants in particular, college graduates are noticeably more likely than others to say they pray daily.

As was the case in 2007, the 2014 Religious Landscape Study finds that 35% of U.S. adults say they read scripture at least once a week. Regular scripture reading is most common among Jehovah’s Witnesses (88% of whom say they read scripture at least once a week), Mormons (77%), evangelical Protestants (63%) and members of the historically black Protestant tradition (61%).

Older adults are much more likely than younger adults to say they read scripture weekly or more, and blacks are more likely than Hispanics or whites to say they participate in this activity. Additionally, more women than men say they read scripture at least weekly.

Those with less education are more likely than college graduates to say they read scripture outside of religious services at least weekly, but among some religious groups, such as evangelical Protestants and Mormons, college graduates are more likely to read scripture on a weekly basis.

Four-in-ten Americans say they meditate at least once a week. Regular meditation is common among some groups that exhibit high levels of religious observance on a variety of indicators (e.g., Jehovah’s Witnesses and Mormons). In addition, two-thirds of U.S. Buddhists in the survey (66%) report meditating at least weekly.11

However, sizable minorities of religiously unaffiliated adults, including one-in-five atheists (19%), a quarter of agnostics (24%) and 28% of those who describe their religion as “nothing in particular,” also say they meditate at least once a week. Respondents who say they meditate regularly may or may not do so in a religious sense; many people meditate for reasons other than religion or spirituality.

Sharing One’s Faith

About a quarter of adults in the U.S. who are affiliated with a particular religion (26%) say they share their faith with others at least once a week, up 3 percentage points since 2007. Christians are much more likely than members of non-Christian faiths to share their faith with others.

Jehovah’s Witnesses are known for going door to door to discuss their religion, and 76% say they share their faith with nonbelievers or people from other religious backgrounds at least weekly. A plurality of members of the historically black Protestant tradition (44%) also say they share their faith with others at least once a week.

Religiously unaffiliated respondents were asked how often they share their views on God and religion with religious people. Two-thirds of the unaffiliated (67%) say they seldom or never do this.

As is the case with other forms of religious practice, blacks who are affiliated with a religion are more likely than affiliated Hispanics and whites to say they share their faith at least monthly, and affiliated adults without a college degree are more likely than college graduates to do this.

But when it comes to differences by age among the religiously affiliated, this measure stands out: While older Americans display more religious engagement in several other ways, younger adults are slightly more likely than those ages 65 and older to share their faith.

Speaking in Tongues, Observance of Dietary Restrictions and Other Practices Characteristic of Specific Religions

Speaking in tongues, a practice often associated with Pentecostal and charismatic churches, is not particularly common among Christians overall. Eight-in-ten U.S. Christians say they seldom or never speak or pray in tongues.

Not surprisingly, speaking in tongues is more common within Pentecostal denominations in both the evangelical and historically black Protestant traditions, as well as nondenominational charismatic churches within the evangelical tradition. For example, 34% of nondenominational charismatic evangelicals report speaking in tongues at least weekly, as do 33% of members of Pentecostal churches in the historically black Protestant tradition.

About half of Buddhists surveyed (48%) say they have a shrine or temple for prayer in their home. However, the 2014 Religious Landscape Study, which was conducted in English and Spanish but not in any Asian languages, may underestimate the share of Buddhists who maintain a shrine or temple in their home. Pew Research Center’s 2012 survey of Asian Americans, which was conducted in English and seven Asian languages, found that 57% of Asian-American Buddhists say they have a shrine or temple in their home.

Certain religious groups, such as Hindus, Jews and Muslims, have traditional dietary restrictions. For example, many Hindus do not eat beef, while Islamic and Jewish laws forbid the eating of pork (among other things). Nine-in-ten U.S. Muslims say they never eat pork, and two-thirds of Hindus (67%) say they do not eat beef. By contrast, most U.S. Jews (57%) say they do eat pork.

Spiritual Experiences

Most Americans (59%) say they experience a sense of spiritual peace and well-being at least once a week, up by 7 percentage points since 2007. And 46% of Americans report feeling a deep sense of wonder about the universe on a weekly basis, also up 7 points.

Groups that exhibit the highest levels of religious observance on traditional measures of religious practice (such as worship service attendance, prayer, etc.) also are most likely to say they regularly experience a sense of spiritual peace. Fully eight-in-ten Jehovah’s Witnesses (82%) and Mormons (81%), for instance, say they regularly feel a deep sense of spiritual peace, as do three-quarters of evangelical Protestants (75%) and members of the historically black Protestant tradition (73%).

However, four-in-ten religiously unaffiliated adults also say they regularly feel a deep sense of spiritual peace and well-being. And the religiously unaffiliated are no less likely than those who identify with a religion to say they often experience a deep sense of wonder about the universe. In fact, self-described atheists and agnostics are somewhat more likely than members of most religious groups to say they often experience such a sense of wonder.

More than three-quarters of Americans (78%) say they feel a strong sense of gratitude or thankfulness at least once a week. Fully 82% of Christians say they regularly feel a deep sense of gratitude, as do 73% of adherents of non-Christian faiths and two-thirds of the religiously unaffiliated (67%).

A majority of U.S. adults (55%), including roughly six-in-ten Christians, think about the meaning and purpose of life at least once a week. Within Christianity, most members of historically black Protestant churches (72%) and Mormons (71%) often think about the meaning of life, as do majorities of evangelical Protestants (64%) and Orthodox Christians (63%). By comparison, 52% of Catholics and 51% of mainline Protestants say they regularly ponder the meaning of life. Among the religiously unaffiliated, 45% say they think about the meaning and purpose of life at least once a week.

Chapter 3: Views of Religious Institutions

Whether religiously affiliated or not, large majorities of Americans say churches and other religious organizations perform important roles in contemporary American society by strengthening community bonds and helping the poor and needy. Most also say religious institutions protect and strengthen morality in society. Even most atheists say religious institutions bring people together and help the poor.

However, many Americans – including most religious “nones” – also express reservations about churches and other religious organizations, saying they are too concerned with money and power, too focused on rules and too involved with politics. Even among those who are affiliated with a religious group, four-in-ten or more express these views about religious institutions in general.

This chapter looks at how Americans view religious institutions and their impact on society. These questions were not asked in the 2007 Religious Landscape Study, so the chapter does not include trend data.

Religious Institutions as Forces for Good

Almost nine-in-ten U.S. adults (89%) say religious institutions bring people together and strengthen community bonds. Nearly as many (87%) say they play an important role in helping the poor and needy. And three-quarters of adults say religious institutions protect and strengthen morality in society.

Christians give high marks to religious institutions for bringing people together and strengthening community bonds. Indeed, this view is expressed by roughly nine-in-ten or more members of most Christian traditions. Jehovah’s Witnesses are the exception; 57% say religious institutions help bring people together and strengthen community bonds.

Among members of non-Christian faiths, large majorities also see religious institutions as unifying forces in society; 88% of Muslims, Jews and Hindus agree with this assessment. And even most religiously unaffiliated Americans say religious institutions help strengthen community bonds, including 85% of self-described agnostics, 81% of those who describe their religion as “nothing in particular” and 75% of atheists.

Similarly, large majorities of Christians (90%), members of non-Christian faiths (82%) and religious “nones” (78%) say religious institutions play an important role in helping the poor and needy.

There are larger differences between Christians and non-Christians when it comes to views about the role of religious institutions in protecting morality in society. Fully 83% of Christians say religious institutions play an important role in protecting and strengthening morality, including 92% of Mormons and 87% of evangelical Protestants.

Far fewer members of non-Christian faiths (62%) say religious institutions help strengthen morality in society, though there is considerable variation on this question among Muslims (83%), Hindus (73%), Buddhists (65%) and Jews (63%).

A slim majority of religiously unaffiliated adults (54%) say religion helps protect morality in society, including just 31% of atheists.

Reservations about Religious Institutions

Though most Americans agree that religious institutions perform positive functions in society, about half of U.S. adults also express reservations about the conduct of religious institutions, saying they are too concerned with money and power, too focused on rules and too involved with politics.

Religiously unaffiliated people are especially critical of religious institutions. Roughly two-thirds of religious “nones” say religious institutions are too concerned with money and power (66%), focus too much on rules (68%) and are too involved with politics (67%). Within the unaffiliated, self-described atheists are especially likely to voice these opinions: Fully 83% of atheists say religious institutions are too involved with politics, 79% say they focus too much on rules and 76% say they are too concerned with money and power.

Overall, Christians are less likely to express these reservations about religious institutions. But still, four-in-ten or more U.S. Christians say religious institutions are too concerned with money and power (47%), focus too much on rules (44%) and are too involved with politics (40%). Among Catholics, about half criticize religious institutions for being too concerned with money and power (50%) and for focusing too much on rules (52%).

Jehovah’s Witnesses, meanwhile, are especially likely to express reservations regarding money and power (82%) and involvement in politics (80%). Jehovah’s Witnesses teach their members to remain politically neutral and avoid voting in elections or lobbying the government.

Criticism of religious institutions is more common among members of non-Christian faiths than it is among Christians. For example, 65% of adherents of non-Christian religions in the U.S. say religious institutions focus too much on rules, and 61% say they are too involved with politics.

Chapter 4: Social and Political Attitudes

Overall, more Americans now identify as politically liberal than did so when the Religious Landscape Study was first conducted, while fewer U.S. adults identify themselves as political moderates. Religious “nones” are more likely than those in many Christian traditions to describe themselves as politically liberal; indeed, 39% of religious “nones” now describe themselves as liberals. However, people who do have a religious affiliation also have grown slightly more likely to identify as politically liberal, from 17% in the 2007 Religious Landscape Study to 20% in 2014.

Though the public has grown slightly more liberal in terms of self-described political ideology, it became slightly less Democratic and a bit more Republican between 2007 and 2014. Evangelical Protestants, who traditionally tend to identify as Republicans, are even more strongly supportive of the GOP now than when the Religious Landscape Study was first conducted. And like the GOP more broadly, evangelicals and members of other heavily Republican religious groups (such as Mormons) are more likely to take both fiscally and socially conservative positions, such as support for smaller government and opposition to same-sex marriage. They also tend to believe abortion should be illegal in most or all cases and are skeptical about human evolution through natural selection.

Meanwhile, traditionally Democratic groups, including members of historically black Protestant churches, religious “nones” and members of some non-Christian religious traditions, continue to identify with the Democratic Party in large numbers.

This chapter describes the attitudes and values of U.S. religious groups on a variety of key social and political topics, and documents how these views have changed since the first Religious Landscape Study was conducted in 2007. On some issues, such as rising support for same-sex marriage and smaller government, there has been dramatic change in recent years. But on other topics, including abortion, the views of Americans overall have held mostly steady.

Political Party and Ideology

In the 2014 Religious Landscape Study, conducted in mid-2014, 37% of those surveyed say they identify with or lean toward the Republican Party. More than four-in-ten (44%) identify with or lean toward the Democratic Party. And nearly one-in-five respondents (18%) identify as politically independent or with a party other than the GOP or the Democratic Party (and indicate that they do not lean toward either major party).12

There are sharp differences in political party preferences across religious groups. Most evangelical Protestants (56%) and Mormons (70%) identify with or lean toward the Republican Party.

Mainline Protestants and Catholics are more divided. Among mainline Protestants, for example, 44% support the GOP and 40% favor the Democratic Party. Among Catholics, 44% identify with or lean toward the Democratic Party, while 37% favor the Republican Party.

Fully eight-in-ten members of historically black Protestant churches are Democrats or lean toward the Democratic Party, while roughly six-in-ten or more members of non-Christian faiths do the same, including 64% of Jews and 62% of Muslims. A slim majority of religious “nones” (54%) identify with or lean toward the Democratic Party, including 69% of self-identified atheists and 64% of agnostics.

Jehovah’s Witnesses, who generally eschew politics, are distinctive in that three-quarters are strictly independent, neither identifying with nor leaning toward either party.

Overall, the Democratic Party garners somewhat less support, relative to the GOP, than it did in 2007. At the time of the first Religious Landscape Study, the share of Democratic partisans and leaners exceeded the GOP share by 12 percentage points. By the time of the 2014 study, the margin had slipped to 7 points. This pro-GOP trend is seen across a variety of religious traditions but is particularly pronounced among members of several groups who were already strongly supportive of the Republican Party, including evangelical Protestants and Mormons.

When asked to describe their political views, more than a third of respondents say they are very conservative (8%) or conservative (28%), a third say they are moderate (33%) and about a quarter describe themselves as very liberal (7%) or liberal (17%). Since the 2007 Religious Landscape Study, there has been a slight decrease in the share of Americans identifying as moderate (from 36% in 2007 to 33% in 2014) and an increase in the share identifying as liberal or very liberal (from 20% in 2007 to 24% in 2014). The percentage identifying as conservative or very conservative has held relatively steady (37% in 2007, 36% in 2014).

Most evangelical Protestants (55%) and Mormons (61%) identify as conservative. By contrast, most atheists (56%) say they are politically liberal. Other religious groups are more divided across the ideological spectrum.

Voter Registration Status

Most Americans (69%) say they are absolutely certain they are registered to vote, while about one-in-five (19%) say they are not registered or do not know if they are registered. Smaller shares of the public say they are probably registered to vote but are uncertain (5%), or are unable to register because they are not U.S. citizens (7%).

Aside from Jehovah’s Witnesses, who typically abstain from voting, majorities of all other major Christian groups are absolutely certain they are registered to vote. Most Jews (79%) and Buddhists (69%) say the same.

Smaller shares of U.S. Muslims (47%) and Hindus (32%) are absolutely certain they are registered to vote, in part because these groups have many members who are not U.S. citizens.

Although a majority of religious “nones” are absolutely certain they are registered to vote, the share saying they are not registered is higher among the unaffiliated (25%) than among affiliated Americans (17%).

Role of Government

As of 2014, more Americans say they would prefer a smaller government providing fewer services (51%) to a bigger government offering more services (42%).

Support for smaller government has grown in recent years. In 2007, respondents were slightly more likely to favor a bigger government (46%) than a smaller government (43%).

Support for small government has increased by 17 percentage points among Republicans and those who lean toward the Republican Party (from 61% in 2007 to 78% in 2014), while there has been relatively little change in support for small government among Democrats (31% vs. 32%).13 Among religious groups, support for smaller government has grown particularly rapidly among two traditionally Republican groups – evangelical Protestants and Mormons. Orthodox Christians also express much more support for limited government now as compared with 2007.


Another issue that divides the public is the role of the government in helping the poor. Half of U.S. adults believe government aid does more good than harm because people can’t get out of poverty until their basic needs are met, while 44% say government aid to the poor does more harm than good by making people too dependent on government assistance.14 This question was not asked as part of the 2007 Religious Landscape Study.

Like views on size of government, the public divide on government aid also is closely tied to political party affiliation. About seven-in-ten Americans who identify as or lean Republican (69%) say government aid to the poor does more harm than good. A similar share of Democrats (70%) believe the opposite: They say such aid does more good than harm.

Religious groups that tend to favor the Republican Party express the most support for the idea that government aid to the poor does more harm than good. More than six-in-ten Mormons (64%) express this view, as do 56% of evangelical Protestants. By contrast, two-thirds of those in the historically black Protestant tradition (66%) say government aid to the poor does more good than harm, as do 65% of Jews and 58% of the religiously unaffiliated. Mainline Protestants and Catholics are closely divided on this issue.

Views on Environmental Regulations

A majority of Americans (57%) say stricter environmental laws and regulations are worth the cost, while 38% say such laws cost too many jobs and hurt the economy.

Support for environmental regulation is down modestly since 2007, when roughly six-in-ten U.S. adults (61%) and majorities across most major religious groups said stricter laws were worth the cost.

More specifically, there has been a sharp decrease in support for stricter environmental laws among Republicans and those who lean toward the GOP (13 percentage points), and a slight increase in support among Democrats (3 points) since 2007. Support for stricter environmental laws remains high among some heavily Democratic religious groups, such as atheists (79%), while it has declined considerably among Mormons (from 55% in 2007 to 42% in 2014) and evangelical Protestants (54% vs. 45%).

Homosexuality and Same-Sex Marriage

Most Americans (62%) say homosexuality should be accepted by society, while only half as many (31%) say homosexuality should be discouraged. Acceptance of homosexuality is up by 12 points nationally since 2007, and has increased significantly among nearly every major religious group during that time.

Seven-in-ten Catholics and two-thirds of mainline Protestants now say homosexuality should be accepted by society. By contrast, 36% of both evangelical Protestants and Mormons say the same, although both groups are substantially more accepting of homosexuality today than they were in 2007.

Large majorities of Jews (81%), Buddhists (88%), Hindus (71%) and religious “nones” (83%) say homosexuality should be accepted by society.

The belief that homosexuality should be accepted by society also is tied to knowing someone who is gay. Among respondents who report knowing someone who is gay or lesbian, fully two-thirds say homosexuality should be accepted by society, while roughly four-in-ten of those who do not know someone who is gay say the same. About four-in-five Americans (81%) say they know someone who is gay or lesbian, including majorities across most major religious groups.

Slightly more than half of respondents in the 2014 Religious Landscape Study (53%) said they favor allowing gay and lesbian couples to marry legally. Although the 2007 Landscape Study did not ask about same-sex marriage, other surveys have found that support for same-sex marriage has increased dramatically in recent years. And the most recent Pew Research polling on this question, conducted in July 2015, found that 54% of U.S. adults now say same-sex marriage should be legally permitted.

The 2014 Religious Landscape Study finds that most members of non-Christian faiths and religious “nones” are in favor of same-sex marriage. This includes two-thirds or more of Buddhists, Jews and Hindus as well as more than three-quarters of the unaffiliated. About nine-in-ten atheists (92%) and agnostics (91%) support same-sex marriage, as do eight-in-ten of those whose religion is “nothing in particular” and who say religion is not important to them.

Among Christians, most Catholics (57%), mainline Protestants (57%) and Orthodox Christians (54%) favor same-sex marriage. There is far less support for same-sex marriage among evangelical Protestants (28%), Mormons (26%) and Jehovah’s Witnesses (14%). There is, however, a strong generational divide in views about same-sex marriage across religious traditions, including among evangelicals; young adults in the evangelical Protestant tradition are far more supportive of same-sex marriage than are older evangelicals. These differences by generation mirror those seen among the public as a whole.

Among Americans who know someone who is gay, most (58%) say they support same-sex marriage. However, among those who do not know someone who is gay, the share saying they favor same-sex marriage drops to about three-in-ten (31%).

Views on Abortion

Slightly more than half of U.S. adults say abortion should be legal in all (20%) or most (33%) cases, while fewer say it should be illegal in all (16%) or most (27%) cases. Views on abortion laws have remained relatively stable in recent years among the general public as a whole and across many major religious groups.

Opinions on this issue continue to vary widely by religious tradition. Clear majorities of mainline Protestants (60%) and most major non-Christian groups express support for legal abortion, as do nearly three-quarters of people with no religious affiliation (73%). Far fewer evangelical Protestants (33%), Mormons (27%) and Jehovah’s Witnesses (18%) believe abortion should be legal in most or all cases. Roughly half of Catholics (48%) and members of historically black Protestant churches (52%) say abortion should be legal in all or most cases.

Women in the Workforce

Two-thirds of Americans say having more women in the workforce over the last 50 years has been a change for the better, compared with just 9% who say it has been a change for the worse. One-in-five U.S. adults say it hasn’t made much of a difference. This question was not asked as part of the 2007 Religious Landscape Study.

Large majorities of most major religious groups are in agreement that having more women in the workforce has been a change for the better. Two exceptions are Mormons and Jehovah’s Witnesses, among whom about half share this view. Still, members of these groups are considerably more likely to say that having more working women has been a positive rather than negative change.

Women are only modestly more likely than men to say having more women in the workforce has been a change for the better (69% vs. 65%).

Views on Childbearing

More than half of Americans (55%) say more people having children without getting married has been a change for the worse, while few (5%) say it has been a change for the better. Roughly a third (35%) say it has not made much difference for society. This question was not asked as part of the 2007 Religious Landscape Study.

Majorities of all major Christian traditions say the trend toward childbearing outside marriage has been a change for the worse. This view is most common among Mormons (82%), Jehovah’s Witnesses (79%) and evangelical Protestants (73%). Smaller majorities of mainline Protestants (58%) and about half of those in the historically black Protestant tradition (55%) and Catholics (53%) say this has been a negative trend.

By contrast, religious “nones” are less likely to see the increase in childbearing outside marriage as a change for the worse. Roughly half of religiously unaffiliated people (51%) say this trend does not make much difference.

While most married respondents say people having children outside of marriage is a change for the worse (63%), people who are not married are more divided on whether this is a change for the worse (48%) or has not made much difference (40%).

Immigration

Americans’ views about the growing number of immigrants in the population are mixed. In the 2014 Religious Landscape Study, about a quarter (26%) say this trend has been a change for the better, 35% say it has been a change for the worse and 30% say it has not made much difference. This question was not asked as part of the 2007 Religious Landscape Study.

There is substantial disagreement among Christian groups on this question. About half of evangelical Protestants (48%) say the growing number of immigrants has been a change for the worse, while just 17% view it as a change for the better. By contrast, only about a quarter of members of the historically black Protestant tradition (25%) and Orthodox Christians (24%) say having more immigrants in the population has been a change for the worse.

About half of U.S. Muslims (51%) and 61% of Hindus say more immigrants is a change for the better; majorities of both groups are immigrants themselves.

Among the unaffiliated, 47% of atheists say the growing immigrant population has been a change for the better, as do 40% of agnostics. Fewer say this among those who describe their religion as “nothing in particular.”

Younger adults (ages 18 to 49) are more likely than Americans ages 50 and older to say recent immigration has been a positive societal change. And Hispanics are more likely than non-Hispanic whites to say increased immigration has been a positive change. A plurality of Hispanic Catholics, for example, say the nation’s growing population of immigrants has been a change for the better (45%). Among white Catholics, by contrast, a plurality (44%) express the view that growing numbers of immigrants has been a change for the worse.

Evolution

Roughly six-in-ten respondents in the 2014 Religious Landscape Study (62%) say humans have evolved over time, while about a third (34%) say humans have always existed in their present form, similar to other recent Pew Research surveys. This question was not asked as part of the 2007 Religious Landscape Study.

Among those who believe that humans evolved, there is disagreement over whether this evolution has been due to natural processes or guided by a supreme being. A third of U.S. adults believe evolution has occurred due to natural processes, while a quarter say a supreme being guided evolution.

About two-thirds of Catholics (66%) and mainline Protestants (65%) believe humans evolved over time. By contrast, most Jehovah’s Witnesses (74%) and evangelical Protestants (57%) and about half of Mormons (52%) reject this view, saying human beings have always existed in their present form.

Atheists (95%) and agnostics (96%) in the survey nearly universally say humans evolved over time, and most believe that evolution has occurred through natural processes. Majorities of Buddhists, Hindus and Jews also hold this view.

Overall, respondents with a college degree are more likely than those with less education to say humans evolved over time due to natural selection. However, the impact of education varies across religious groups. Members of mainline and historically black Protestant churches, Catholics and religious “nones” with a college degree all are more likely than their less well-educated counterparts to say humans evolved over time. But evangelical Protestants with a college degree are no more likely than those without a college degree to say humans have evolved.

Appendix A: Methodology

The centerpiece of Pew Research Center’s 2014 Religious Landscape Study is a nationally representative telephone survey conducted June 4-Sept. 30, 2014, among a sample of 35,071 U.S. adults. Approximately 60% of the interviews were conducted with respondents reached on cellphones (n=21,160) and 40% were completed on landlines (n=13,911). A minimum of 300 interviews were conducted in every state and the District of Columbia. Interviewing was conducted in English and Spanish. The survey is estimated to cover 97% of the non-institutionalized U.S. adult population; 3% of U.S. adults are not reachable by telephone or do not speak English or Spanish well enough to participate in the survey. No adjustments have been made to the survey’s estimates of the religious composition of the U.S. population to attempt to account for the small amount of non-coverage.

Data collection was divided equally among three research firms – Abt SRBI, Princeton Survey Research Associates International (PSRAI) and Social Science Research Solutions (SSRS). Abt SRBI served as the lead research firm coordinating the data collection, providing the sampling plan and producing the survey weights. Both the landline and cellphone samples were provided by Marketing Systems Group (MSG).

The size of the national sample is unusually large for a religion survey. There are two main reasons for this. First, the large sample size makes it possible to estimate the religious composition of the U.S. with a high degree of precision. After taking into account the survey’s design effect (based on the sample design and the survey weights), the margin of error for results based on the full sample is +/- 0.6 percentage points.

Second, the large sample size makes it possible to describe the demographic characteristics of a wide variety of religious groups, including relatively small groups that cannot be analyzed using data from smaller surveys. With more than 35,000 respondents in total, the Religious Landscape Study includes interviews with roughly 350 people in religious groups that account for just 1% of the U.S. population, and with 100 or more people in religious groups that are as small as three-tenths of 1% of the overall population. For instance, the study includes interviews with 245 Jehovah’s Witnesses, a group that accounts for less than 1% of the U.S. population and is typically represented by only a few dozen respondents in smaller surveys.

Sample Design

The national survey employed a dual-frame (cellphone and landline) random-digit dialing (RDD) approach to yield a nationally representative sample that included a minimum of 300 completed interviews in every state. This was accomplished by first allocating the total expected number of interviews (~35,000) to states in proportion to their respective share of the national adult population. At this stage, 16 states (including the District of Columbia) were identified in which the proportional allocation would result in fewer than 300 interviews. These 16 states were oversampled to obtain at least 300 interviews in each of them, while the remaining 35 states were undersampled proportionately. The weighting of the data (described below) ensures that all states are represented in their proper proportion in the national weighted estimates.

The allocation of sample to the landline or cellphone RDD frame was customized for each state to reflect state-level variation in telephone usage. The amount of sample allocated to cellphone numbers ranged from a low of 35% in Rhode Island to a high of 84% in Mississippi.

The landline sample was drawn from MSG’s 1+ assignment-assisted RDD sampling frame. The cellphone sample was also drawn by MSG, using their Cell-WINS activity flags. The Cell-WINS service appends activity code information to each sampled record, flagging it as active, inactive or “unknown.” In the initial cell sample, 59% of numbers were flagged as active, 40% were flagged as inactive and 1% were flagged as unknown. The cell sample was managed such that active and “unknown” numbers were oversampled while inactive numbers were undersampled. Oversampling cellphone numbers flagged as active or “unknown” helps to control survey costs by increasing the amount of interviewer time spent dialing eligible numbers. Retaining some numbers flagged as inactive ensures that the survey’s coverage rate was not affected. The weighting of the data corrects for the undersampling of flagged-inactive numbers so that they are represented in their proper proportion in the weighted estimates.

Interviewing

Sampled telephone numbers were called as many as seven times in an effort to obtain a completed interview. Numbers flagged as “callbacks” (i.e., numbers at which a respondent had begun the interview without completing the survey) were called back an additional two times during the final four weeks of the survey period. Refusal conversion was attempted in instances of soft refusals in both the landline and cellphone frames. Calls were staggered over times of day and days of the week to maximize the chance of making contact with potential respondents. Each number received at least one daytime call.

In the landline sample, interviewers asked to speak with the youngest adult at home at the time of the call. In the cellphone sample, interviews were conducted with the person who answered the phone provided the person was age 18 or older. Respondents reached on cellphones were offered a reimbursement of $5 for their cellphone minutes used participating in the survey.

In an effort to maximize the number of interviews with adults who primarily speak Spanish, the study utilized a special protocol in which sampled telephone numbers that service areas with sizable Hispanic populations were dialed by bilingual Spanish- and English-speaking interviewers. Two flags were created in each frame (landline and cellphone) to identify cases with a relatively high probability of requiring Spanish administration. In the landline RDD sample, the first flag identified telephone exchanges with an estimated Hispanic incidence of 65% or higher. In the cell frame, the first flag identified numbers that belonged to rate centers (i.e., billing centers) with an estimated Hispanic incidence of 70% or higher. These numbers were dialed exclusively by bilingual interviewers capable of conducting the interview in either English or Spanish. There was just one exception to this rule; respondents who completed part of the interview but did not finish the survey and who spoke English were eligible to be called back subsequently by interviewers who spoke only English.

Each frame (landline and cellphone) also included a second Hispanic incidence flag. The second flag in the landline sample identified exchanges with an estimated Hispanic incidence of 60% to 64.99%. The second flag in the cell frame identified numbers associated with rate centers with an estimated Hispanic incidence of 65% to 69.99%. In the event that the research firms that conducted the interviewing had bilingual interviewing capacity over and above that needed to dial numbers associated with the first flag, bilingual interviewers were then assigned to numbers identified with the second flag.

Ultimately, 3.8% of all interviews were conducted in Spanish, including 4.6% in the cellphone sample and 2.5% in the landline frame.

Weighting

National- and State-Level Weighting

The national- and state-level results included in this report are based on weighted estimates. The weighting was conducted in two stages. The first stage in the weighting produced base weights that account for several factors, including: 1) the probability of selection of the telephone number, computed separately for each of 102 sampling strata defined by the cross-classification of sample frame (landline and cellphone) and state (including the District of Columbia); 2) the oversampling of “active” numbers in the cell frame; 3) the within-household selection of one respondent per household in the landline frame; and 4) the overlap between the cell and landline frames.

The second stage of the weighting calibrated the base-weighted data to demographic benchmarks for the population covered by the survey. This was performed via iterative proportional fitting (or “raking”). The raking procedure aligned survey respondents to population benchmarks on the following dimensions within each state:

  • Gender by age
  • Gender by education level
  • Education level by age
  • Race/ethnicity
  • Telephone service
  • Region of state (except for the District of Columbia)

Most of the demographic weighting parameters came from the Census Bureau’s 2012 American Community Survey (ACS) one-year estimates, which was the most current data source available at the time the data were weighted. The ACS parameters were calculated for adults ages 18 and older residing in households in each state, excluding those living in institutionalized group quarters. The telephone service parameter for each state was constructed from model-based estimates released by the National Center for Health Statistics (NCHS) National Health Interview Survey (NHIS) for the year 2012. Since the cellphone-only adult population has increased every year since 2012, these state-level estimates were updated using 2013 NCHS data to reflect regional trends. The region parameter was specific to each state and was computed based on the 2012 ACS five-year estimates for adults living in each county in the U.S.
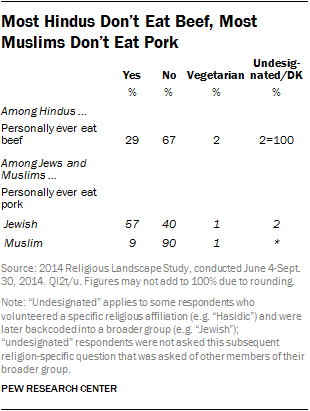
The distribution of the raked weights was examined separately for each state, and customized trimming was performed at the state level to prevent individual interviews from having too much influence on the final results and to reduce the variance of the weights at the state level. Finally, the weights for each state were scaled to correct for the oversampling of smaller states and the corresponding undersampling of larger states. This ensures that all states are represented in their proper proportion in the weighted estimates included in this report.

Metropolitan Area Weighting

In addition to providing estimates for the nation as a whole and for all 50 states and the District of Columbia, the national survey obtained interviews from 250 or more respondents in 22 of the nation’s largest Metropolitan Statistical Areas (MSAs): Atlanta, Baltimore, Boston, Chicago, Dallas, Detroit, Houston, Los Angeles, Miami, Minneapolis, New York City, Philadelphia, Phoenix, Pittsburgh, Providence, Riverside (Calif.), St. Louis, San Diego, San Francisco, Seattle, Tampa and the Washington, D.C., metro area (including the District of Columbia as well as parts of Maryland, Virginia and West Virginia).

Some MSAs span multiple states, which necessitated weighting each MSA separately. Like the national- and state-level weights, each MSA weight was calculated in two stages, beginning with the same first-stage (base) weight as in the national- and state-level weights. In the second stage, the base weight was adjusted for each MSA via raking to align survey respondents to population benchmarks on the following dimensions within each MSA:

  • Gender by age
  • Gender by education level
  • Education level by age
  • Race/ethnicity
  • Telephone service

The demographic weighting parameters came from an analysis of the Census Bureau’s 2012 ACS five-year estimates, which was the most current data source available at the time the survey data were weighted. The ACS parameters were calculated for adults ages 18 and older residing in households in each MSA, excluding those living in institutionalized group quarters. The telephone service parameter was constructed from sub-state-level estimates released by the NCHS for the year 2012. Since the cellphone-only adult population has increased every year since 2012, these sub-state-level estimates were updated using 2013 NCHS data to reflect national trends.
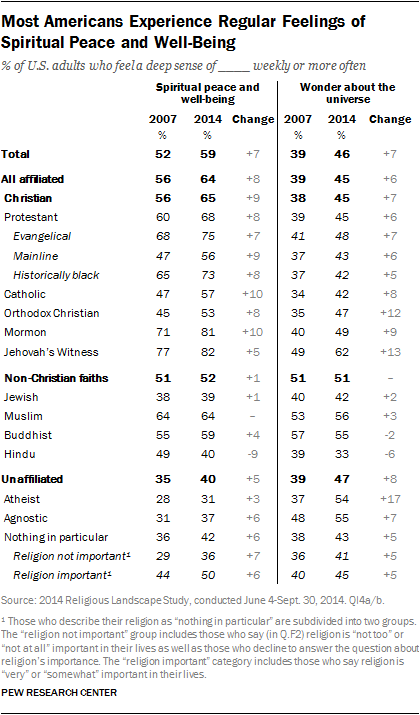
Design Effect and Margins of Error

Weighting and survey design features that depart from simple random sampling (e.g., the oversampling of less populous states) tend to result in a loss of precision in survey estimates. This loss of precision, known as the design effect, is incorporated in all margins of error, standard errors and tests of statistical significance included in this report.

Generally speaking, larger sample sizes are associated with smaller margins of sampling error, and smaller sample sizes are associated with larger margins of error. The margin of error for national estimates from this survey is +/- 0.6 percentage points. The margins of error for subgroups are larger. The accompanying tables present sample sizes and corresponding margins of error for the religious traditions discussed throughout much of this report, as well as for each state and the MSAs analyzed here and online. Sample sizes and margins of error for other groups are available upon request.

In addition to sampling error, one should bear in mind that question wording and practical difficulties in conducting surveys can introduce error or bias into the findings of opinion polls. For example, in surveys like this one that are conducted in English and Spanish, estimates for religious groups with large numbers of people who speak other languages (e.g., Buddhists, Muslims and others) may be biased toward the English- and Spanish-speaking subsets of these populations.

In addition to reporting on the characteristics of religious traditions and the religious composition of states and localities, this report and the accompanying interactive tool provide details on many other groups (e.g., men and women, immigrants and those born in the U.S., adherents of specific denominations such as the United Methodist Church and the Church of the Nazarene, etc.). Sample sizes for these groups vary widely; the survey includes interviews with 17,514 men and 17,557 women, but just 101 respondents who identify with the Church of the Nazarene. Sample sizes and margins of error for groups included in the detailed tables of the second Landscape Study report, “U.S. Public Becoming Less Religious,” can be found within the detailed tables as an additional aid.

As an aid to help readers interpret the study’s findings, the accompanying table provides approximate margins of error for groups of varying sizes. The margin of error for results based on men (n=17,514), for example, is +/- 0.9 percentage points. By contrast, the margin of error for results based on those who identify with the Church of the Nazarene (n=101) is much larger (+/- 12 percentage points). Readers should always bear in mind the approximate margin of error for the group they are examining when making comparisons with other groups or assessing the significance of trends over time.

Sample Disposition and Response Rates

The table below reports the disposition of all sampled telephone numbers dialed for the survey. Overall, the response rate (AAPOR3) was 11.1% for the landline sample and 10.2% for the cell sample.

Comparisons Between 2007 and 2014

One key goal of the 2014 Religious Landscape Study is to make comparisons between the current study and the original Landscape Study conducted in 2007. As such, the 2014 study repeated many of the questions and retained many of the methodological features of the 2007 study. There are, however, a few differences between the two studies worth noting.

First, though the two studies employed the same questions to categorize respondents into religious traditions, there are a few small religious groups that are categorized differently in 2014 than in 2007. For example:

  • Jains were counted as Hindus in 2007 but are included in the “other world religions” tradition in 2014. Jains account for less than one-tenth of 1% of 2014 respondents.
  • Those identifying with the Self Realization Fellowship were included in the “other world religions” tradition in 2007 but are counted as Hindus in 2014. They account for less than one-tenth of 1% of 2014 respondents.
  • Those identifying with the New Thought movement were included in the New Age family in the “other faiths” tradition in 2007. In 2014, they are included in the Metaphysical family in the “other Christian” tradition. They account for less than one-tenth of 1% of 2014 respondents.

These small changes have no substantive impact on the interpretation of trends between the 2007 and 2014 survey.

Second, the 2014 study was conducted in all 50 states and the District of Columbia. Though the 2007 study included follow-up surveys in Alaska and Hawaii, the national estimates from the 2007 survey are based on interviews conducted in the 48 continental states and the District of Columbia. Analysis of the data shows that this change has no substantive impact on the interpretation of trends between the 2007 and 2014 survey.

Third, the 2007 survey was conducted only on landlines, whereas the 2014 study was conducted on landlines and cellphones. In 2007, roughly 14% of U.S. adults were cellphone-only (i.e., reachable on a cellphone but not by a landline telephone), and landline-only surveys were still a viable means by which to survey a nationally representative sample of the population. By 2014, it was no longer possible to conduct nationally representative surveys using only landlines, as the cellphone-only share of the population had grown to 43%.15

Though the 2007 survey was conducted only on landlines, it also included an experimental component in which 500 cellphone-only respondents were interviewed, facilitating a comparison of the 2007 estimates both with and without cellphones included. That analysis showed that estimates of the religious composition of the U.S. were the same when cellphones were included and when they were not. As a result, this change in methodology is not expected to have a meaningful impact on the interpretation of trends between the 2007 and 2014 survey.

Furthermore, Pew Research Center political polls have been conducted on landlines and cellphones since 2008. Those polls typically include one question about religious identity, and they show a similar pattern in recent years to that observed in the Religious Landscape Study, with more Americans identifying as religious “nones” and fewer identifying as Protestants and Catholics. See Appendix C of the first Landscape Study report, “America’s Changing Religious Landscape,” for more details.

Fourth, the 2014 Religious Landscape Study was intended to document the religious composition of each of the 50 states in addition to the nation as a whole. To accomplish this, the sampling plan was designed to achieve a minimum of 300 interviews in every state, and the data for each state were weighted to demographic benchmarks derived from the U.S. Census Bureau and other government sources. The state in which respondents reside is determined by their self-reported ZIP code. By contrast, the 2007 study was not designed to yield a minimum number of interviews in every state and the 2007 data were not weighted to state-level demographic benchmarks. And in the 2007 study (which was conducted only on landlines), the state in which respondents reside was determined by their telephone number. Despite these differences, analysis of the 2007 state-level data indicates that the 2014 state-level results can safely be compared to the 2007 study.16 Information on the religious composition of each state (and major metropolitan areas) is available in the detailed tables in Appendix D of the first Landscape Study report, “America’s Changing Religious Landscape,” and online through a new interactive tool.

Fifth, in an effort to increase the number of interviews conducted with Orthodox Christians, Buddhists and Hindus, the 2007 study called back respondents from a previous study who identified with those groups. The 2014 study includes only respondents who were contacted for the first time as part of the 2014 Religious Landscape Study. As a result, trends among these groups should be interpreted with caution. Additionally, the data suggest that Asian Americans interviewed as part of this and other studies conducted in English and Spanish may include a disproportionately large number of young Asian-American adults. Those who are interested specifically in the religious beliefs and practices of Buddhists and Hindus should consult findings from Pew Research Center’s 2012 survey of Asian Americans, which was conducted in English as well as seven Asian languages and which includes interviews with more Asian-American Buddhists and Hindus than does the Landscape Study.

Appendix B: Putting Findings From the Religious Landscape Study Into Context

This appendix aims to put the findings from the Religious Landscape Study into a broader context through a comparison of its results with long-term trends from the General Social Survey (GSS), Gallup Organization surveys and results from ongoing polls conducted monthly by Pew Research Center. Generally, these sources indicate that there is a fair amount of stability in American religion, but also several signs of decline, albeit at a gradual pace. As Mark Chaves, summarizing GSS trends since the 1970s, puts it, “there is much continuity, and there is some decline, but no traditional religious belief or practice has increased in recent decades” (emphasis is the author’s).17

The ideal way to make comparisons across data sources is to examine topics that have been asked about in exactly the same way. But the Landscape Studies, GSS and Gallup surveys have not always measured the same religious beliefs and behaviors, nor have they asked about them using identical questions. Partly as a result, the three sources examined here sometimes produce varying estimates of the share of the population that espouses a particular religious belief or engages in a particular religious practice. This analysis focuses primarily on assessing similarities and differences in the direction of trends in American religion more than estimates of the prevalence of particular religious characteristics, which can vary based on differences in question wording and other factors.

These data sources also have very different sample sizes – both the 2007 and 2014 Landscape Studies include interviews with roughly 35,000 respondents, while the GSS surveys have an average sample size of about 2,000.18 Since surveys with smaller samples are less likely to show statistically significant changes than surveys with larger samples, this appendix focuses on describing the general thrust of trends rather than on assessing the statistical significance of changes.

Religious Service Attendance

The Religious Landscape Studies, Gallup polls and the GSS all produce slightly different estimates of the share of Americans who say they attend religious services regularly, owing in part to the fact that each survey employs a different question to gauge religious attendance. All three sources, however, suggest that religious attendance may be gradually ticking downward.

The Religious Landscape Studies, for instance, find that the share of Americans who say they attend religious services “once a week” or “more than once a week” declined from 39% in 2007 to 36% in 2014. Other polls by Pew Research Center show a similar trend, from 38% in 2007 to 35% in 2014. Between 2007 and 2013 (the latest year for which data are available on this question), Gallup surveys show a 4-point decline (from 41% to 37%) in the share of Americans who say they attend religious services “at least once a week” or “almost every week.” In the 2014 GSS, 29% of respondents reported attending religious services “nearly every week” or more often, down slightly from 31% in 2006 and 30% in 2008. The GSS estimates of frequent attendance had previously been as low in 2000 and 1996. During the 1970s and 1980s, GSS results consistently indicated that at least a third of adults attended religious services “nearly every week” or more often.

While the share of Americans who say they attend religious services weekly is declining, the share who say they rarely or never attend religious services is rising. The Landscape Studies and Pew Research Center monthly polls both find a 3-point jump between 2007 and 2014 in the share of adults who say they “seldom” or “never” attend religious services. Gallup surveys conducted in 2013 found 47% of adults saying they “seldom” or “never” attend religious services, up from 45% in 2007. The GSS finds that the share of Americans who say they never attend religious services or that they do so less than once a year has grown by 5 percentage points, from 29% in 2006 and 2008 to 34% in 2014.

Importance of Religion

The direction of the trend is less clear in questions that ask respondents about how important religion is in their lives. The Religious Landscape Studies find that the share of adults who say religion is “very important” in their lives declined from 56% in 2007 to 53% in 2014. In Gallup surveys that ask a similar question, however, there is no clear indication of much change in the share of Americans who say religion is “very important” to them. In 2013 Gallup surveys, 56% of Americans said religion is very important to them, which is identical to Gallup surveys conducted in 2007. The share of adults who say religion is “very important” to them has fluctuated between 54% and 61% in Gallup polls conducted over the last two decades.

The GSS asks a unique question about religious intensity. It asks those who identify with a religion (i.e., everyone except the religious “nones”) whether or not they think of themselves as a “strong” adherent of their particular faith (e.g., Catholics are asked “Would you call yourself a strong Catholic, or not a very strong Catholic?”). The 2014 GSS finds that 36% of all U.S. adults say they have a strong affiliation to their religion, comparable to the 35% who said this in 2006 and 2008. The longer-term trend in the GSS suggests that strong identification with a faith may be lower today than in the 1980s, but it has not changed much in recent years.

Belief in God

The Landscape Studies and Gallup polls include nearly identical questions about belief in God, asking respondents whether they “believe in God or a universal spirit.” And both data sources show recent declines in the share of Americans who say “yes” in response to this question. In the 2014 Religious Landscape Study, 89% of Americans say they believe in God or a universal spirit, down from 92% in 2007. In a 2014 Gallup poll, 86% of Americans said “yes” when asked if they believe in God or a universal spirit, the lowest figure since the question was first asked in 1976.

The trend in belief in God is less clear in the GSS. The GSS, which is conducted mostly via face-to-face interviews, directs respondents to look at a card and say which of six statements “comes closest” to describing their belief about God. The responses include “I don’t believe in God,” “I don’t know whether there is a God and I don’t believe there is any way to find out,” “I don’t believe in a personal God, but I do believe in a Higher Power of some kind,” “I find myself believing in God some of the time, but not at others,” “While I have doubts, I feel that I do believe in God,” and “I know God really exists and I have no doubts about it.”

The latter four categories from the GSS question can be combined to estimate the share of Americans who believe in God at all, including those who have doubts about God’s existence and those who do not believe in a personal God. When examined this way, the GSS data suggest that about nine-in-ten Americans believe in God. GSS findings on this question have fluctuated between a low of 85% in 2000 and a high of 95% in 1988.

But while overall belief in God appears not to have changed much in recent years, absolutely certain belief in God does appear to be ticking downward. In the 2014 GSS, 57% of respondents said they “know God really exists” and that they “have no doubts about it,” down from 63% in 2006 and 61% in 2008. By comparison, the Landscape Studies find that the share of Americans who are “absolutely certain” that God exists declined from 71% in 2007 to 63% in 2014.

At the other end of the spectrum, the Religious Landscape Studies and Gallup polls both find that growing shares of Americans say they do not believe in God or a universal spirit. Fewer GSS respondents reject belief in God altogether.

Beliefs About the Bible

The Religious Landscape Studies, the GSS and Gallup all find modest declines in the share of Americans who say they believe the Bible is the word of God. In the 2014 Landscape Study, 60% of adults say they believe the Bible is the word of God, down from 63% in 2007. The Landscape Study also finds a slight decline in the share of adults who say they believe the Bible should be interpreted literally, from 33% to 31%.

In the 2014 GSS, 76% of respondents said they believe the Bible is either the “actual” or the “inspired” word of God, down from 80% in 2006 and a high of 85% in 1985. The share of adults in the GSS who say the Bible is the “actual” word of God and should be taken literally has been fairly stable in recent years but shows an overall decline since a high of 40% three decades ago.

Like the Landscape Studies and the GSS, Gallup polls also show modest declines in recent years in the share of Americans who believe the Bible is the “actual” or “inspired” word of God.

As the share of adults who say they believe the Bible is the word of God has declined, the Landscape Studies find the share who say it is not the word of God has increased from 28% in 2007 to 33% in 2014. Similarly, the GSS finds a 6-point increase between 2006 and 2014 in the share of Americans who say they believe “The Bible is an ancient book of fables, legends, history, and moral precepts recorded by men.” And Gallup polls indicate that this sentiment (that the Bible is a book of fables and legends) has been increasing over the long term.

Daily Prayer

In the 2014 Religious Landscape Study, 55% of adults say they pray every day, down from 58% in 2007.

In the 2014 GSS, 57% said they pray every day, down from 59% in both 2006 and 2004. Interestingly and importantly, however, the GSS suggests that more people pray regularly today than was the case in the 1980s and 1990s.

Church Membership

The Religious Landscape Study includes a question about membership in a religious congregation, with 49% of adults indicating they, personally, are members of a local church, synagogue, mosque or other house of worship. However, this question was not asked in the 2007 Landscape Study, meaning trend information is not available.

Gallup surveys, however, have consistently asked Americans a different question about congregational membership. They ask, “Do you happen to be a member of a church or synagogue?” Gallup finds that congregational membership has been steadily declining, from 70% in 1992 and 63% as recently as 2009 to 59% today.

Self-Identity as a Religious or Spiritual Person

The GSS finds that the share of American adults who consider themselves very or moderately religious or spiritual increased between the late 1990s and the mid-2000s but has declined since then. Roughly six-in-ten U.S. adults (62%) said they were religious in 2006, while 54% said the same in 2014. And about seven-in-ten adults (69%) said they were spiritual in 2006, compared with 65% in 2014. Combined, the GSS indicates that the share of Americans who are religious or spiritual (or both) has declined by 5 percentage points in recent years, from a high of 76% in 2006 to 71% in 2014. The share of U.S. adults who describe themselves as either religious or spiritual is now on par with GSS results from the late 1990s.

The Religious Landscape Studies do not include a comparable question asking respondents whether they think of themselves as spiritual or religious.

Details on Data Sources

General Social Surveys were conducted once annually from 1972-1978; in 1980; in 1982; once annually from 1983-1991; in 1993; and once every two years beginning in 1994. Sample sizes for GSS surveys range from 1,372 to 4,510 and average about 2,000. For more information, see: Smith, Tom W., Peter Marsden, Michael Hout, and Jibum Kim. General Social Surveys, 1972-2014 [machine-readable data file] /Principal Investigator, Tom W. Smith; Co-Principal Investigator, Peter V. Marsden; Co-Principal Investigator, Michael Hout; Sponsored by National Science Foundation. – NORC ed. – Chicago: National Opinion Research Center [producer]; Storrs, CT: The Roper Center for Public Opinion Research, University of Connecticut [distributor], 2013.

Gallup data were accessed at http://www.gallup.com/poll/1690/religion.aspx.

Results from Pew Research Center monthly surveys reflect yearly aggregated data from polls conducted in 2009 (the first year in which most Pew Research Center surveys were conducted in both English and Spanish) through 2014. In total, this analysis draws on more than 50 separate polls and interviews with more than 110,000 respondents. See https://alpha.pewresearch.org/pewresearch-org/.