Pew Research Center

FOR RELEASE APRIL 2, 2015

The Future of World Religions: Population Growth Projections, 2010-2050

Why Muslims Are Rising Fastest and the Unaffiliated Are Shrinking as a Share of the World’s Population

FOR MEDIA OR OTHER INQUIRIES:

Communications Department
202.419.4372
www.pewresearch.org

RECOMMENDED CITATION

Pew Research Center, April 2015, "The Future of World Religions: Population Growth Projections, 2010-2050"

About Pew Research Center

Pew Research Center is a nonpartisan, nonadvocacy fact tank that informs the public about the issues, attitudes and trends shaping the world. It does not take policy positions. The Center conducts public opinion polling, demographic research, computational social science research and other data-driven research. It studies politics and policy; news habits and media; the internet and technology; religion; race and ethnicity; international affairs; social, demographic and economic trends; science; research methodology and data science; and immigration and migration. Pew Research Center is a subsidiary of The Pew Charitable Trusts, its primary funder.

© Pew Research Center 2026

Table of contents

  • About Pew Research Center
  • The Future of World Religions: Population Growth Projections, 2010-2050
  • Chapter 1: Main Factors Driving Population Growth
  • Chapter 2: Population Projections by Religious Group
  • Christians
  • Muslims
  • Religiously Unaffiliated
  • Hindus
  • Buddhists
  • Adherents of Folk Religions
  • Other Religions
  • Jews
  • Chapter 3: Population Projections by Region
  • Asia-Pacific
  • Europe
  • Latin America and the Caribbean
  • Middle East-North Africa
  • Sub-Saharan Africa
  • North America
  • Appendix A: Methodology

The Future of World Religions: Population Growth Projections, 2010-2050

Why Muslims Are Rising Fastest and the Unaffiliated Are Shrinking as a Share of the World’s Population

Note (June 2025): Religious composition estimates in this report are based on 2010 baseline numbers that have since been updated. Please refer to our 2025 report “How the Global Religious Landscape Changed from 2010 to 2020” for the latest 2010 and 2020 religious composition estimates. New projections past 2020 are not yet available. Refer to the 2025 report, methodology and interactive table for more detail.

The religious profile of the world is rapidly changing, driven primarily by differences in fertility rates and the size of youth populations among the world’s major religions, as well as by people switching faiths. Over the next four decades, Christians will remain the largest religious group, but Islam will grow faster than any other major religion. If current trends continue, by 2050 …

  • The number of Muslims will nearly equal the number of Christians around the world.
  • Atheists, agnostics and other people who do not affiliate with any religion – though increasing in countries such as the United States and France – will make up a declining share of the world’s total population.
  • The global Buddhist population will be about the same size it was in 2010, while the Hindu and Jewish populations will be larger than they are today.
  • In Europe, Muslims will make up 10% of the overall population.
  • India will retain a Hindu majority but also will have the largest Muslim population of any country in the world, surpassing Indonesia.
  • In the United States, Christians will decline from more than three-quarters of the population in 2010 to two-thirds in 2050, and Judaism will no longer be the largest non-Christian religion. Muslims will be more numerous in the U.S. than people who identify as Jewish on the basis of religion.
  • Four out of every 10 Christians in the world will live in sub-Saharan Africa.

These are among the global religious trends highlighted in new demographic projections by the Pew Research Center. The projections take into account the current size and geographic distribution of the world’s major religions, age differences, fertility and mortality rates, international migration and patterns in conversion.
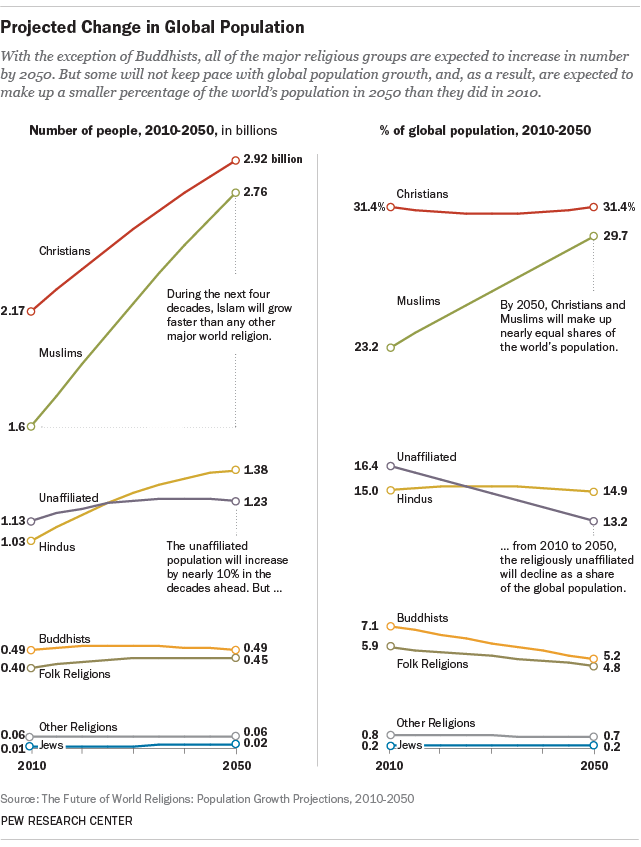
As of 2010, Christianity was by far the world’s largest religion, with an estimated 2.2 billion adherents, nearly a third (31%) of all 6.9 billion people on Earth. Islam was second, with 1.6 billion adherents, or 23% of the global population.

If current demographic trends continue, however, Islam will nearly catch up by the middle of the 21st century. Between 2010 and 2050, the world’s total population is expected to rise to 9.3 billion, a 35% increase.1 Over that same period, Muslims – a comparatively youthful population with high fertility rates – are projected to increase by 73%. The number of Christians also is projected to rise, but more slowly, at about the same rate (35%) as the global population overall.

As a result, according to the Pew Research projections, by 2050 there will be near parity between Muslims (2.8 billion, or 30% of the population) and Christians (2.9 billion, or 31%), possibly for the first time in history.2

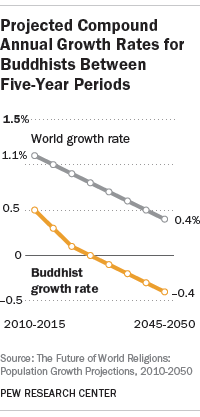
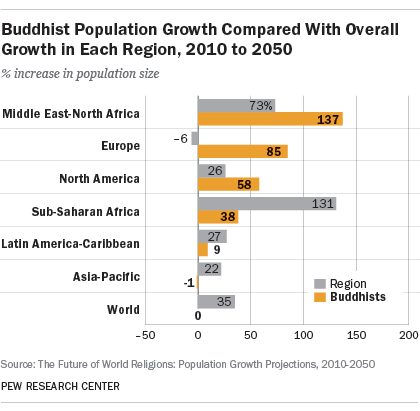
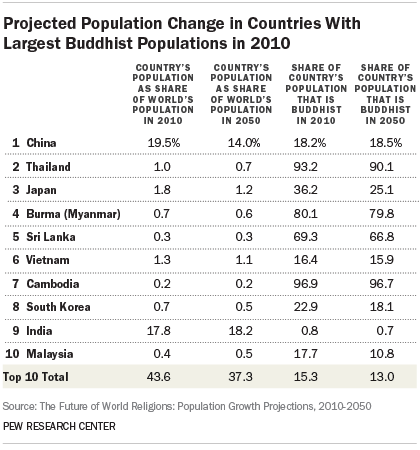
With the exception of Buddhists, all of the world’s major religious groups are poised for at least some growth in absolute numbers in the coming decades. The global Buddhist population is expected to be fairly stable because of low fertility rates and aging populations in countries such as China, Thailand and Japan.

Worldwide, the Hindu population is projected to rise by 34%, from a little over 1 billion to nearly 1.4 billion, roughly keeping pace with overall population growth. Jews, the smallest religious group for which separate projections were made, are expected to grow 16%, from a little less than 14 million in 2010 to 16.1 million worldwide in 2050.
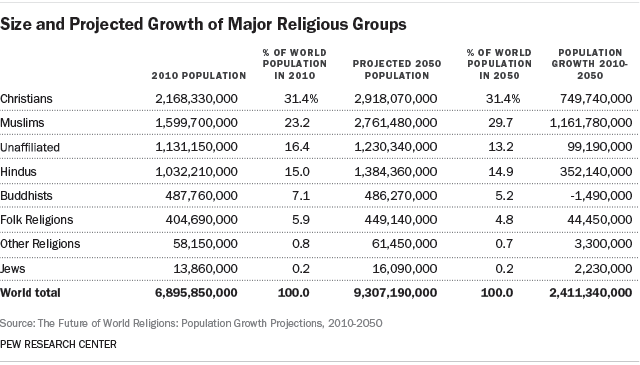
 

Adherents of various folk religions – including African traditional religions, Chinese folk religions, Native American religions and Australian aboriginal religions – are projected to increase by 11%, from 405 million to nearly 450 million.

And all other religions combined – an umbrella category that includes Baha’is, Jains, Sikhs, Taoists and many smaller faiths – are projected to increase 6%, from a total of approximately 58 million to more than 61 million over the same period.3

While growing in absolute size, however, folk religions, Judaism and “other religions” (the umbrella category considered as a whole) will not keep pace with global population growth. Each of these groups is projected to make up a smaller percentage of the world’s population in 2050 than it did in 2010.4
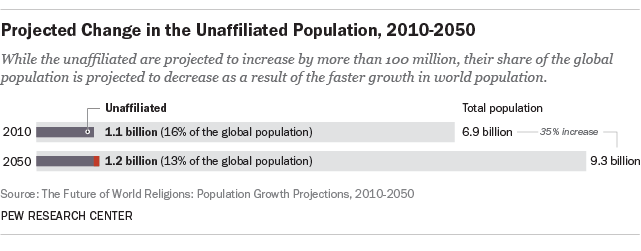
Similarly, the religiously unaffiliated population is projected to shrink as a percentage of the global population, even though it will increase in absolute number. In 2010, censuses and surveys indicate, there were about 1.1 billion atheists, agnostics and people who do not identify with any particular religion.5 By 2050, the unaffiliated population is expected to exceed 1.2 billion. But, as a share of all the people in the world, those with no religious affiliation are projected to decline from 16% in 2010 to 13% by the middle of this century.

At the same time, however, the unaffiliated are expected to continue to increase as a share of the population in much of Europe and North America. In the United States, for example, the unaffiliated are projected to grow from an estimated 16% of the total population (including children) in 2010 to 26% in 2050.

As the example of the unaffiliated shows, there will be vivid geographic differences in patterns of religious growth in the coming decades. One of the main determinants of that future growth is where each group is geographically concentrated today. Religions with many adherents in developing countries – where birth rates are high, and infant mortality rates generally have been falling – are likely to grow quickly. Much of the worldwide growth of Islam and Christianity, for example, is expected to take place in sub-Saharan Africa. Today’s religiously unaffiliated population, by contrast, is heavily concentrated in places with low fertility and aging populations, such as Europe, North America, China and Japan.
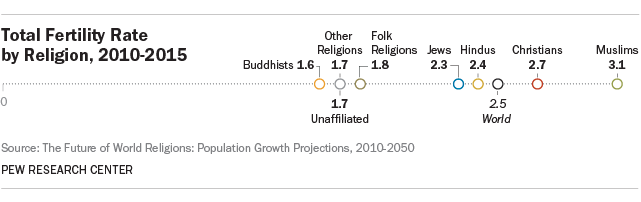
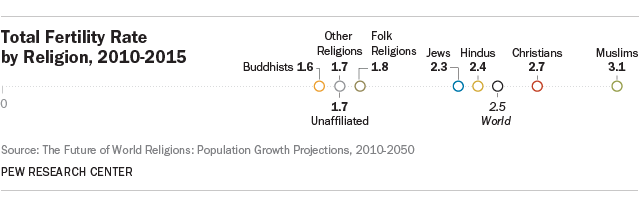
Globally, Muslims have the highest fertility rate, an average of 3.1 children per woman – well above replacement level (2.1), the minimum typically needed to maintain a stable population.6 Christians are second, at 2.7 children per woman. Hindu fertility (2.4) is similar to the global average (2.5). Worldwide, Jewish fertility (2.3 children per woman) also is above replacement level. All the other groups have fertility levels too low to sustain their populations: folk religions (1.8 children per woman), other religions (1.7), the unaffiliated (1.7) and Buddhists (1.6).

Another important determinant of growth is the current age distribution of each religious group – whether its adherents are predominantly young, with their prime childbearing years still ahead, or older and largely past their childbearing years.

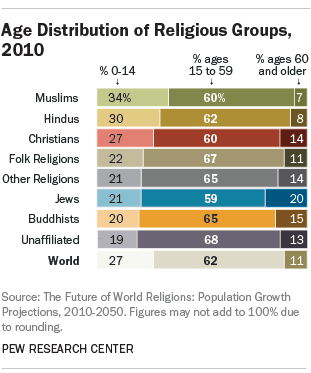
In 2010, more than a quarter of the world’s total population (27%) was under the age of 15. But an even higher percentage of Muslims (34%) and Hindus (30%) were younger than 15, while the share of Christians under 15 matched the global average (27%). These bulging youth populations are among the reasons that Muslims are projected to grow faster than the world’s overall population and that Hindus and Christians are projected to roughly keep pace with worldwide population growth.

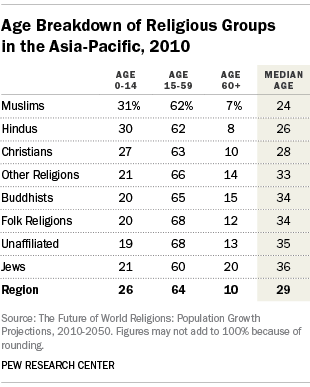
All the remaining groups have smaller-than-average youth populations, and many of them have disproportionately large numbers of adherents over the age of 59. For example, 11% of the world’s population was at least 60 years old in 2010. But fully 20% of Jews around the world are 60 or older, as are 15% of Buddhists, 14% of Christians, 14% of adherents of other religions (taken as a whole), 13% of the unaffiliated and 11% of adherents of folk religions. By contrast, just 7% of Muslims and 8% of Hindus are in this oldest age category.
In addition to fertility rates and age distributions, religious switching is likely to play a role in the growth of religious groups. But conversion patterns are complex and varied. In some countries, it is fairly common for adults to leave their childhood religion and switch to another faith. In others, changes in religious identity are rare, legally cumbersome or even illegal.

The Pew Research Center projections attempt to incorporate patterns in religious switching in 70 countries where surveys provide information on the number of people who say they no longer belong to the religious group in which they were raised. In the projection model, all directions of switching are possible, and they may be partially offsetting. In the United States, for example, surveys find that some people who were raised with no religious affiliation have switched to become Christians, while some who grew up as Christians have switched to become unaffiliated. These types of patterns are projected to continue as future generations come of age. (For more details on how and where switching was modeled, see the Methodology. For alternative growth scenarios involving either switching in additional countries or no switching at all, see Chapter 1.)

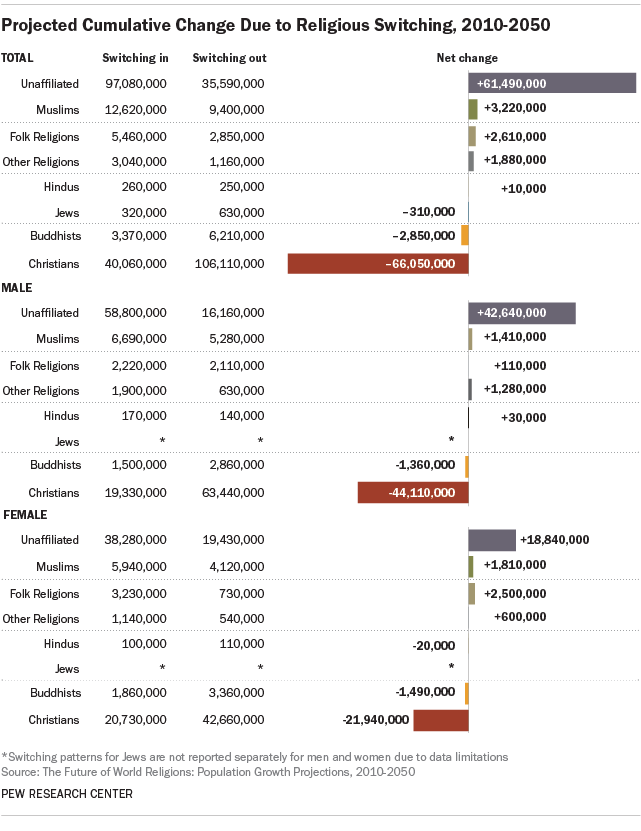
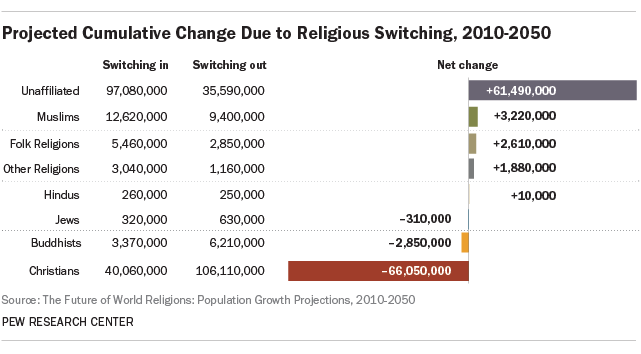
Over the coming decades, Christians are expected to experience the largest net losses from switching. Globally, about 40 million people are projected to switch into Christianity, while 106 million are projected to leave, with most joining the ranks of the religiously unaffiliated. (See chart above.)

All told, the unaffiliated are expected to add 97 million people and lose 36 million via switching, for a net gain of 61 million by 2050. Modest net gains through switching also are expected for Muslims (3 million), adherents of folk religions (3 million) and members of other religions (2 million). Jews are expected to experience a net loss of about 300,000 people due to switching, while Buddhists are expected to lose nearly 3 million.

International migration is another factor that will influence the projected size of religious groups in various regions and countries.

Forecasting future migration patterns is difficult, because migration is often linked to government policies and international events that can change quickly. For this reason, many population projections do not include migration in their models. But working with researchers at the International Institute for Applied Systems Analysis in Laxenburg, Austria, the Pew Research Center has developed an innovative way of using data on past migration patterns to estimate the religious composition of migrant flows in the decades ahead. (For details on how the projections were made, see Chapter 1.)

The impact of migration can be seen in the examples shown in the graph at the right, which compares projection scenarios with and without migration in the regions where it will have the greatest impact. In Europe, for instance, the Muslim share of the population is expected to increase from 5.9% in 2010 to 10.2% in 2050 when migration is taken into account along with other demographic factors that are driving population change, such as fertility rates and age. Without migration, the Muslim share of Europe’s population in 2050 is projected to be nearly two percentage points lower (8.4%). In North America, the Hindu share of the population is expected to nearly double in the decades ahead, from 0.7% in 2010 to 1.3% in 2050, when migration is included in the projection models. Without migration, the Hindu share of the region’s population would remain about the same (0.8%).

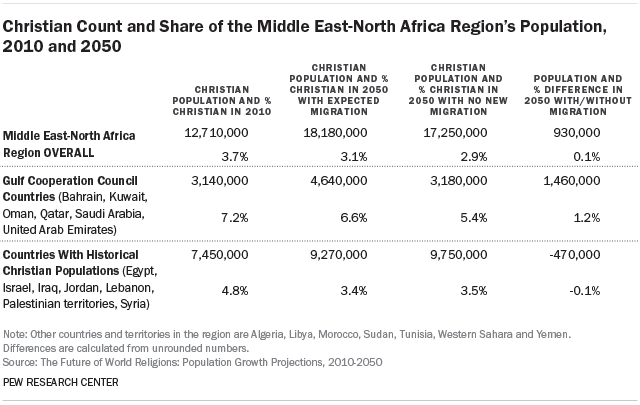
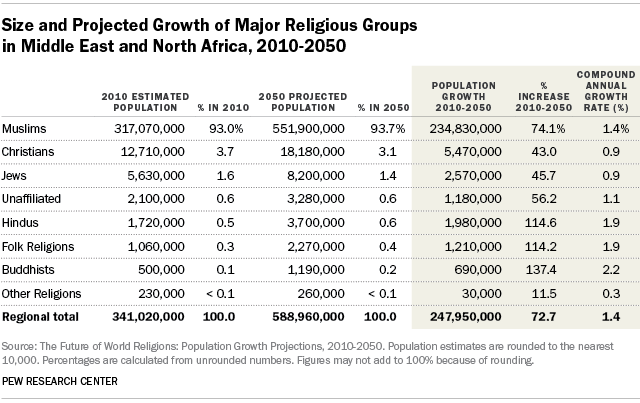
In the Middle East and North Africa, the continued migration of Christians into the six Gulf Cooperation Council (GCC) countries (Bahrain, Kuwait, Oman, Qatar, Saudi Arabia and the United Arab Emirates) is expected to offset the exodus of Christians from other countries in the region.7 If migration were not factored into the 2050 projections, the estimated Christian share of the region’s population would drop below 3%. With migration factored in, however, the estimated Christian share is expected to be just above 3% (down from nearly 4% in 2010).

Beyond the Year 2050

This report describes how the global religious landscape would change if current demographic trends continue. With each passing year, however, there is a chance that unforeseen events – war, famine, disease, technological innovation, political upheaval, etc. – will alter the size of one religious group or another. Owing to the difficulty of peering more than a few decades into the future, the projections stop at 2050.

Readers may wonder, though, what would happen to the population trajectories highlighted in this report if they were projected into the second half of this century. Given the rapid projected increase from 2010 to 2050 in the Muslim share of the world’s population, would Muslims eventually outnumber Christians? And, if so, when?

The answer depends on continuation of the trends described in Chapter 1. If the main projection model is extended beyond 2050, the Muslim share of the world’s population would equal the Christian share, at roughly 32% each, around 2070. After that, the number of Muslims would exceed the number of Christians, but both religious groups would grow, roughly in tandem, as shown in the graph above. By the year 2100, about 1% more of the world’s population would be Muslim (35%) than Christian (34%).

The projected growth of Muslims and Christians would be driven largely by the continued expansion of Africa’s population. Due to the heavy concentration of Christians and Muslims in this high-fertility region, both groups would increase as a percentage of the global population. Combined, the world’s two largest religious groups would make up more than two-thirds of the global population in 2100 (69%), up from 61% in 2050 and 55% in 2010.

It bears repeating, however, that many factors could alter these trajectories. For example, if a large share of China’s population were to switch to Christianity (as discussed in this sidebar), that shift alone could bolster Christianity’s current position as the world’s most populous religion. Or if disaffiliation were to become common in countries with large Muslim populations – as it is now in some countries with large Christian populations – that trend could slow or reverse the increase in Muslim numbers.
Regional and Country-Level Projections

In addition to making projections at the global level, this report projects religious change in 198 countries and territories with at least 100,000 people as of 2010, covering 99.9% of the world’s population. Population estimates for an additional 36 countries and territories are included in regional and global totals throughout the report. The report also divides the world into six major regions and looks at how each region’s religious composition is likely to change from 2010 to 2050, assuming that current patterns in migration and other demographic trends continue.8

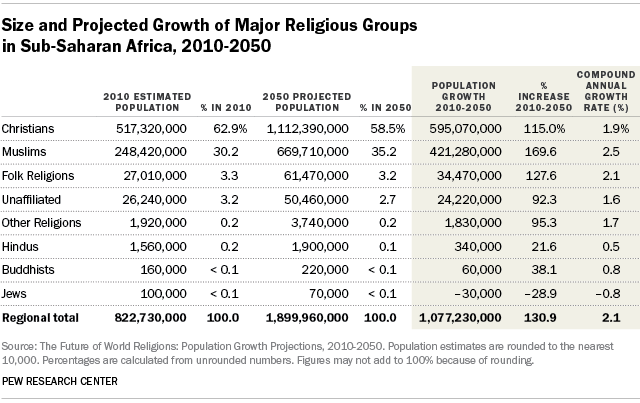
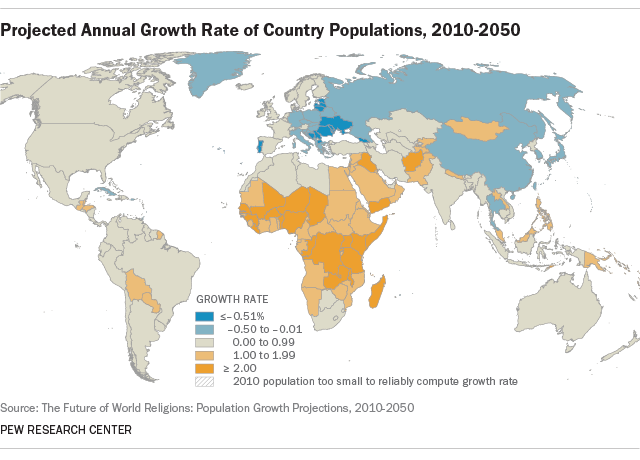
Due largely to high fertility, sub-Saharan Africa is projected to experience the fastest overall growth, rising from 12% of the world’s population in 2010 to about 20% in 2050. The Middle East-North Africa region also is expected to grow faster than the world as a whole, edging up from 5% of the global population in 2010 to 6% in 2050. Ongoing growth in both regions will fuel global increases in the Muslim population. In addition, sub-Saharan Africa’s Christian population is expected to double, from 517 million in 2010 to 1.1 billion in 2050. The share of the world’s Christians living in sub-Saharan Africa will rise from 24% in 2010 to 38% in 2050.

Meanwhile, the Asia-Pacific region is expected to have a declining share of the world’s population (53% in 2050, compared with 59% in 2010). This will be reflected in the slower growth of religions heavily concentrated in the region, including Buddhism and Chinese folk religions, as well as slower growth of Asia’s large unaffiliated population. One exception is Hindus, who are overwhelmingly concentrated in India, where the population is younger and fertility rates are higher than in China or Japan. As previously mentioned, Hindus are projected to roughly keep pace with global population growth. India’s large Muslim population also is poised for rapid growth. Although India will continue to have a Hindu majority, by 2050 it is projected to have the world’s largest Muslim population, surpassing Indonesia.

The remaining geographic regions also will contain declining shares of the world’s population: Europe is projected to go from 11% to 8%, Latin American and the Caribbean from 9% to 8%, and North America from 5% to a little less than 5%.

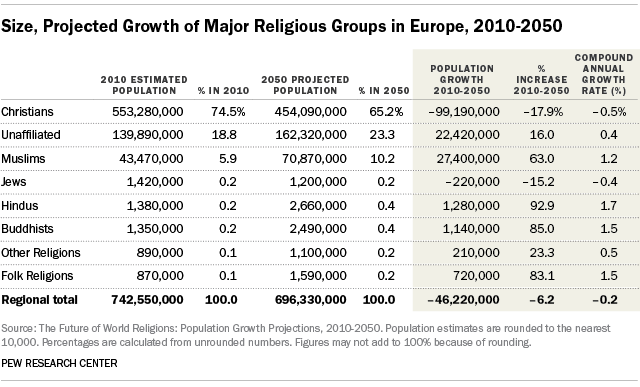
Europe is the only region where the total population is projected to decline. Europe’s Christian population is expected to shrink by about 100 million people in the coming decades, dropping from 553 million to 454 million. While Christians will remain the largest religious group in Europe, they are projected to drop from three-quarters of the population to less than two-thirds. By 2050, nearly a quarter of Europeans (23%) are expected to have no religious affiliation, and Muslims will make up about 10% of the region’s population, up from 5.9% in 2010. Over the same period, the number of Hindus in Europe is expected to roughly double, from a little under 1.4 million (0.2% of Europe’s population) to nearly 2.7 million (o.4%), mainly as a result of immigration. Buddhists appear headed for similarly rapid growth in Europe – a projected rise from 1.4 million to 2.5 million.

In North America, Muslims and followers of “other religions” are the fastest-growing religious groups. In the United States, for example, the share of the population that belongs to other religions is projected to more than double – albeit from a very small base – rising from 0.6% to 1.5%.9 Christians are projected to decline from 78% of the U.S. population in 2010 to 66% in 2050, while the unaffiliated are expected to rise from 16% to 26%. And by the middle of the 21st century, the United States is likely to have more Muslims (2.1% of the population) than people who identify with the Jewish faith (1.4%).10

In Latin America and the Caribbean, Christians will remain the largest religious group, making up 89% of the population in 2050, down slightly from 90% in 2010. Latin America’s religiously unaffiliated population is projected to grow both in absolute number and percentage terms, rising from about 45 million people (8%) in 2010 to 65 million (9%) in 2050.11

Changing Religious Majorities

Several countries are projected to have a different religious majority in 2050 than they did in 2010. The number of countries with Christian majorities is expected to decline from 159 to 151, as Christians are projected to drop below 50% of the population in Australia, Benin, Bosnia-Herzegovina, France, the Netherlands, New Zealand, the Republic of Macedonia and the United Kingdom.
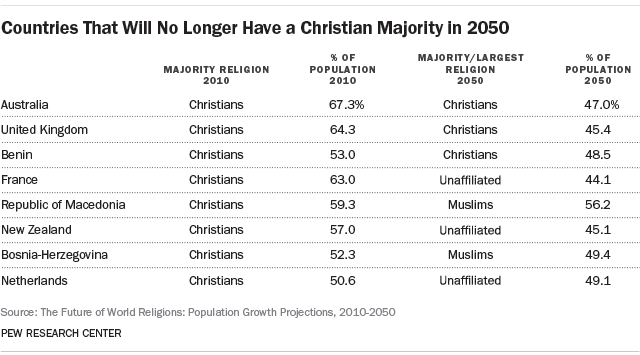
Muslims in 2050 are expected to make up more than 50% of the population in 51 countries, two more than in 2010, as both the Republic of Macedonia and Nigeria are projected to gain Muslim majorities. But Nigeria also will continue to have a very large Christian population. Indeed, Nigeria is projected to have the third-largest Christian population in the world by 2050, after the United States and Brazil.

As of 2050, the largest religious group in France, New Zealand and the Netherlands is expected to be the unaffiliated.

About These Projections

While many people have offered predictions about the future of religion, these are the first formal demographic projections using data on age, fertility, mortality, migration and religious switching for multiple religious groups around the world. Demographers at the Pew Research Center in Washington, D.C., and the International Institute for Applied Systems Analysis (IIASA) in Laxenburg, Austria, gathered the input data from more than 2,500 censuses, surveys and population registers, an effort that has taken six years and will continue.

The projections cover eight major groups: Buddhists, Christians, Hindus, Jews, Muslims, adherents of folk religions, adherents of other religions and the unaffiliated (see Appendix C: Defining the Religious Groups). Because censuses and surveys in many countries do not provide information on religious subgroups – such as Sunni and Shia Muslims or Catholic, Protestant and Orthodox Christians – the projections are for each religious group as a whole. Data on subgroups of the unaffiliated are also unavailable in many countries. As a result, separate projections are not possible for atheists or agnostics.

The projection model was developed in collaboration with researchers in the Age and Cohort Change Project at IIASA, who are world leaders in population projections methodology. The model uses an advanced version of the cohort-component method typically employed by demographers to forecast population growth. It starts with a population of baseline age groups, or cohorts, divided by sex and religion. Each cohort is projected into the future by adding likely gains (immigrants and people switching in) and by subtracting likely losses (deaths, emigrants and people switching out) year by year. The youngest cohorts, ages 0-4, are created by applying age-specific fertility rates to each female cohort in the childbearing years (ages 15-49), with children inheriting the mother’s religion. For more details, see the Methodology.12

In the process of gathering input data and developing the projection model, the Pew Research Center previously published reports on the current size and geographic distribution of major religious groups, including Muslims (2009), Christians (2011) and several other faiths (2012). An initial set of projections for one religious group, Muslims, was published in 2011, although it did not attempt to take religious switching into account.

Some social theorists have suggested that as countries develop economically, more of their inhabitants will move away from religious affiliation. While that has been the general experience in some parts of the world, notably Europe, it is not yet clear whether it is a universal pattern.13 In any case, the projections in this report are not based on theories about economic development leading to secularization.

Rather, the projections extend the recently observed patterns of religious switching in all countries for which sufficient data are available (70 countries in all). In addition, the projections reflect the United Nations’ expectation that in countries with high fertility rates, those rates gradually will decline in coming decades, alongside rising female educational attainment. And the projections assume that people gradually are living longer in most countries. These and other key input data and assumptions are explained in detail in Chapter 1 and the Methodology (Appendix A).

Since religious change has never previously been projected on this scale, some cautionary words are in order. Population projections are estimates built on current population data and assumptions about demographic trends, such as declining birth rates and rising life expectancies in particular countries. The projections are what will occur if the current data are accurate and current trends continue. But many events – scientific discoveries, armed conflicts, social movements, political upheavals, natural disasters and changing economic conditions, to name just a few – can shift demographic trends in unforeseen ways. That is why the projections are limited to a 40-year time frame, and subsequent chapters of this report try to give a sense of how much difference it could make if key assumptions were different.

For example, China’s 1.3 billion people (as of 2010) loom very large in global trends. At present, about 5% of China’s population is estimated to be Christian, and more than 50% is religiously unaffiliated. Because reliable figures on religious switching in China are not available, the projections do not contain any forecast for conversions in the world’s most populous country. But if Christianity expands in China in the decades to come – as some experts predict – then by 2050, the global numbers of Christians may be higher than projected, and the decline in the percentage of the world’s population that is religiously unaffiliated may be even sharper. (For more details on the possible impact of religious switching in China, see Chapter 1.)

Finally, readers should bear in mind that within every major religious group, there is a spectrum of belief and practice. The projections are based on the number of people who self-identify with each religious group, regardless of their level of observance. What it means to be Christian, Muslim, Hindu, Buddhist, Jewish or a member of any other faith may vary from person to person, country to country, and decade to decade.

Acknowledgements

These population projections were produced by the Pew Research Center as part of the Pew-Templeton Global Religious Futures project, which analyzes religious change and its impact on societies around the world. Funding for the Global Religious Futures project comes from The Pew Charitable Trusts and the John Templeton Foundation.

Many staff members in the Pew Research Center’s Religion & Public Life project contributed to this effort. Conrad Hackett was the lead researcher and primary author of this report. Alan Cooperman served as lead editor. Anne Shi and Juan Carlos Esparza Ochoa made major contributions to data collection, storage and analysis. Bill Webster created the graphics and Stacy Rosenberg and Ben Wormald oversaw development of the interactive data presentations and the Global Religious Futures website. Sandra Stencel, Greg Smith, Michael Lipka and Aleksandra Sandstrom provided editorial assistance. The report was number-checked by Shi, Esparza Ochoa, Claire Gecewicz and Angelina Theodorou.

Several researchers in the Age and Cohort Change project of the International Institute for Applied Systems Analysis collaborated on the projections, providing invaluable expertise on advanced (“multistate”) population modeling and standardization of input data. Marcin Stonawski wrote the cutting-edge software used for these projections and led the collection and analysis of European data. Michaela Potančoková standardized the fertility data. Vegard Skirbekk coordinated IIASA’s research contributions. Additionally, Guy Abel at the Vienna Institute of Demography helped construct the country-level migration flow data used in the projections.

Over the past six years, a number of former Pew Research Center staff members also played critical roles in producing the population projections. Phillip Connor prepared the migration input data, wrote descriptions of migration results and methods, and helped write the chapters on each religious group and geographic region. Noble Kuriakose was involved in nearly all stages of the project and helped draft the chapter on demographic factors and the Methodology. Former intern Joseph Naylor helped design maps, and David McClendon, another former intern, helped research global patterns of religious switching. The original concept for this study was developed by Luis Lugo, former director of the Pew Research Center’s Religion & Public Life project, with assistance from former senior researcher Brian J. Grim and visiting senior research fellow Mehtab Karim.

Others at the Pew Research Center who provided editorial or research guidance include Michael Dimock, Claudia Deane, Scott Keeter, Jeffrey S. Passel and D’Vera Cohn. Communications support was provided by Katherine Ritchey and Russ Oates.

We also received very helpful advice and feedback on portions of this report from Nicholas Eberstadt, Henry Wendt Scholar in Political Economy, American Enterprise Institute; Roger Finke, Director of the Association of Religion Data Archives and Distinguished Professor of Sociology and Religious Studies, The Pennsylvania State University; Carl Haub, Senior Demographer, Population Reference Bureau; Todd Johnson, Associate Professor of Global Christianity and Director of the Center for the Study of Global Christianity, Gordon Conwell Theological Seminary; Ariela Keysar, Associate Research Professor and Associate Director of the Institute for the Study of Secularism in Society and Culture, Trinity College; Chaeyoon Lim, Associate Professor of Sociology, University of Wisconsin-Madison; Arland Thornton, Research Professor in the Population Studies Center, University of Michigan; Jenny Trinitapoli, Assistant Professor of Sociology, Demography and Religious Studies, The Pennsylvania State University; David Voas, Professor of Population Studies and Acting Director of the Institute for Social and Economic Research, University of Essex; Robert Wuthnow, Andlinger Professor of Sociology and Director of the Center for the Study of Religion, Princeton University; and Fenggang Yang, Professor of Sociology and Director of the Center on Religion and Chinese Society, Purdue University.

While the data collection and projection methodology were guided by our consultants and advisers, the Pew Research Center is solely responsible for the interpretation and reporting of the data.

Roadmap to the Report

The remainder of this report details the projections from multiple angles. The first chapter looks at the demographic factors that shape the projections, including sections on fertility rates, life expectancy, age structure, religious switching and migration. The next chapter details projections by religious group, with separate sections on Christians, Muslims, the religiously unaffiliated, Hindus, Buddhists, adherents of folk or traditional religions, members of “other religions” (consolidated into a single group) and Jews. A final chapter takes a region-by-region look at the projections, including separate sections on Asia and the Pacific, Europe, Latin America and the Caribbean, the Middle East and North Africa, North America and sub-Saharan Africa.

Chapter 1: Main Factors Driving Population Growth

When demographers attempt to forecast changes in the size of a population, they typically focus on four main factors: fertility rates, mortality rates (life expectancy), the initial age profile of the population (whether it is relatively old or relatively young to begin with) and migration. In the case of religious groups, a fifth factor is switching – how many people choose to enter and leave each group, including how many become unaffiliated with any religion.

This chapter presents an overview of each of these five main drivers of population change. It highlights important trends, discusses key assumptions about the future and acknowledges weak spots in the demographic data currently available on some countries and religious groups.

In some cases, this chapter also shows how different the projections would be if particular factors, such as migration, were not taken into account. These hypothetical scenarios are intended to give readers a sense of how much impact various factors have on the projections.

Fertility

Total Fertility Worldwide, 1950-2050

Over the last half century, the global fertility rate has fallen sharply.14 In the 1950 to 1955 period, the average woman was expected to have about five children over the course of her lifetime. By 2010-2015, the global average was about 2.5 children per woman.15 According to the United Nations Population Division, worldwide fertility rates are expected to continue to drop in the decades to come, gradually moving toward 2.1 children per woman, which is traditionally viewed as the “replacement level” needed to maintain a stable population in countries with low mortality rates among the young.16

As a result of declining fertility rates, global population growth is slowing. Over the four decades from 1970 to 2010, the number of people on Earth grew nearly 90%. From 2010 to 2050, the world’s population is expected to rise 35%, from roughly 7 billion to more than 9 billion.

Among the world’s major religious groups, Muslims have the highest Total Fertility Rate as of 2010-2015, a global average of 3.1 children per woman. This is one of the main reasons why the Muslim population is expected to grow not only in absolute numbers but also in relative terms – as a percentage of all the people in the world – in the decades to come.

Christians (2.7 children per woman) are the only other major religious group whose Total Fertility Rate, on a worldwide basis, exceeds the average for all women (2.5), during the present five-year period (2010-2015).

Total Fertility Rate by Religion, 2010-2015

Globally, fertility among Hindus (2.4 children per woman) and Jews (2.3) is above the replacement level (2.1 children). Fertility rates among all the other groups – followers of folk religions (1.8), other religions as a whole (1.7), the religiously unaffiliated (1.7) and Buddhists (1.6) – are below the replacement level, meaning the groups are not bearing enough children to maintain their current populations, all else remaining equal.

One of the assumptions behind the U.N.’s global population forecasts, as well as the Pew Research projections, is that over time fertility rates generally converge toward the replacement level.17 If they start above the replacement level, they tend to decline. If they start below the replacement level, they tend to rise – although they may change slowly and may not actually reach the replacement level in the coming decades.

Thus, the religious groups with fertility rates above replacement level in 2010 – Muslims, Christians, Hindus and Jews – are expected to experience a decline in their fertility rates by 2050. Fertility rates for Muslims and Hindus are projected to decline most sharply – more than 20% – from 3.1 to 2.3 children per Muslim woman and from 2.4 to 1.8 children per Hindu woman. Among Christians, the fertility rate is projected to decline from 2.7 children to 2.3. The worldwide fertility rate among Jews also is expected to drop, albeit only slightly, from 2.3 in 2010 to 2.1 in 2050.

Total Fertility Rate by Religion, Projected From 2010-2050

At the same time, fertility rates among the four religious groups that are below 2.1 children per woman as of 2010 – followers of folk religions, other religions, Buddhists and the unaffiliated – are expected to rise somewhat over the next four decades, moving closer to the replacement level.18

Country-Level Differences

Since some major religious groups are concentrated in a small number of countries, fertility patterns in a few countries can have a large influence on a group’s global fertility rate. For example, Hindus are expected to experience a decline in their Total Fertility Rate over the next four decades in part because India’s overall fertility rate has been dropping – from 5.9 children per woman in 1950 to 2.5 in 2010 – and is expected to fall to 1.9 by 2050. (Roughly 94% of the world’s Hindus live in India.)

Similarly, since roughly eight-in-ten of the world’s Jews live in either the United States or Israel, Jewish fertility rates are heavily influenced by patterns in those two countries. While Israel’s overall fertility rate is expected to decrease – from 2.9 in 2010 to 2.2 in 2050 – U.S. fertility rates are expected to stay relatively stable (around 2.1) over the same period. The combined impact is a slight decrease in Jewish fertility, globally.

Total Fertility Rates of All Religions, by Country

China is home to at least half of all Buddhists, adherents of folk religions and religiously unaffiliated people in the world. Consequently, China’s fertility patterns have a substantial impact on expected fertility rates for these groups. The United Nations Population Division anticipates that China’s Total Fertility Rate will decrease from 1.6 children per woman in 2010 to 1.5 in 2020, and then begin rising, reaching 1.8 by 2050. Similarly, Buddhists, adherents of folk religions and religiously unaffiliated people are expected to experience a similar initial decline or plateau in their fertility rates, followed by a subsequent increase, as shown in this chart above.

Future fertility rates for each country in this report are based on forecasts published by the United Nations Population Division.19 While following the U.N.’s overall projections at the country level, however, researchers at the Pew Research Center and the International Institute for Applied Systems Analysis analyzed more than 200 censuses and surveys to calculate fertility rates specific to major religious groups within 135 countries and territories, which constitute 93% of the world’s 2010 population.20 An additional 3% of the world’s population live in 29 countries in which the overwhelming majority (over 95%) of people within the country belong to just one major religious group. In the remaining countries and territories, which include 4% of the world’s population, reliable data on fertility rates for religious groups were not available.21 In both of these latter categories, each religious group was assigned the country’s overall fertility rate.

Projections of future fertility rates within each country assume that differences in fertility levels between religious groups will slowly disappear (reaching convergence after 100 years – i.e., in the year 2110) as differences in their levels of education and access to contraceptives gradually attenuate.

Regional Differences in Fertility

Fertility patterns may vary between countries and larger geographic regions for a host of reasons, including cultural norms, levels of economic development, education systems and government policies that encourage or discourage family planning. Fertility rates also may be influenced by infant mortality rates, women’s participation in the labor market, income levels and social status, among other factors.

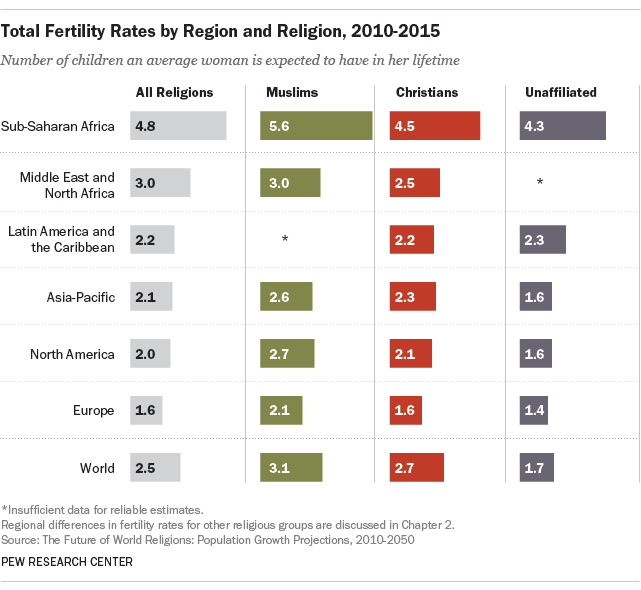
Of the six geographic regions analyzed in this report, only two have a Total Fertility Rate that is higher than the global average of 2.5 children per woman: sub-Saharan Africa (4.8) and the Middle East and North Africa (3.0). The Latin America-Caribbean region has the third-highest fertility rate (2.2), followed by the Asia-Pacific region (2.1) and North America (2.0). Europe is the only region with a fertility rate that is well below replacement level (1.6).

Total Fertility Rates by Region and Religion, 2010-2015

Sub-Saharan Africa and the Middle East-North Africa region, the two areas where fertility rates exceed the global average in the current period (2010-2015), are expected to have the highest rates of population growth in the coming decades. These are the only regions where population growth is expected to outpace global population growth from 2010 to 2050.

Within a single religious group, fertility rates can vary enormously depending on where people live. For example, Muslims in sub-Saharan Africa have a fertility rate of 5.6 children per woman, on average, while Muslims in Europe have an average of 2.1 children per woman. Similarly, religiously unaffiliated people in sub-Saharan Africa have more than four children per woman, on average, while the fertility rate among Europe’s unaffiliated population – 1.4 children per woman – is well below replacement level.

In most regions where reliable fertility data are available for religious groups, Muslims have more children per woman than the regional average. Muslims in sub-Saharan Africa have the highest Total Fertility Rate (5.6) of any major religious group in any large region. Across the Asia-Pacific region, North America and Europe, fertility rates among Muslims also are higher than among Christians and the unaffiliated. In the Middle East and North Africa, Muslims make up more than 90% of the population and are largely responsible for the region’s relatively high fertility rate (3.0).22

Because some religious groups are heavily concentrated in a few regions and are rare in other places, separate fertility rates cannot be reliably calculated for all groups in all regions. Reliable data on fertility levels are unavailable, for example, among the relatively small number of Jews in sub-Saharan Africa, Muslims in Latin America and the Caribbean and religiously unaffiliated people in the Middle East and North Africa.

In the two regions where overall population growth is expected to be fastest in the coming decades – sub-Saharan Africa and the Middle East-North Africa region – Christian fertility rates are lower than the regional averages (4.5 children per woman among Christians compared with 4.8 overall in sub-Saharan Africa, and 2.5 among Christians compared with 3.0 overall in the Middle East and North Africa). On the other hand, in the four regions where overall population growth is expected to be slower, Christian fertility rates equal or exceed the regional averages. In North America, for example, Christians have a higher fertility rate (2.1) than the regional population as a whole (2.0).

In almost every region where data are available, the unaffiliated have a fertility rate that is lower than the regional average. In sub-Saharan Africa, the Asia-Pacific region, North America and Europe, fertility among religiously unaffiliated people is lower than the regional averages and lower than the rates among Christians and Muslims. (See chart above.) The one exception is Latin America and the Caribbean, where the unaffiliated have slightly higher fertility (2.3 children per woman) than the regional average (2.2).

Hypothetical Scenarios: Seeing How Much Difference Fertility Makes

As previously noted, the projections in this report take into account differences in fertility rates among major religious groups within 135 countries and territories. Over time, these differences can be highly consequential. For example, Nigeria is estimated at present to have roughly equal numbers of Christians and Muslims, but Nigerian Muslims have a significantly higher Total Fertility Rate (6.5 children per woman) than Nigerian Christians (4.5). As a result, Muslims are expected to make up 59% of Nigeria’s population by 2050, while the Christian share is projected to drop to 39%.

One way to see the impact of fertility differences on population projections is to apply an alternative set of assumptions, such as assigning all religious groups within each country the same rate.

In Nigeria, for example, this hypothetical scenario would mean that both Christians and Muslims would be assigned – for the sake of illustration – the country’s average fertility rate (5.4 children per woman). If this were the case, in this alternate projection model, Nigeria’s total population in 2050 would be larger than it is today (this is also true in the main projection model), but the country’s religious composition would not change much over the coming decades, ending with nearly equal shares of Christians (48%) and Muslims (50%) in 2050.23 Comparing the results of the two scenarios, it is clear that Muslims’ higher fertility rates are gradually reshaping the country’s religious composition.

By contrast, at the global level, the alternative projection scenario would yield little change in the size of major religions. If one were to artificially assume that within each country, all religious groups shared the same fertility rate, Muslims would still be the fastest-growing major religious group worldwide, and the religious composition of the world in 2050 would look very similar to how it appears in the main projection scenario. There would be only a slight uptick in the Christian share of the world’s population (32% instead of 31%) and a corresponding decrease in the Muslim share (29% instead of 30%).

The outcomes of the two projection scenarios are similar because the future growth of religious groups is driven largely by differences in the geographic regions and individual countries in which the groups are concentrated. Since people’s fertility choices have much to do with their social and economic environments, differences in fertility between countries are often much greater than differences in fertility among religious groups within a single country. For example, as noted above, the Christian fertility rate in Nigeria is 4.5 children per woman, while the Muslim fertility rate in Nigeria is 6.5. In Australia, the fertility rates for Christians and Muslims are 2.0 and 3.0, respectively. In both places, the fertility rate among Muslims is higher than among Christians. But the differences inside each country are smaller than the differences between the two countries, with the average woman in Nigeria bearing about 3.5 more children than her counterpart in Australia.

Life Expectancy

Average Life Expectancy at Birth, 1950-2050

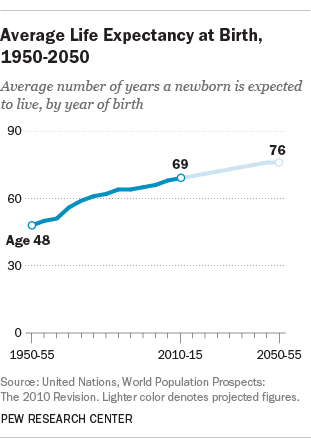
Life expectancy at birth – an estimate of the expected life span of an average newborn child – has been rising around the world. According to the United Nations, global life expectancy at birth increased from 48 years in the 1950 to 1955 period to 69 years in 2010-2015, and it is expected to continue to rise over the next four decades.24

People in many (though not all) countries are living longer due to increased access to healthcare, improvements in diet and hygiene, effective responses to infectious disease, and many other factors.

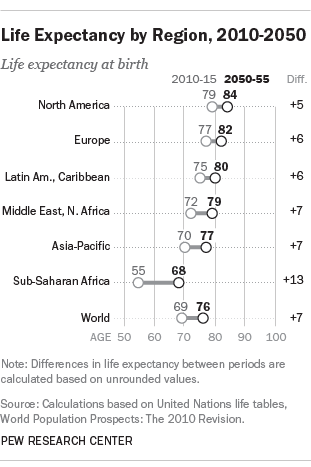
These developments in healthcare and living conditions, however, have not occurred uniformly around the world. As a result, life expectancy varies across the six regions in this study. At present, North America has the highest average life expectancy (79 years), followed closely by Europe (77) and Latin America and the Caribbean (75). Average life expectancies in the Middle East and North Africa (72) and the Asia-Pacific region (70) are slightly above the global average (69). Sub-Saharan Africa is the only region where average life expectancy (55 years) is below the global average.

By 2050, life expectancy at birth is projected to average 76 years around the world, an increase of about seven years from the current five-year period (2010-2015). All six geographic regions are expected to see a rise in their populations’ life expectancy over the coming decades. But regions and individual countries that have relatively high life expectancies in 2010-2015 are expected to make only modest gains compared with regions and individual countries where life expectancy, at present, is much lower. For example, North America is expected to see a five-year gain in life expectancy by 2050 – from 79 to 84 years. Sub-Saharan Africa, meanwhile, is projected to experience an increase in average life expectancy of 13 years, from 55 to 68 years.

Life Expectancy by Region, 2010-2050

Life expectancy is a significant factor in estimating the size of the world’s populations over time. Groups with higher life expectancies will, on average, live longer and (all else remaining equal) have larger populations. A higher share of young people who are alive today in Europe and North America are likely to be alive in 2050 compared with those residing in sub-Saharan Africa and the Asia-Pacific region.

At the same time, the greater-than-average increase in life expectancy that is projected in sub-Saharan Africa is one of the reasons its population is expanding so rapidly and boosting the global size of the region’s two biggest religious groups, Muslims and Christians.

Worldwide, little information is available on differences in life expectancy among religious groups within individual countries. In the absence of better data, the projections in this report assume that people in all religious groups have the average life expectancy of the country in which they live. For example, both Christians and Muslims in Nigeria are assigned the country’s average life expectancy for 2010-2015 (53 years), while both Christians and Muslims in the United Kingdom are assigned the U.K.’s average life expectancy for 2010-2015, which is 80 years.

Nevertheless, differences in life expectancy play an important role in the population growth projections. This is because the world’s major religious groups are concentrated in different countries, and some countries have much higher life expectancies than others.

Life Expectancy at Birth by Religious Group, 2010-2055

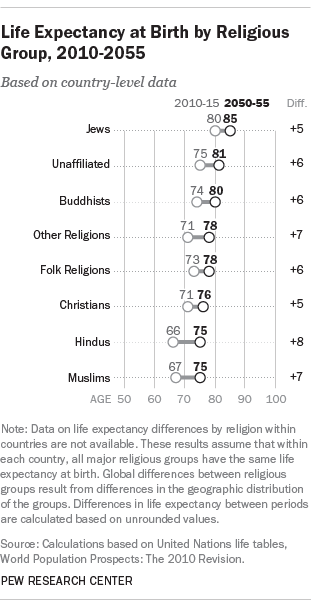
For example, because of the countries in which Jews are concentrated, the global life expectancy at birth for Jews in the present five-year period (2010-2015) is estimated to be 80 years, the highest of any of the religious groups in this report. Other groups that are concentrated in countries where life expectancy at birth currently exceeds the global average (69 years) are the religiously unaffiliated (75 years), Buddhists (74 years), members of folk religions (73 years), followers of other religions (71 years) and Christians (71 years). By contrast, both Muslims (67 years) and Hindus (66 years) are concentrated in countries with relatively low life expectancy at birth.

In the 2050-2055 period, Jews still are projected to have the highest life expectancy of all the major religious groups, a global average of 85 years, five years longer than at present. But the greatest gains in longevity over the next four decades are expected among Hindus, whose global average life expectancy is projected to rise from 66 years in 2010-2015 to 75 years in 2050-2055.

Age Structure

Median Age of World Population, 1950-2050

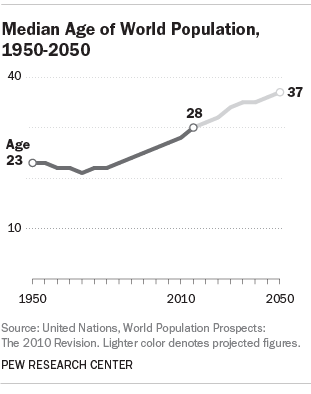
In the decades ahead, the world’s population will increase as people live longer. From 1950 until about 1980, the median age of the world’s population remained in the low 20s. By 2010, however, the median age of the population was 28 years. And by 2050, the global median age is expected to be 37, as declining fertility rates lead to relative stability in the number of young children and as the elderly population soars. The United Nations estimates that the number of people ages 100 and older will rise from about 150,000 in the year 2000 to more than 3 million in 2050.

Age Breakdown of World Population, 1950-2050

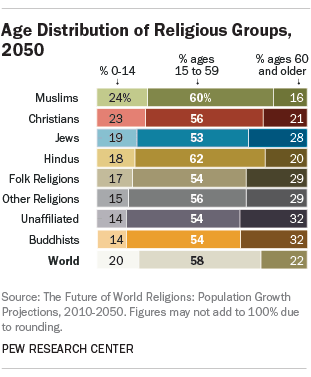
A simple way to look at the age structure of the world’s population is to divide everyone into three age groups – children younger than 15, teens and adults between ages 15 and 59 and adults ages 60 and older. As of 2010, the largest group was the middle category (62%), and there were many more children (27%) than older adults (11%). But as the global population ages, this distribution will shift, particularly among the youngest and oldest cohorts. By 2050, according to U.N. projections, the share of people ages 60 and older (22%) will exceed the share under age 15 (20%).The youthfulness of a population is an important factor in future growth. All else being equal, a population that begins with a relatively large percentage of people who are in – or soon will enter – their prime childbearing years will grow faster than a population that begins with many people who are beyond their prime reproductive years. Moreover, growth propelled by a youthful population tends to carry into the next generation, as the younger cohort’s children reach maturity and begin to have babies of their own, creating a kind of demographic momentum.

Age Distribution of Religious Groups, 2010

Among the world’s major religious groups, Muslims had the highest concentration of children as of 2010 (34% of Muslims worldwide were under the age of 15), while Jews had the highest concentration of older adults (20% of Jews worldwide were 60 or older in 2010).

Age Distribution of Religious Groups, 2050

Globally, fewer than one-in-five religiously unaffiliated people (19%) were under the age of 15, the smallest share of children in any of the major religious groups in 2010. This reflects the geographic concentration of the unaffiliated in countries such as China and Japan, which have relatively old populations with low fertility rates.

For similar reasons, Buddhists also are an older population, with just 20% under age 15. By contrast, more than a quarter of Christians worldwide and three-in-ten Hindus were in the youngest age group as of 2010. This reflects the high fertility rates in recent decades among Christians in sub-Saharan Africa and Hindus in India.

For the purposes of projecting future growth, the number of women in their early reproductive years also is a key factor. As of 2010, 13% of the world’s population consisted of females between the ages of 15 and 29. Muslims were the only major religious group with a higher share of women in this category (14%) than the global average, yet another reason the Muslim population is poised for rapid growth in the coming decades. The religiously unaffiliated (11%) and Jews (10%) had the lowest shares of women ages 15-29 in their populations, as of 2010.

Religious Switching

In many countries, it is fairly common for adults to switch from identifying with the religion in which they grew up to identifying with another religion or with no religion.25 But only in recent decades have cross-national surveys begun to measure individual changes in religious identity.26 The broadest analysis of religious switching published in recent years examined just 40 countries, primarily in Europe, using data collected between 1991 and 2001.27

The projections in this report go further, showing what the future religious landscape may look like if switching continues at the same rates recently observed in 70 countries, which are spread throughout the world’s major regions.28 Data on these switching patterns come from surveys carried out between 2008 and 2013 by the Pew Research Center and other organizations, including studies carried out under the auspices of the International Social Survey Program. This collection of data provides the most comprehensive picture available to date of global patterns of switching among major religious groups, including from having been raised in a religion to being religiously unaffiliated as an adult.29

Levels of switching are different for men and women. But at the global level, net movement due to the religious switching of men and women follows similar patterns. The chart below shows the projected total amount of movement into and out of major religious groups between 2010 and 2050 for countries with data on switching.

The largest net movement is expected to be out of Christianity (66 million people), including the net departure of twice as many men (44 million) as women (22 million). Similarly, net gains among the unaffiliated (61 million) are projected to be more than twice as large for men (43 million) as for women (19 million). Muslims and followers of folk religions and other religions are expected to experience modest gains due to religious switching. Jews and Buddhists are expected to experience modest net losses through religious switching.

Projected Cumulative Change Due to Religious Switching, 2010-2050

Regional Patterns

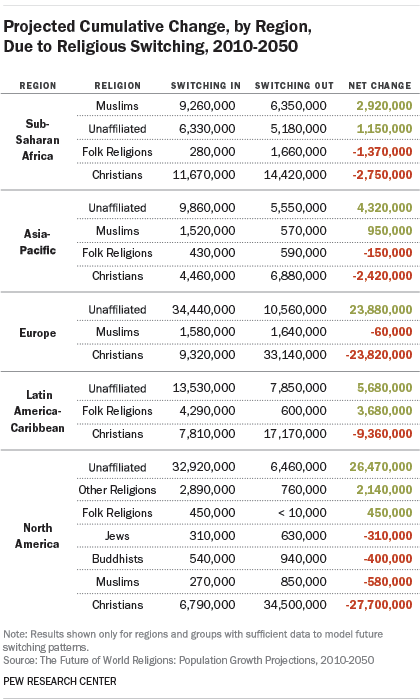
Projected Cumulative Change, by Region, Due to Religious Switching, 2010-2050

At the regional level, some patterns stand out. The largest projected net gains from switching between 2010 and 2050 are into the ranks of the unaffiliated, particularly in North America (26 million), Europe (24 million), Latin America (6 million) and the Asia-Pacific region (4 million). But in sub-Saharan Africa, the greatest net gains are expected for Muslims (3 million).

The largest net losses are expected among Christian populations, notably in North America (28 million), Europe (24 million), Latin America and the Caribbean (9 million) and sub-Saharan Africa (3 million). In the Asia-Pacific region, Christians are expected to have a net loss, due to religious switching, of more than 2 million adherents.

Alternative Scenarios: Seeing How Much Difference Switching Makes

Religious switching may have a large impact on the religious composition of individual countries. But over the 40-year horizon of these projections, it is expected to have only a modest effect on the global size of most religious groups.

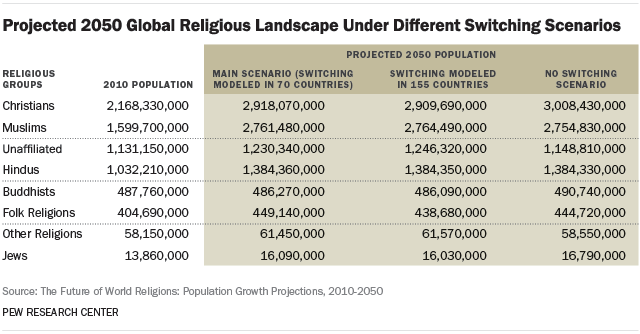
The global impact of religious switching can be seen by comparing the main projection scenario used in this study, which models switching in 70 countries, with two hypothetical scenarios – one in which switching is modeled in a total of a 155 countries, and one that assumes no switching will occur anywhere.

In the main projection model used throughout this report, the 70 countries with documented switching data contain 42% of the world’s population, as of 2010. In the second scenario considered here, switching is projected in an additional 85 countries by using some of the initial 70 countries as proxies for switching patterns in similar, often neighboring, nations.30 For example, although no direct data on switching is available for Canada, one might assume that Canada is similar to the United States and therefore apply the same rates of switching observed in the U.S. to Canada’s population. Since the 85 additional countries account for about 10% of the world’s population, the second scenario models switching among a little more than half the people on Earth.

The third scenario assumes that no religious switching will take place from 2010 to 2050, meaning that every adult will remain in the group in which he or she was raised. All those raised as Christians will stay Christian, all those raised without a religion will stay unaffiliated, and so on. But this hypothetical “no switching” scenario, like the other two scenarios, takes into account all the other demographic drivers affecting the future size of religious groups: fertility rates, mortality rates, current age profiles and migration patterns.

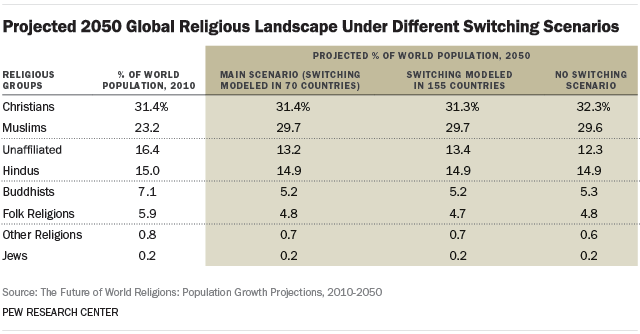
The biggest differences in the outcome of these three scenarios are the size of the Christian and unaffiliated populations in 2050. The Christian share of the world’s population is greatest in the “no switching” scenario (32.3%), followed by the main scenario that models switching in 70 countries (31.4%). It is slightly lower (31.3%) in the scenario that models switching in 155 countries.

The unaffiliated share of the world’s population is lowest in 2050 (12.3%) in the scenario with no switching. When switching is modeled in 70 countries – the main scenario – 13.2% of the world’s population is projected to have no religious affiliation in 2050. When switching is modeled for an additional 85 countries using proxy data, the projections show 13.4% of the global population as religiously unaffiliated in 2050.

Comparing the outcomes of these three scenarios suggests that religious switching – at least at recently observed levels, in the limited number of countries for which data on switching are available – will have a relatively small impact on the projected size of major religious groups in 2050.

The biggest unknown factor, however, is China, the world’s most populous country. Because of a lack of reliable data on religious switching in China, none of the scenarios models religious switching among its 1.3 billion people. If there is considerable switching in China in the coming decades, it could lower the percentage of the world’s population that is unaffiliated and boost the numbers of Christians, Buddhists and perhaps other groups. (See sidebar on China at the end of this chapter.)

Projected 2050 Global Religious Landscape Under Different Switching Scenarios (Percentage)
Projected 2050 Global Religious Landscape Under Different Switching Scenarios


Migration

International migration has no immediate impact on the global size of religious groups. But, over time, migration can significantly change the religious makeup of individual countries and even entire regions. Europe, for example, has experienced an inflow of Muslims from North Africa, South Asia and Turkey over the past decade. And some of the Gulf Cooperation Council states, such as Qatar and the United Arab Emirates, have had substantial immigration of non-Muslims from Asia and beyond.31

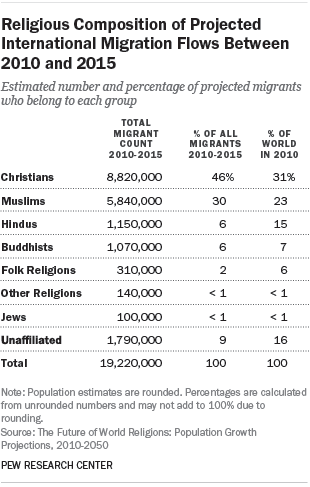
Religious Composition of Projected International Migration Flows Between 2010 and 2015

Estimating future migration is challenging because the movement of people across borders is dependent on government policies and international events that can change quickly. And because many migrants follow economic opportunities, migration patterns also are dependent on changing economic conditions.

Nonetheless, it is possible to use data on past migration as a reasonable estimate for the future, just as past fertility and religious switching patterns are used in this report to model future fertility and switching.

The Pew Research Center, in collaboration with researchers at the International Institute for Applied Systems Analysis, has developed an innovative technique to estimate recent migration patterns and their religious breakdown. First, recent changes in the origins and destinations of migrants worldwide are estimated using census and survey data about the migrant population living in each country. Changes in this migrant “stock” data over the 2005 to 2010 period are used to estimate migrant “flows,” the number of people who moved between countries during this period, taking into account the slowing of migration in many parts of the world due to an economic downturn.32 Second, religious breakdowns of migrants based on data from the Pew Research Center’s Global Religion and Migration Database are applied to the origins and destinations of migrants. Finally, the religious breakdown of migrant flows is used to calculate migration rates into and out of most countries by religion, by sex and by five-year age groups. (For more detail on how future migration was projected, see the Methodology.)

Initial Effects of Migration, 2010-2015

Between 2010 and 2015, approximately 19 million people are expected to move across international borders. Most of them are either Christians or Muslims, the world’s two largest religious groups. Christian migrants who are projected to number nearly 9 million, or 46% of all international migrants between 2010 and 2015 are expected to come primarily from Latin America and the Caribbean and to move primarily to the United States. Muslim migrants, numbering about 6 million in total, are expected to come largely from the Asia-Pacific and Middle East-North Africa regions, migrating within those same regions as well as to Europe and North America.

Nearly 3 million migrants, or about 14% of the expected total between 2010 and 2015, are estimated to be Hindus, Buddhists, Jews, adherents of folk religions or members of other religious groups. About 2 million migrants (9%) are expected to have no religious affiliation.

As a result of these movements from one region to another, the Asia-Pacific region is projected to experience a net loss of approximately 2 million Muslims and 500,000 Hindus between 2010 and 2015. The Latin America-Caribbean region is likely to see a net loss of 3 million Christians from migration. And sub-Saharan Africa is projected to have a net loss of about 500,000 Christians and Muslims, combined.

However, the birth rates in these regions are relatively high, and their current populations are relatively young. Consequently, their total populations are projected to grow despite emigration, and the outflows are not likely to significantly change their religious makeup.

By contrast, net inflows of migrants are expected to have a substantial impact on the religious makeup of many countries in Europe, North America and the Middle East-North Africa region. For example, a net inflow of 1 million Muslims is projected to occur in Europe between 2010 and 2015. Smaller numerical gains from migration also are projected in Europe for both Buddhists and Hindus.

Religious minorities in North America also are expected to experience net gains from migration between 2010 and 2015, including Muslims (about 400,000), Hindus (about 200,000) and Buddhists (about 200,000). These religious groups are expected to come from all over the world, but primarily from Asia and the Pacific.

The Middle East-North Africa region is likely to see a net inflow of Hindus and Christians through migration, primarily to the oil-rich Gulf states. Hindus are expected to come principally from India and Nepal, while Christians are projected to come from the Philippines, other countries in Asia and the Pacific and Europe.

Seeing How Much Difference Migration Makes in the 2010-2050 Projections

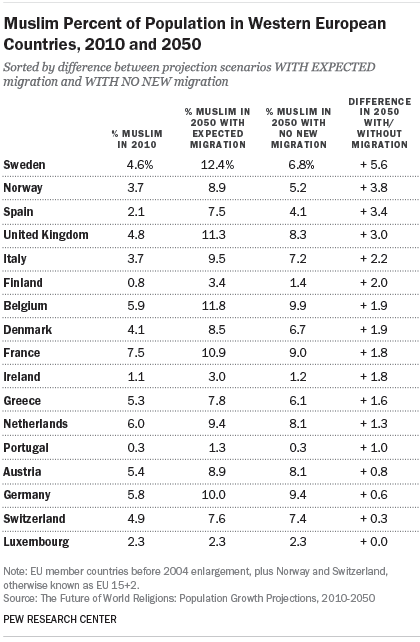
Muslim Percent of Population in Western European Countries, 2010 and 2050

To see how much impact migration has on the projections, researchers compared the main projection scenario used in this report with an alternative scenario in which no international migration occurs after 2010.

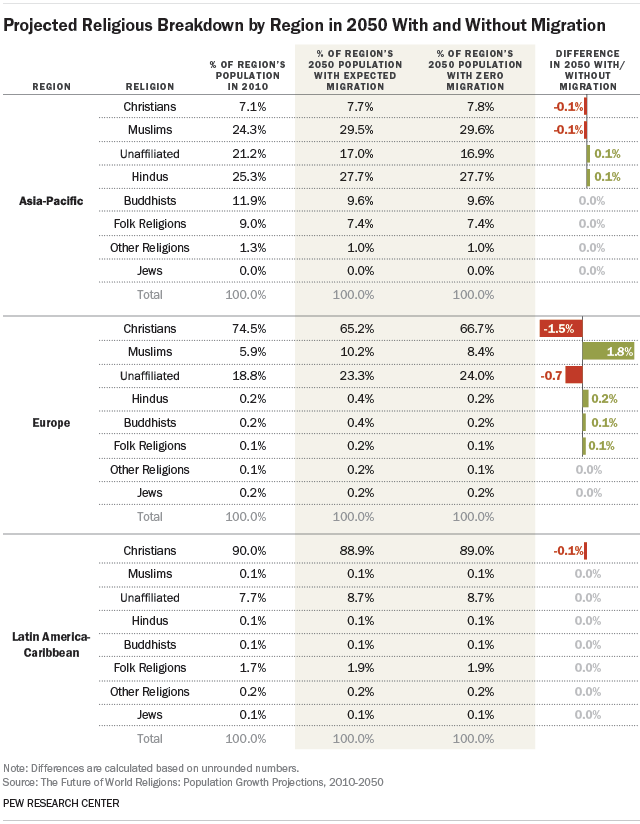
The main projections in this report indicate that the share of Muslims in Europe’s population will nearly double between 2010 and 2050, from about 5.9% to 10.2%. A variety of factors, including higher birth rates and a bulging youth population among Muslims in Europe, underlie this expected increase. But immigration also plays a role. The projected share of Muslims in Europe in 2050 is nearly two percentage points higher than in the alternative scenario with no new migration. Indeed, about half (53%) of the projected growth of Europe’s Muslim population can be attributed to new migration.

In certain countries, the impact is even greater. Sweden’s population, for example, was 4.6% Muslim as of 2010; factoring in migration, that share is expected to more than double, to 12.4%, by 2050. In an alternative scenario involving no additional immigration to Sweden after 2010, the Muslim share of the population still would increase by 2050, but only to 6.8%. In addition to Sweden, the European countries in which migration is projected to make the biggest impact on the Muslim population – a difference of at least three percentage points – are Norway, Spain and the United Kingdom.

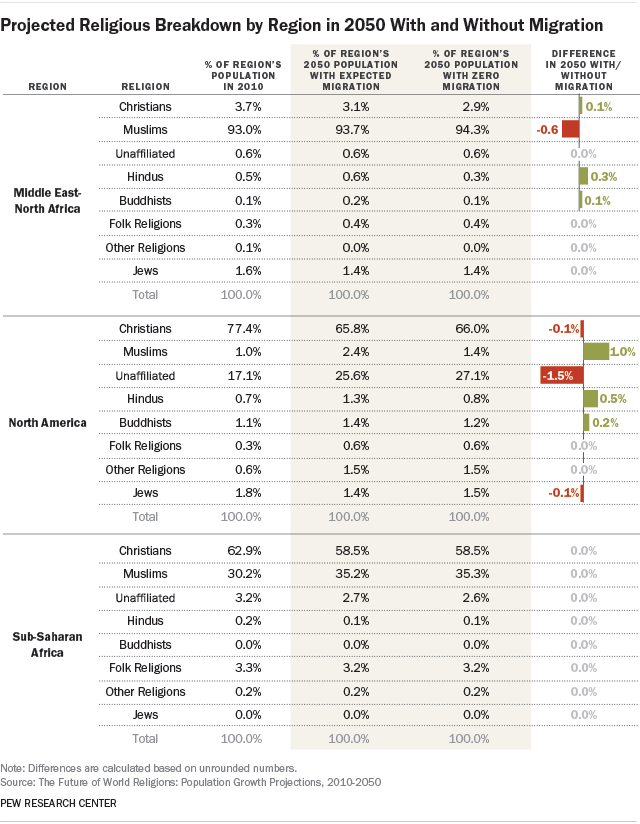
In North America, minority religious groups (including Muslims, Hindus, Buddhists, other religions and the unaffiliated) also are projected to grow, partly due to immigration. For example, Muslims are projected to make up 2.4% of North America’s population in 2050 when factoring in migration, but only 1.4% with no new migration. Similarly, the ranks of the religiously unaffiliated in North America are forecast to be 1.5 percentage points higher in a projection scenario that includes migration than in an alternative scenario that assumes zero migration from 2010 to 2050.

A few countries in the Asia-Pacific region are likely to experience religious change due to immigration. For example, Australia and New Zealand are projected to have slight increases in their non-Christian populations, as Muslims, Buddhists and Hindus continue moving to these two countries. Muslim and Christian populations are forecast to grow in economic hubs such as Hong Kong and Japan as immigrants belonging to these religious groups move from various countries in East Asia, including Indonesia and the Philippines. Meanwhile, the Hindu and Muslim shares of Singapore’s population are anticipated to grow significantly in the years ahead, mostly due to migration from India and Malaysia.

The Middle East-North Africa region also is expected to experience substantial religious change when immigration is factored into the projections, mostly due to anticipated migration to Gulf Cooperation Council (GCC) countries. The shares of Hindus and Buddhists are both projected to rise in these majority-Muslim countries; in fact, about 90% of Buddhist and Hindu growth in the region can be attributed to migration. Although migration is expected to boost the religious diversity of GCC countries, all the Gulf states are projected to retain Muslim majorities in 2050.

Religious change also can occur as a result of emigration, the movement of people out of a country or region. The departure of Christians from the Middle East-North Africa region, for example, lowers the projected share of Christians in places such as Egypt, Israel, Iraq, Jordan, Lebanon, the Palestinian territories and Syria.

But across the Middle East and North Africa as a whole, the emigration of Christians is expected to be offset by an influx of Christian immigrants in the Gulf Cooperation Council countries. Indeed, the net number of Christians entering GCC countries is expected to be about three times as large (1.5 million) as the net number of Christians leaving countries with historic Christian populations in the Middle East-North Africa region (about 500,000).

Christian Count and Share of the Middle East-North Africa Region’s Population, 2010 and 2050


Emigration of smaller religious groups from some regions is expected to have a noticeable effect. For example, most of the projected decline in the number of Jews in Europe (from 1.4 million in 2010 to 1.2 million in 2050) and sub-Saharan Africa (from 100,000 in 2010 to 70,000 in 2050) can be attributed to Jewish emigration from these regions, mainly to Israel. And most of the expected decline of Hindus in Latin America and the Caribbean (from 660,000 in 2010 to 640,000 in 2050) is due to Hindu emigration out of the region, mainly to North America.

Projected Religious Breakdown by Region in 2050 With and Without Migration (Asia, Europe, Latin America)
Projected Religious Breakdown by Region in 2050 With and Without Migration (Middle East, North America, Africa)

The Potential Impact of Religious Switching in China

With a population currently estimated at more than 1.3 billion, China could make a big difference in the global religious landscape during the coming decades. China now officially recognizes Buddhism, Islam, Taoism, as well as Protestants associated with the Protestant Three-Self Patriotic Movement and Catholics who are part of the Catholic Patriotic Association.33 Adherents of other religions, including Christians who worship in unregistered churches, may be reluctant to reveal their religious identity to officials or strangers. Measuring religious affiliation in China relies on imperfect surveys and other sources of data, including reports by official religious bodies, ethnic proxies (for Muslims), and estimates by religious groups operating in networks that are not approved by the Chinese government. Surveys that do exist, for instance, seem to underreport unregistered groups and Chinese folk religions in particular. Therefore, not only are current estimates only rough estimates, but reliable data on recent trends are unobtainable. Furthermore, in the past decade hundreds of millions of Chinese have moved from the countryside – where unregistered practice was reported by observers to be higher – to cities where religious networks may not have been transferred or replaced.34

There are no sources adequate to measure patterns of religious switching across China. This sidebar briefly reviews some of the challenges of measuring religion in China and provides an example of how religious switching in China could alter the global projections in this report.

While it is clear that religious affiliation and practice have risen dramatically in China since the end of the Cultural Revolution, data on recent patterns of religious switching are practically nonexistent35. Anecdotally, some newspaper articles and reports from religious groups have attempted to describe changes underway in China, but it is unclear how accurately these accounts reflect change underway at the country level.36 Still, some experts believe that China’s Christian population is growing, perhaps rapidly. Most notably, one of the world’s leading specialists on religion in China, Purdue University sociologist Fenggang Yang, estimates that the Christian population in China grew at an average annual rate of 7% between 1950 and 2010. At this rate, Yang calculates the proportion of China’s population that is Christian could grow from 5% in 2010 to 67% in 2050.37

Without survey data measuring patterns of switching among China’s main religious groups, it is not possible to formally model switching in China, as this report does for other countries.38 However, it is possible to conduct sensitivity tests that provide ballpark estimates of how much impact religious change in China could, potentially, have on the global religious landscape.

While all religious groups in China could be experiencing significant change through switching, media reports and expert assessments generally suggest that the main effects are rising numbers of Christians and declining numbers of religiously unaffiliated people. The following sensitivity tests assume, for illustrative purposes, that switching is limited to this movement between the unaffiliated and Christians.

As of 2010, China had an estimated 68 million Christians and 701 million unaffiliated people. Due primarily to differences in the age and sex composition of these initial populations, in the main projection scenario – which does not attempt to model religious switching – China’s Christian population is expected to grow slightly by 2050, to 71 million, while the unaffiliated population is expected to decline to 663 million.

Under that main scenario, 5.4% of China’s population and 31.4% of the world’s total population will be Christian in 2050. If China’s Christian population were to decline to Japanese levels (2.4% of the country’s population) in 2050, it would reduce the Christian share of the global population to 30.9%. On the other hand, if China’s Christian population was to increase to the level projected for South Korea in 2050 (33.3% of the country’s population), it would raise the count of Christians in China to 437 million and the share of Christians in the world’s overall population to 35.3%.

And if everyone who is currently unaffiliated in China were to convert to Christianity by 2050, China’s population would be 56.2% Christian (734 million Christians), raising the Christian share of the world’s population to 38.5% and lowering the unaffiliated share of the global population to 6.1%. Though that scenario may be unlikely, it offers a rough sense of how much difference religious switching in China maximally could have by 2050. Extremely rapid growth of Christianity in China could maintain or, conceivably, even increase Christianity’s current numerical advantage as the world’s largest religion, and it could significantly accelerate the projected decline by 2050 in the share of the global population that is religiously unaffiliated.

Chapter 2: Population Projections by Religious Group

This chapter uses standard demographic methods to project changes in the size of eight major religious groups from 2010-2050. The groups, presented in descending order of their 2010 size, are: Christians, Muslims, the religiously unaffiliated, Hindus, Buddhists, adherents of folk or traditional religions, members of “other religions” (consolidated into a single group) and Jews.

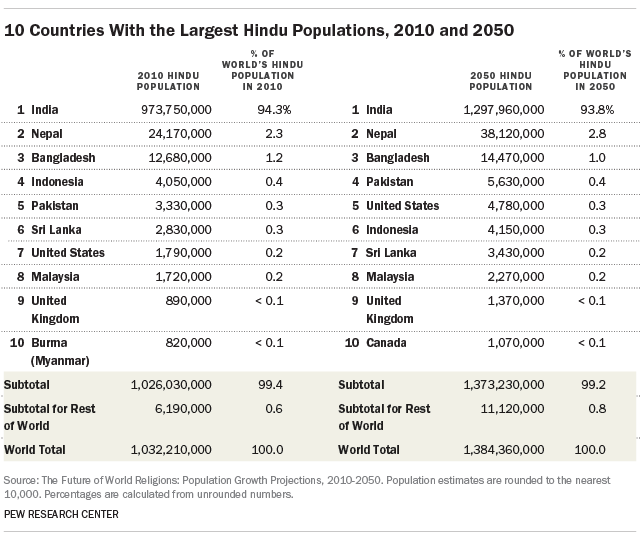
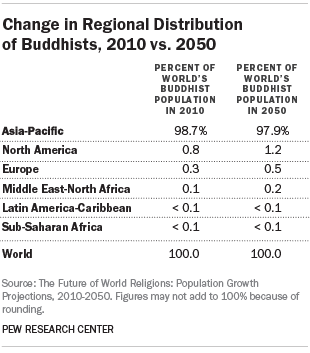
Each section begins with an overview of projected population trends for a particular religious group, including its expected annual growth rate in the coming decades. The sections also look at projected changes in the regional distribution of each group, as well as changes in the 10 countries with the largest populations of each group from 2010 to 2050. Finally, the sections examine the demographic factors behind the expected changes: fertility, life expectancy, age structure, religious switching and migration.

Christians

The world’s Christian population is expected to grow from 2.2 billion in 2010 to 2.9 billion in 2050.39 Nearly one-in-three people worldwide (31%) are expected to be Christian at mid-century, the same share as in 2010.

Projected Compound Annual Growth Rates for Christians Between Five-Year Periods

While the overall share of the world’s population that is Christian is expected to remain relatively steady, the regional distribution of Christians is projected to change. Perhaps most notably, the share of the world’s Christians living in sub-Saharan Africa is expected to grow – from 24% in 2010 to 38% by 2050 – while the share living in Europe will continue to fall, from 26% in 2010 to about 16% by 2050.

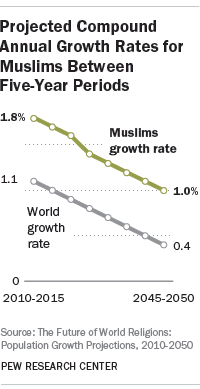
The annual growth rate of the world’s population is expected to decline gradually in the coming decades, falling from 1.1% in 2010-2015 to 0.4% in 2045-2050. The annual growth rate of Christians is expected to remain roughly on par with world population growth.

Regional Change

Christianity has spread far from its historical origins and is geographically widespread. As noted in a 2011 Pew Research Center report on global Christianity, it has become a more geographically diverse religion since 1910, becoming less concentrated in Europe and more evenly distributed throughout the Americas, sub-Saharan Africa and the Asia-Pacific region.

As of 2010, about a quarter of the global Christian population was in Europe (26%), a quarter in Latin America and the Caribbean (25%) and a quarter in sub-Saharan Africa (24%). Significant numbers of Christians also live in Asia and the Pacific (13%) and North America (12%). Less than 1% live in the Middle East-North Africa region, where Christianity began.

Change in Regional Distribution of Christians, 2010 vs. 2050

The regional distribution of Christians is forecast to change considerably by 2050. Europe is no longer projected to have a plurality of the world’s Christians; in fact, only about 16% of the world’s Christians are expected to be living in Europe as of 2050. In addition, the shares of the global Christian population residing in Latin America and the Caribbean (23%) and North America (10%) are projected to decline modestly.

Meanwhile, sub-Saharan Africa is expected to become the region with the largest number of Christians – by a wide margin. Sub-Saharan Africa’s share of the global Christian population is forecast to rise from 24% in 2010 to 38% in 2050.

World Christian Population by Region, 2010 and 2050

Europe is the only region where the absolute number of Christians is expected to decline by 2050. Europe’s Christian population is projected to fall from 553 million in 2010 to 454 million in 2050. During this period, the share of Europe’s population that identifies as Christian also is expected to decline, from 75% to 65%.

In all other regions, the absolute number of Christians is expected to grow in the coming decades. However, the share of the population that is Christian is forecast to decline within all regions except Asia and the Pacific. In sub-Saharan Africa, for example, the size of the Christian population is projected to more than double in the next few decades, growing from about half a billion people in 2010 to more than a billion in 2050. However, the share of sub-Saharan Africa’s population that is Christian is expected to drop slightly, from 63% in 2010 to 59% in 2050, because of even more rapid growth among the region’s Muslims.

Christian Population Growth Compared With Overall Growth in Each Region, 2010 to 2050

Between 2010 and 2050, the largest Christian population growth, in percentage terms, is projected to occur in sub-Saharan Africa (115%). However, the population growth of Christians in sub-Saharan Africa is expected to be less than in the region overall (131%). By contrast, population growth of Christians in Asia and the Pacific is projected to be higher (33%) than in the region overall (22%).

The Christian population in Europe is expected to decline more between 2010 and 2050 (minus 18%) than the population in Europe overall (minus 6%). During this period, the Christian population in North America is projected to grow by 8%, much less than the region’s population as a whole (26%).

Change in Countries With Largest Christian Populations

Projected Population Change in Countries With Largest Christian Populations in 2010

Christians are expected to keep pace with global population growth largely due to their expected growth in sub-Saharan Africa.

Of the 10 countries with the largest Christian populations in 2010, six are expected to decline as a share of the global population between 2010 and 2050. But three African countries (Nigeria, the Democratic Republic of the Congo and Ethiopia), as well as the Philippines, are each expected to account for a larger share of the world’s population in the decades ahead.

Four countries had more than 100 million Christians in 2010: the United States (243 million), Brazil (173 million), Mexico (108 million) and Russia (105 million).

Most of the 10 countries with the largest Christian populations in 2010 were majority-Christian countries. In fact, many of these countries had large Christian majorities, including the United States (78% in 2010) and Brazil (89%). One exception is China, where Christians made up only 5% of the population. Also, even though there were a large number of Christians living in Nigeria in 2010 (78 million), they were slightly less than half of Nigeria’s population (49%).

About 11% of the world’s Christians lived in the United States as of 2010, while about 8% lived in Brazil and 5% in Mexico. All in all, nearly half (48%) of the world’s Christians lived in the 10 countries with the largest Christian populations.

By 2050, the list of the 10 countries with the largest Christian populations is anticipated to change considerably. The United States and Brazil are expected to remain atop the list, but Mexico is projected to fall from third to sixth and Russia is expected to drop from fourth to eighth. Germany and China are not expected to appear on the 2050 list.

Nigeria (155 million Christians as of 2050), the Philippines (144 million), the Democratic Republic of the Congo (142 million) and Ethiopia (85 million) each are expected to rise at least one spot on the list. In fact, Nigeria is projected to have the world’s third-largest Christian population in 2050, even though Christians are projected to make up only 39% of Nigeria’s 2050 population.

Two other nations in sub-Saharan Africa are forecast to join the list: Tanzania, with 94 million Christians in 2050, and Uganda (81 million).

Similar to 2010, nearly half (47%) of the world’s 2050 Christian population is expected to be found in these 10 countries. In 2050, no single country is forecast to have more than 10% of the world’s Christian population.

10 Countries With the Largest Christian Populations, 2010 and 2050


Demographic Characteristics of Christians That Will Shape Their Future 

Fertility

Total Fertility Rates of Christians by Region, 2010-2015

With a Total Fertility Rate (TFR) of 2.7 children per woman in the 2010-2015 period, Christians worldwide have fertility levels slightly higher than the world’s overall population (2.5), and significantly higher than the replacement level of 2.1 children per woman (the number considered necessary to maintain a stable population, all else being equal).

Christian fertility rates are lowest in Europe (1.6), but are at or above the replacement level in all other regions. They are highest in sub-Saharan Africa (4.4), though Christian fertility is lower in sub-Saharan Africa than the region’s overall fertility rate (4.8), due in large part to the higher fertility of Muslims in the region. The countries where Christians have the highest fertility rates in the 2010-2015 period are Zambia (6.3) and Chad (6.2). Christians have the lowest fertility rates in Portugal (1.3), South Korea (1.3), Singapore (1.1), the Republic of Macedonia (1.1) and Bosnia-Herzegovina (1.1).

Indeed, where Christians live alongside large Muslim populations, they often have lower fertility than Muslims, such as in Egypt (1.9 TFR for Christians compared with 2.7 for Muslims) and in India (2.3 vs. 3.2). An exception is Indonesia, the country with the world’s largest Muslim population in 2010; Christians there have higher fertility (2.6) than the Muslim majority (2.0).

Total Fertility Rates of Christians, by Country

Age Structure

Age Distribution, 2010

Globally, Christians were only slightly older (median age of 30) than the overall population (median age of 28) in 2010. Similarly, the age breakdown of the world’s total population is not all that different from that of the world’s Christian population. For example, 27% of the world’s Christians are younger than 15, as are about 27% of the world’s people overall.

Age Distribution of Christians by Region, 2010

The age distribution of Christians varies dramatically across regions. The youngest Christians, as of 2010, were in sub-Saharan Africa (median age of 19), while the oldest Christians lived in Europe (median age of 42). However, in most regions, Christians were not considerably younger or older than the general population in 2010. The only exception was the Middle East and North Africa, where Christians were somewhat older (median age of 29) than the overall population of the region (median age of 24).

Religious Switching

Projected Scenarios for Christians With and Without Religious Switching, 2050

In the main projection scenario described in this report, religious switching is factored into population projections for all 70 countries for which sufficient data on recent switching patterns are available. In an alternative scenario, no religious switching is modeled in any country. Comparing results between these two scenarios provides a sense of how much impact religious switching is expected to make on the size of the Christian population in the years to come.

Worldwide, religious switching is projected to have a modest impact on changes in the Christian population. Christians would make up a slightly larger share of the world’s inhabitants in 2050 (32% rather than 31%) if religious switching were not taken into account.

In specific regions, religious switching is forecast to have a more substantial impact on Christian populations. In North America, Europe and the Latin America-Caribbean region, Christians are projected to experience net losses because of religious switching, with most of the switching toward no religious affiliation. Consequently, population projections with and without religious switching can differ dramatically.

In North America, for example, about 66% of the region’s 2050 population is projected to be Christian when religious switching patterns are taken into account. The expected share of Christians in North America would be as high as 75% if religious switching were not included in the projections. Similarly, the expected percentage of Europe’s population that is Christian would be nearly 70% in 2050 if no religious switching were factored in, but it is 65% when religious switching is included in the projections.

Data for religious switching are unavailable for many countries in sub-Saharan Africa as well as the Asia-Pacific and Middle East-North Africa regions; as a result, population projections with and without religious switching are similar in these regions.

Migration

Projected Scenarios for Christians With and Without Migration, 2050

More than 5 million Christians are expected to move from one region to another between 2010 and 2015. Many of them are forecast to move to North America, including more than 2 million from the Latin America-Caribbean region and about 440,000 from the Asia-Pacific region. About 250,000 Christians are expected to move from Asia and the Pacific to the Middle East and North Africa between 2010 and 2015. These migration patterns are projected to continue in the decades ahead. (See the Methodology for more information on how migration flows were estimated.)

The impact of migration on Christian populations can be seen by comparing results from the main projection scenario, which includes expected migration patterns, with an alternative scenario that does not attempt to take migration into account.

Although a large number of Christian migrants are forecast to move to North America in the decades ahead, many migrants belonging to other religions also are expected to arrive; whether or not migration is included in the projection model, Christians are forecast to make up two-thirds of North America’s population in 2050. Migration – particularly by members of non-Christian faiths – will have a more noticeable impact in Europe. When migration is included in the projection model, the share of Europe’s population expected to be Christian in 2050 is 65%, 2 percentage points lower than in the scenario that does not include any new migration (67%).

In the Middle East and North Africa, the relatively high number of Christian immigrants to Gulf Cooperation Council (GCC) countries is expected to slightly boost the Christian share of the region’s population. (For more information on Christian migrants to the GCC countries, see Chapter 3.)

Christian Migration, 2010-2015


Muslims

The number of Muslims around the world is projected to increase rapidly in the decades ahead, growing from about 1.6 billion in 2010 to nearly 2.8 billion in 2050.40 Muslims are expected to grow twice as fast as the overall global population. Consequently, Muslims are projected to rise from 23% of the world’s population in 2010 to 30% in 2050.41

Projected Compound Annual Growth Rates for Muslims Between Five-Year Periods

This significant projected growth is largely due to the young age and high fertility rate of Muslims relative to other religious groups.

The annual growth rate of Muslims is expected to be considerably higher than the rate for the world as a whole. In 2010-2015, the expected Muslim growth rate is 1.8% while the rate for the world’s population is 1.1%. Both rates are expected to decline over time. In 2045-2050, for example, the annual growth rate of Muslims is projected to be about 1% while it will be 0.4% for the world.

Regional Change

Change in Regional Distribution of Muslims, 2010 vs. 2050

Looking to the future, the Asia-Pacific region is expected to remain the home of a majority of the world’s Muslims. However, the share of the global Muslim population living in several Asian countries with large Muslim populations (such as Indonesia, Pakistan and Bangladesh) is anticipated to decline between 2010 and 2050. While 62% of the world’s Muslims lived in Asia and the Pacific in 2010, 53% are projected to live in the region in 2050.

The Middle East-North Africa region is predominantly Muslim, but as of 2010, only one-in-five Muslims lived in that part of the world. By 2050, about the same share of the global Muslim population is expected to live in the Middle East and North Africa (20%).

Sub-Saharan Africa is projected to have a significantly larger share of the world’s Muslims in 2050 compared with 2010. About 24% of the world’s Muslims are expected to live in sub-Saharan Africa in 2050, up from nearly 16% in 2010.

Muslim populations are expected to grow in absolute number in all regions of the world between 2010 and 2050. In the Asia-Pacific region, for instance, the Muslim population is expected to reach nearly 1.5 billion by 2050, up from roughly 1 billion in 2010. The number of Muslims in the Middle East-North Africa region is expected to increase from about 300 million in 2010 to more than 550 million in 2050. The Muslim population in sub-Saharan Africa is forecast to more than double, growing from about 250 million in 2010 to nearly 670 million in 2050. The absolute number of Muslims also is projected to increase in regions with smaller Muslim populations, including Europe and North America.

World Muslim Population by Region, 2010 and 2050

Although a smaller share of the world’s Muslims are projected to live in the Asia-Pacific region in 2050 compared with 2010, the share of the region’s population that is Muslim is expected to grow from 24% in 2010 to nearly 30% in 2050. In fact, Muslims are projected to surpass Hindus and become the largest religious group in the Asia-Pacific region by 2050.

The share of the population in sub-Saharan Africa that is Muslim also is expected to grow in the coming decades, from about 30% in 2010 to 35% in 2050. Meanwhile, the overwhelming majority of the population in the Middle East and North Africa is projected to remain Muslim – increasing from about 93% of the region’s population in 2010 to 94% in 2050.

Muslim Population Growth Compared With Overall Growth in Each Region, 2010 to 2050

As a share of Europe’s population, Muslims are expected to nearly double, growing from about 6% in 2010 to about 10% in 2050. In North America, the share of the population identifying with Islam is expected to grow from 1% to 2% in the coming decades.

Between 2010 and 2050, the most rapid Muslim population growth in percentage terms is projected to occur in North America (197%) — more than seven times the expected increase in the region’s overall population (26%). The Muslim population in sub-Saharan Africa also is anticipated to grow more than in the region as a whole (170% vs. 131%).

With the bulk of the Middle East-North Africa region’s population being Muslim, the overall growth for Muslims there (74%) is expected to be about the same as the region overall (73%).

The Muslim population in Europe is expected to grow by 63% between 2010 and 2050, while Europe’s overall population is expected to decrease in size (minus 6%). During this period, the Muslim population in the Asia-Pacific region is expected to increase by 48% while the region’s population as a whole increases by 22%. The relatively small population of Muslims in Latin America and the Caribbean is anticipated to increase by 13% between 2010 and 2050, while the region’s overall population is expected to grow 27%.

Change in Countries With Largest Muslim Populations

Collectively, the 10 countries with the largest Muslim populations in 2010 are expected to account for roughly the same share of the world’s total population in coming decades (35% in 2050, compared with about 32% in 2010). In most cases, little change is expected in each country’s share of the global population. The one exception is Nigeria, where about 4% of the world’s population is expected to reside in 2050 (up from about 2% in 2010).

Projected Population Change in Countries With Largest Muslim Populations in 2010

In eight of the 10 countries, the share of the population that is Muslim is expected to remain about the same. However, the Muslim share of the population is expected to increase in India and Nigeria. Muslims made up 14% of India’s population in 2010; they are expected to rise to 18% in 2050. Less than half of Nigeria’s population (49%) was Muslim in 2010, but Muslims are expected to make up a majority of the population (59%) in 2050.

As of 2010, Indonesia had the largest number of Muslims (about 209 million Muslims, or about 13% of the world’s Muslims), followed by India (176 million, or about 11%), Pakistan (167 million, 10%) and Bangladesh (134 million, 8%). Nigeria, Egypt, Iran and Turkey each also had more than 70 million Muslims in 2010.

With the exception of India, where Muslims are a minority religious group, and Nigeria, where Muslims made up nearly half the population, the other eight countries on the list each had a large Muslim majority in 2010. India is projected to have the world’s largest Muslim population in 2050 (311 million), while Pakistan is expected to have the second-most Muslims (273 million). Indonesia – the country with the largest number of Muslims in 2010 – is expected to fall to third place by 2050, with 257 million Muslims. Nigeria is forecast to rank fourth, with about 231 million Muslims at mid-century.

By 2050, Iraq and Afghanistan are expected to join the list of countries with the 10 largest Muslim populations. All told, more than six-in-ten of the world’s Muslims (62%) are projected to live in the 10 countries with the most Muslims in 2050, slightly smaller than the share of the world’s Muslims that lived in the top 10 countries in 2010 (66%).

10 Countries With the Largest Muslim Populations, 2010 and 2050


Demographic Characteristics of Muslims That Will Shape Their Future

Fertility

Total Fertility Rates of Muslims by Region, 2010-2015

With a Total Fertility Rate (TFR) of 3.1 children per woman, Muslims have higher fertility levels than the world’s overall population between 2010 and 2015 (2.5). High fertility is a major driver of projected Muslim population growth around the world and in particular regions. In every region for which data were available, the TFR for Muslims is at or above the replacement level of 2.1 children per woman (the number needed to maintain a stable population, all else being equal).

In every region except the Middle East and North Africa, Muslim fertility is higher than the rate for the region as a whole. Muslim women in sub-Saharan Africa, for example, have nearly one more child on average than women in the region overall between 2010 and 2015.

The countries with the highest Muslim fertility in the 2010-2015 period are concentrated in sub-Saharan Africa, including Niger (6.9), Nigeria (6.5), Somalia (6.3), Mali (6.1), Rwanda (6.0) and Malawi (6.0). The Muslim fertility rate in India (3.2) is around the same as the global rate for Muslims (3.1); in part because Muslims in Indonesia are having fewer children (2.0), India is expected to pass Indonesia and become the country with the world’s largest Muslim population by 2050. While Muslim fertility is well above replacement level in many countries, it is below replacement level in Iran (1.6) and in much of Eastern Europe, including Romania (1.5) and Russia (1.6).

Total Fertility Rates of Muslims, by Country

Age Structure

Age Distribution, 2010

Globally, Muslims were younger (median age of 23) than the overall population (median age of 28) as of 2010. Indeed, of all the religious groups included in this study, Muslims had the youngest median age as of 2010. The percentage of the population younger than 15 is another indication of the relative youth of a population. In 2010, 34% of the global Muslim population was under age 15, compared with 27% of the overall world population.

Age Distribution of Muslims by Region, 2010

In the Asia-Pacific region, where about six-in-ten of the world’s Muslims live, the median age of Muslims (24) was five years younger than the median age of the region as a whole (29). Mostly owing to a high number of young immigrants and their children, Muslims in Europe (median age of 32) and North America (median age of 26) also were considerably younger than the general populations in these regions as of 2010.

Muslims in sub-Saharan Africa and the Middle East-North Africa region were similar in age to those regions’ general populations in 2010.

Religious Switching

Projected Scenarios for Muslims With and Without Religious Switching, 2050

In the Asia-Pacific region, the Middle East and North Africa and Latin America and the Caribbean, the projected Muslim share of the population in 2050 is about the same whether or not religious switching is taken into account in the population projections.

Religious switching only marginally changes the projected Muslim share of the population in North America, where the Muslim population is expected to be 0.2% smaller when religious switching is included in the projection scenario. This means that a small net loss of Muslims is occurring in North America through religious switching.

Meanwhile, net gains of Muslims through religious switching appear to be happening in sub-Saharan Africa and Europe. But again, they are not anticipated to significantly change the projected Muslim populations in these regions.

Migration

Projected Scenarios for Muslims With and Without Migration, 2050

About 3.6 million Muslims are expected to move to a new region between 2010 and 2015, mostly coming from majority-Muslim countries in the Asia-Pacific and Middle East-North Africa regions. More than 1 million are forecast to move to Europe, including 600,000 from Asia and the Pacific and an additional 470,000 from the Middle East and North Africa.

At the same time, about 170,000 Muslims from the Asia-Pacific region and 120,000 from the Middle East-North Africa region are forecast to move to North America between 2010 and 2015. And more than 1 million Muslim migrants are expected to move from the Asia-Pacific region to the Middle East-North Africa region during this time period. These migration patterns are projected to continue in the decades ahead. (See the Methodology for more information on how migration flows were estimated.)

As Muslim migrants leave the Asia-Pacific and Middle East-North Africa regions, their movements are projected to decrease slightly the shares of those regions that are Muslim while increasing the Muslim shares of Europe and North America.

When migration is factored into the projection models, Muslims are expected to make up 10% of Europe’s population in 2050; without migration, the figure would be about 8%. For North America, when migration is considered in the projection models, the expected share of the region’s 2050 population that is Muslim is about one percentage point higher than it would be without migration (2% vs. 1%).

Muslim Migration, 2010-2015


Religiously Unaffiliated

During the next few decades, the number of religiously unaffiliated people around the world is projected to grow modestly, rising from about 1.1 billion in 2010 to a peak of more than 1.2 billion in 2040 and then dropping back slightly.42 Over the same 40-year period, however, the overall global population is expected to increase at a much faster pace. As a result, the percentage of the world’s population that is unaffiliated is expected to drop, from 16% of the world’s total population in 2010 to 13% in 2050.

Projected Compound Annual Growth Rates for Unaffiliated Between Five-Year Periods

This decline is largely due to the advanced age and low fertility of religiously unaffiliated people globally relative to other religious groups. The three largest unaffiliated populations live in China, Japan and the United States; there also are significant numbers of religiously unaffiliated people in many European countries. All of these areas have older populations and lower fertility rates than the global population overall.

The annual growth rate of the world’s population is expected to decline from 1.1% in 2010-2015 to 0.4% between 2045 and 2050. The annual growth rate of the unaffiliated is expected to be substantially lower, starting at 0.6% in 2010-2015 and turning negative around 2040 (representing not just slower growth but actual shrinkage of the population).

Regional Change

Change in Regional Distribution of Unaffiliated, 2010 vs. 2050

The religiously unaffiliated are heavily concentrated in the Asia-Pacific region, where 76% resided in 2010 and 68% are projected to reside in 2050. The share of the unaffiliated population residing in Europe is projected to grow from 12% in 2010 to 13% in 2050. North America, which had about 5% of the world’s unaffiliated population in 2010, is expected to have 9% in 2050. The shares of the unaffiliated living in the three other regions are expected to increase modestly but remain relatively small.

Unaffiliated Population by Region, 2010 and 2050

While the bulk of the world’s unaffiliated population will continue to reside in the Asia-Pacific region, the share of the region’s population that is unaffiliated is projected to decline from 21% in 2010 to 17% in 2050. Meanwhile, the share of Europe’s population that is unaffiliated will rise from 19% to 23%. The unaffiliated also will make up a growing share of the population in North America, rising from 17% to nearly 26%.

The percentage of the population that is unaffiliated is expected to increase slightly in Latin America and the Caribbean between 2010 and 2050 and remain about the same in sub-Saharan Africa and the Middle East and North Africa.

Unaffiliated Population Growth Compared With Overall Growth in Each Region, 2010 to 2050

The religiously unaffiliated populations in North America and sub-Saharan Africa are expected to experience large growth in absolute size from 2010 to 2050. The religiously unaffiliated population in North America is projected to nearly double in size by 2050, growing by 89%. By contrast, North America’s total population is expected to grow only 26%. Sub-Saharan Africa’s religiously unaffiliated population also is expected to nearly double (increasing 92%), but this is less growth than is projected for the region overall (131%). The unaffiliated population in the Middle East and North Africa is expected to grow 56%, less than the region as a whole, while the unaffiliated population in Latin America and the Caribbean is projected to grow 44%, more than the region overall.

Europe’s unaffiliated population is expected to grow by 16%, whereas the region’s overall population is expected to decline by 6%. In the Asia-Pacific region — home to the largest unaffiliated population — the number of unaffiliated people is projected to decline by 2%, while the region’s population as a whole is expected to increase by 22%.

Change in Countries With Largest Unaffiliated Populations

Projected Population Change in Countries With Largest Unaffiliated Populations in 2010

All 10 countries on this list are expected to see their overall populations decline as a share of the world’s population. Collectively, these countries held 33% of the world’s population in 2010. By 2050, their share of the global population is expected to decline to 25%. China alone is expected to shift from having nearly 20% of the world’s population in 2010 to 14% in 2050.

In six of these countries (Japan, the United States, Vietnam, Germany, France and the United Kingdom), the share of the population that is unaffiliated is expected to increase in the coming decades. But the potential growth of the unaffiliated is constrained by the fact that these are all countries with overall populations that are shrinking as a share of the world’s people.

The religiously unaffiliated are heavily concentrated in relatively few countries. As of 2010, about 86% lived in the 10 countries with the largest unaffiliated populations. Consequently, the demographic trajectory of these countries will help shape the projected size of the global unaffiliated population in the decades to come.

In 2010, more than six-in-ten (62%) of the world’s religiously unaffiliated people lived in China. The next largest religiously unaffiliated populations were in Japan (6% of the global total), the United States (5%), Vietnam (2%) and Russia (2%).

In 2050, China is expected to remain home to a majority (54%) of the world’s unaffiliated population. The United States is expected to have the world’s second-largest unaffiliated population (8%), surpassing Japan (6%).

10 Countries With the Largest Unaffiliated Populations, 2010 and 2050


Demographic Characteristics of the Religiously Unaffiliated That Will Shape Their Future

Fertility

Total Fertility Rates of Unaffiliated by Region, 2010-2015

In general, the religiously unaffiliated have lower fertility levels than the world population overall. Globally, the Total Fertility Rate (TFR) for the unaffiliated is 1.7 children per woman in the 2010-2015 period, while the rate for the world’s entire population is 2.5.

The fertility of the unaffiliated is highest in sub-Saharan Africa (4.3), followed by Latin America and the Caribbean (2.3). In the other regions where data on the unaffiliated is available, their fertility rate is below replacement level, which is typically 2.1 children per woman.

The countries with the highest fertility rates among the unaffiliated in the 2010-2015 period are concentrated in sub-Saharan Africa. In Europe, North America and many Asian countries, fertility rates for the unaffiliated are below replacement level. (See map on 87.) For example, the unaffiliated fertility rate is 1.7 children in the United Kingdom, 1.6 in the United States and 1.5 in Japan. In Spain, it is just 1.0, and in Austria it is 0.9.

Total Fertility Rates of Unaffiliated, by Country

Age Structure

Age Distribution, 2010

Globally, the religiously unaffiliated population was older (median age of 34) than the overall population (median age of 28) as of 2010. In Asia and the Pacific, where most of the unaffiliated live, the median age of the unaffiliated (35) was six years higher than the regional median (29). While sub-Saharan Africa is the region with the youngest median age of religiously unaffiliated people (20), the region’s overall median age is even younger (18).

Age Distribution of Unaffiliated by Region, 2010

In other regions, the unaffiliated tend to be younger than the general population. In North America, the median age of the unaffiliated (30) is seven years younger than the regional median (37). In Europe, the median age of the unaffiliated (37) is three years below the overall median (40). And in Latin America and the Caribbean, the median age of the unaffiliated (26) is one year younger than the regional median (27).

Religious Switching

Projected Scenarios for Unaffiliated With and Without Religious Switching, 2050

In the main projections model used in this study, religious switching is factored into the population projections for all the countries for which sufficient data on recent switching patterns are available (70 countries). In an alternative scenario, however, no religious switching was modeled in any country.

Comparing results between these two scenarios gives a sense of how much impact religious switching is expected to make on the size of the religiously unaffiliated population in the years to come.

Worldwide, religious switching is projected to have a modest impact on changes in the unaffiliated population. The unaffiliated make up about 1% more of the global population when switching is taken into account (13% vs. 12%).

Switching makes more of a difference in some regions than others. The projected impact of switching is greatest in North America, where the projections that include switching have the unaffiliated population about 9 percentage points higher than without switching (26% vs. 17%).

Migration

Projected Scenarios for Unaffiliated With and Without Migration, 2050

Slightly more than 850,000 people with no religious affiliation are expected to move from one region to another region between 2010 and 2015. About 270,000 are forecast to move from the Asia-Pacific region (mainly from China) to North America. An additional 180,000 religiously unaffiliated people are projected to move to North America from Latin America and the Caribbean.

Europe is another source of migrants with no religious affiliation; about 80,000 are expected to move to the Asia-Pacific region and 40,000 to North America between 2010 and 2015. These migration patterns are projected to continue in the decades ahead. (See the Methodology on page 166 for more information on how migration flows were estimated.)

Despite this movement of people with no religious affiliation, migration is expected to have a fairly modest impact on the unaffiliated share of the population in the regions for which there is sufficient data. The impact of migration can be seen by comparing results from the main projection scenario, which includes expected migration patterns, with an alternative scenario that does not attempt to take migration into account.

Overall, the religiously unaffiliated shares of the immigrants moving to North America and Europe are expected to be smaller than the religiously unaffiliated shares of the populations already in those regions. If there were no further migration – if all movement of people across international borders were to stop – the projected unaffiliated shares of Europe (24%) and North America (27%) in 2050 each would be slightly higher than in the main scenario (Europe 23%, North America 26%), which factors migration patterns into the projection models.

Unaffiliated Migration, 2010-2015


Hindus

The number of Hindus around the world is projected to rise from slightly more than 1 billion in 2010 to nearly 1.4 billion in 2050. This increase will roughly keep pace with overall population growth. As a result, Hindus will remain fairly stable as a share of the world’s population over the next four decades, at about 15% in both 2010 and 2050.43

Projected Compound Annual Growth Rates for Hindus Between Five-Year Periods

India and Nepal were the only countries in which a majority of the population was Hindu in 2010, and they are expected to be the only Hindu-majority countries in 2050.44 In 2010, Hindus were the largest religious group in the Asia-Pacific region. By 2050, however, the number of Muslims in the region is expected to surpass the number of Hindus.

The annual growth rate of the world’s population is expected to decline gradually in the coming decades, falling from 1.1% in 2010-2015 to 0.4% in 2045-2050. The annual growth rate of Hindus is expected to remain roughly on par with world population growth through 2030-2035, after which it is projected to drop below the worldwide level. By 2045, Hindus are expected to be growing by about 0.2% annually, or roughly half as fast as the global population overall, largely as a result of declining fertility rates in India.

Regional Change

Change in Regional Distribution of Hindus, 2010 vs. 2050

Hindus are expected to remain very heavily concentrated in the Asia-Pacific region, where 99% lived in 2010 and a similar proportion is projected to reside in 2050. North America’s share of the world’s Hindu population is expected to grow from about 0.2% in 2010 to 0.4% in 2050. Very slight increases also are expected in the percentages of the world’s Hindus living in Europe and the Middle East-North Africa region. Slight decreases are forecast for sub-Saharan Africa and Latin America and the Caribbean.

World Hindu Population by Region, 2010 and 2050

In the coming decades, Hindus are expected to increase both in absolute number and as a share of the overall population in the Asia-Pacific region. In 2010, Hindus made up about 25% of the population in Asia and the Pacific. By 2050, Hindus are projected to make up nearly 28% of the region’s inhabitants. Over the same period, however, the Muslim population in the Asia-Pacific region is projected to grow even faster. As of 2010, there were more Hindus than there were members of any other religious group in the region. By 2050, Muslims are expected to be the Asia-Pacific region’s largest religious group, making up 30% of the region’s overall population, with Hindus as the second-biggest group. (For more information on Muslim population growth in the Asia-Pacific region and worldwide, see Chapter 3, page 143.)

Hindu Population Growth Compared With Overall Growth in Each Region, 2010 to 2050

In North America, the Middle East-North Africa region and Europe, Hindu populations are projected to increase both in absolute number and as a share of the overall populations, albeit in each case from a relatively small base. In North America, for example, the number of Hindus is expected to grow from 2.3 million in 2010 to 5.9 million in 2050, rising from 0.7% of North America’s overall population in 2010 to 1.3% in 2050.

Between 2010 and 2050, the most rapid Hindu population growth, in percentage terms, is projected to occur in North America (160%), more than six times the expected increase in the region’s overall population (26%). The second-fastest growth among Hindus is anticipated in the Middle East and North Africa (115%), also exceeding population growth in the region as a whole (73%). In addition, Hindu populations are anticipated to grow substantially in the coming decades in Europe (93%) and the Asia-Pacific region (34%). The growth of Hindus in Europe stands out against the backdrop of overall decline in Europe’s population, which is projected to be 6% smaller in 2050 than it was in 2010.

Change in Countries With Largest Hindu Populations

Projected Population Change in Countries With Largest Hindu Populations in 2010

For the most part, each of the 10 countries with the largest Hindu populations is projected to have roughly the same percentage of Hindus (as a share of its total population) in 2050 as it did in 2010. For example, Hindus are anticipated to make up about 77% of India’s population in 2050, down slightly from 80% in 2010.

These 10 countries also are expected to account for about the same share of the world’s total population in 2050 as they did in 2010. For example, about 18% of the world’s inhabitants lived in India in 2010, and 18% are projected to live in India in 2050. Consequently, the share of the world’s population that is Hindu also is projected to stay about the same (15%).

Demographically, as well as culturally and historically, Hinduism is deeply rooted in India, where more than nine-in-ten of the world’s Hindus (94%) lived in 2010. India remains a majority-Hindu country, with about 80% of India’s population in 2010 claiming Hindu identity.

As of 2010, more than 99% of all Hindus lived in the 10 countries with the largest numbers of Hindus. Outside of India, the countries with the largest Hindu populations in 2010 were Nepal (24.2 million, or 2% of the world’s Hindus) and Bangladesh (12.7 million, or 1% of the world’s Hindus). The only countries outside the Asia-Pacific region that ranked among the top 10 largest Hindu populations as of 2010 were the United States and the United Kingdom.

By 2050, the United States – with 4.8 million Hindus – is expected to have the world’s fifth-largest Hindu population. In addition, Canada, with a projected 1 million Hindus in 2050, is forecast to join the list of countries with the 10 largest Hindu populations.

As in 2010, India will top that list, followed by Nepal and Bangladesh.

10 Countries With the Largest Hindu Populations, 2010 and 2050


Demographic Characteristics of Hindus That Will Shape Their Future

Fertility

Total Fertility Rates of Hindus by Region, 2010-2015

With a Total Fertility Rate (TFR) of 2.4 children per woman, Hindus have about the same fertility levels as the world’s overall population (2.5) in the 2010-2015 period. Global fertility among Hindus is above the replacement level of 2.1 children per woman (the number considered necessary to maintain a stable population, all else being equal).

Hindu fertility rates are highest in the Asia-Pacific region (2.4) and lowest in Europe (1.5).

Between 2040 and 2050, the global Hindu TFR is expected to drop to 1.8, which is below the replacement level and will slow the growth of the Hindu population. This trend reflects United Nations expectations about future fertility patterns in India, where most Hindus reside. Hindus are younger, on average, than the global population, so the aging of the Hindu population combined with increases in life expectancy will permit the population to increase in number even with below-replacement fertility.

Hindu fertility rates during the 2010-2015 period are 3.2 in Pakistan, 2.6 in Nepal and 2.5 in India. In many countries, Hindu fertility is below the 2.1 replacement level, including Australia (1.7), Indonesia (1.6), the United Kingdom (1.5) and South Africa (1.5).

Total Fertility Rates of Hindus, by Country

Age Structure

Age Distribution, 2010

Globally, Hindus were slightly younger (median age of 26) than the world’s population overall (median age of 28) as of 2010. The percentage of Hindus under the age of 30 (57%) also was slightly above the global figure (53%).

In the Asia-Pacific region, Hindus also tended to be slightly younger (median age of 26) than the region’s overall population (median age of 29). Mostly owing to a high number of relatively young immigrants, Hindus in Europe (median age of 34) and North America (median age of 30) were considerably younger than the general populations in those regions as of 2010.

Age Distribution of Hindus by Region, 2010


Religious Switching

Religious switching was not modeled in India, home to 94% of Hindus in 2010, because reliable data on patterns of religious switching in India are not available. At the global and regional level, religious switching therefore makes little difference in the growth projections for Hindus.

Migration

Projected Scenarios for Hindus With and Without Migration, 2050

Nearly 1 million Hindus are expected to move to a different region between 2010 and 2015. Most Hindu migrants will come from the Asia-Pacific region, primarily from India and Nepal. About 400,000 Hindus from Asia and the Pacific are forecast to move to the Middle East-North Africa region, while smaller numbers are expected to move to North America (220,000), Europe (90,000) and sub-Saharan Africa (10,000) between 2010 and 2015. Roughly 200,000 Hindus are forecast to move from the Middle East-North Africa region to the Asia-Pacific region; many of them are returning to Asia after working in the oil-rich Persian Gulf countries. These migration patterns are projected to continue in the decades ahead. (See the Methodology on page 166 for more information on how migration flows were estimated.)

When migration is factored into the projection models, Hindus are expected to make up more than 1% of North America’s population in 2050; without migration, the figure would remain below 1%. Similarly, when migration is taken into account, the expected Hindu shares of the populations in Europe and the Middle East-North Africa region in 2050 are roughly double what they would be without migration.

Hindu Migration, 2010-2015

Buddhists

The number of Buddhists around the world is expected to increase between 2010 and 2030, rising from 488 million to about 511 million. However, the global Buddhist population is projected to decline after 2030, falling to 486 million by 2050, roughly where it was in 2010.45

Projected Compound Annual Growth Rates for Buddhists Between Five-Year Periods

During the same period, the world’s population is expected to increase considerably. As a result, the percentage of the world’s population that is Buddhist is forecast to decrease from about 7% in 2010 to 5% in 2050.

The projected decline in the share of the world’s population that is Buddhist is a result of Buddhists’ aging population and low fertility rate relative to other religious groups.

The annual growth rate of the world’s population is expected to decline gradually in the coming decades, falling from 1.1% in 2010-2015 to 0.4% between 2045 and 2050. The annual growth rate of Buddhists also is expected to decline. The Buddhist growth rate is 0.5% in 2010-2015. After 2030, the growth rate of the global Buddhist population is forecast to enter negative territory, ending with a negative rate of growth in 2045-2050 of minus 0.4%. This represents a projected decline in the Buddhist population after 2030.

Regional Change

Change in Regional Distribution of Buddhists, 2010 vs. 2050

Buddhists are expected to remain very heavily concentrated in the Asia-Pacific region, where 99% of Buddhists lived in 2010 and a similarly high proportion (98%) are projected to reside in 2050. The share of the world’s Buddhist population living in North America is expected to grow from about 0.8% in 2010 to 1.2% in 2050. Europe and the Middle East-North Africa region also are expected to see very slight increases in their shares of the global Buddhist population.

PF_15.04.0World Buddhist Population by Region, 2010 and 20502_ProjectionsTables103b

Although the Asia-Pacific region will remain home to the overwhelming majority of Buddhists in the coming decades, the Buddhist population in the region is projected to decline, both in absolute number and as a share of the overall population in Asia and the Pacific. In 2010, Buddhists made up about 12% of the region’s population. By 2050, Buddhists are projected to make up about 10% of the region’s inhabitants. Over the same period, the number of Buddhists in the region is expected to drop from 481 million to about 476 million.

Buddhist Population Growth Compared With Overall Growth in Each Region, 2010 to 2050

In all other regions, Buddhist populations are projected to increase in absolute number. In North America, for example, the Buddhist population is projected to grow by more than 2 million, from 3.9 million in 2010 (or 1.1 % of North America’s population) to nearly 6.1 million in 2050 (1.4% of North America’s population). At the same time, the Buddhist populations in Europe and the Middle East-North Africa region are expected roughly to double. Europe’s Buddhist population is anticipated to be 2.5 million in 2050 (or 0.4% of Europe’s total population), while Buddhists in the Middle East and North Africa are forecast to number 1.2 million (0.2% of the region’s population). Buddhist populations in Latin America and the Caribbean as well as sub-Saharan Africa are expected to remain relatively small.

Between 2010 and 2050, the most rapid Buddhist population growth, in percentage terms, is projected to occur in the Middle East and North Africa. Driven largely by immigration, the region’s Buddhist population is expected to more than double in size (growing by 137%), while the region’s overall population is expected to increase by 73%. The second-fastest growth among Buddhists is anticipated in Europe (85%), where, by contrast, the overall population is expected to decline between 2010 and 2050. The Buddhist population also is projected to grow at a faster rate than the overall population in North America (58% vs. 26%).

In the Asia-Pacific region, the number of Buddhists is expected to decline slightly between 2010 and 2050, while the region’s overall population is expected to grow by 22%.

Change in Countries With Largest Buddhist Populations

Projected Population Change in Countries With Largest Buddhist Populations in 2010

Most of the countries with the largest numbers of Buddhists as of 2010 are expected to see their overall populations decline as a share of the world’s population. Collectively, these countries held 44% of the world’s population in 2010. By 2050, their share of the global population is expected to decline to 37%. China is expected to go from having nearly 20% of the world’s population in 2010 to 14% in 2050.

The proportion of China’s population that is Buddhist is expected to remain around 18% between 2010 and 2050. But in many other countries with large Buddhist populations, the Buddhist share of the population is expected to decline in the decades ahead, because Buddhists tend to be older and have fewer children than non-Buddhists.46 In Japan, for example, the Buddhist share of the population is forecast to drop by more than 10 percentage points, from 36% in 2010 to 25% in 2050.

By a wide margin, China, with a Buddhist population of 244 million, had the most Buddhists living within its borders in 2010. In fact, about half of the world’s Buddhists in 2010 lived in China, though only about one-in-five Chinese people (18%) were Buddhist.

The 10 countries with the most Buddhists in 2010 – home to a combined 94% of the world’s Buddhists – were all in Asia, including Thailand (64 million), Japan (46 million), Burma (38 million) and Sri Lanka (14 million).

As was the case in 2010, the overwhelming majority of Buddhists in 2050 will be found in the 10 countries with the largest Buddhist populations (93%). China and Thailand are expected to remain atop the list. Burma (Myanmar) is projected to have the third-largest Buddhist population in 2050 (45 million), surpassing Japan (27 million). Due in part to projected immigration, the United States is expected to go from having the 13th-largest Buddhist population in 2010 to the 10th-largest in 2050, when it is projected to be home to 5.5 million Buddhists.

10 Countries With the Largest Buddhist Populations, 2010 and 2050


Demographic Characteristics of Buddhists That Will Shape Their Future

Fertility

Total Fertility Rates of Buddhists by Region, 2010-2015

With a Total Fertility Rate (TFR) of 1.6 children per woman, Buddhists have considerably lower fertility levels than the world’s overall population in the 2010-2015 period. Indeed, the TFR for Buddhists is below the replacement level of 2.1 children per woman (the number considered necessary to maintain a stable population, all else being equal).

In the Asia-Pacific region, where most Buddhists live, the TFR for Buddhists is 1.6, compared with 2.1 for the region overall.

The countries with the highest Buddhist fertility in the 2010-2015 period (Cambodia, Mongolia and Peru) have fertility rates that are only slightly lower (2.4 children per woman) than the global average (2.5). However, Buddhist fertility is very low in such countries as South Korea (1.4), the United Kingdom (1.4), Japan (1.3) and Brazil (1.1).

By 2050, the fertility rate among Buddhists is expected to rise in some countries, but it will not have reached the replacement level worldwide.

Total Fertility Rates of Buddhists, by Country

Age Structure

Age Distribution, 2010

Globally, Buddhists were older (median age of 34) than the overall population (median age of 28) as of 2010, and more than half of Buddhists were ages 30 and older. (For more on age structure’s role in these projections, see Chapter 1.)

In the Asia-Pacific region, the median age of Buddhists in 2010 (34) was five years older than the median age of the population overall (29). By contrast, Buddhists in North America (median age of 30) are considerably younger than North America’s general population (37) as of 2010. This is largely due to a high number of young Buddhist immigrants and their children living in North America.

Age Distribution of Buddhists by Region, 2010

Religious Switching

Religious switching was not modeled in China – home to about half of the world’s Buddhists in 2010 – because reliable data on patterns of religious switching in China were not available. (See this sidebar for more details.)

North America is the only region where sufficient data were available to project rates of religious switching into and out of Buddhism. In this region, the Buddhist population experiences a net loss of members when religious switching is taken into account. Consequently, the projected number of Buddhists in North America in 2050 (6.1 million) is slightly lower than it would be if religious switching were not factored into the projections (6.7 million).

The limited data available on religious switching among Buddhists were factored into the main projection scenario for this report. In an alternative scenario, no religious switching was modeled in any country. A comparison of the two scenarios finds that at the global level, religious switching makes little difference in the growth projections for Buddhists.

Migration

Projected Scenarios for Buddhists With and Without Migration, 2050

About half a million Buddhists are expected to move from one region to another between 2010 and 2015. Most are expected to come from the Asia-Pacific region, where the vast majority of Buddhists reside. The primary destinations of these migrants are the Middle East-North Africa region (160,000 migrants), North America (150,000) and Europe (110,000). A small number of Buddhists (60,000) are forecast to move to the Asia-Pacific region from the Middle East and North Africa; many of them are returning after working in the oil-rich Persian Gulf countries. These migration patterns are projected to continue in the decades ahead. (See the Methodology for more information on how migration flows were estimated.)

The impact of migration on Buddhist populations in different regions can be seen by comparing results from the main projection scenario, which includes expected migration patterns from 2010 to 2050, with an alternative scenario that does not attempt to take migration into account.

Buddhists are expected to make up about 1.4% of North America’s population in 2050. In an alternate scenario that does not take migration into account, the Buddhist share of the region’s population is forecast to be slightly smaller (1.2%). Similarly, when migration is taken into account, the expected share of Europe’s population that is Buddhist – while still very small – is twice as large as in the alternate scenario that does not include migration (0.4% vs. 0.2%).

Buddhist Migration, 2010-2015


Adherents of Folk Religions

An estimated 405 million people – or about 6% of the world’s population – were adherents of folk or traditional religions in 2010, and that number is expected to grow to 450 million by 2050. This increase will not keep pace with overall population growth, however, and the folk religion population is expected to drop to roughly 5% of the total world population in the decades ahead.

Projected Compound Annual Growth Rates for Folk Religions Between Five-Year Periods

Folk or traditional religions are faiths closely associated with a particular group of people, ethnicity or tribe. They often have no formal creeds or sacred texts. Examples of folk religions include African traditional religions, Chinese folk religions, Native American religions and Australian aboriginal religions.

Folk religions are challenging to measure. Less institutionalized and more diffuse than many other faiths, folk religions often are omitted as a category in surveys even in countries where they are widely practiced. For example, though folk religions are pervasive in China, they typically do not appear in surveys in China because they are not among the five religions officially recognized by the government. By necessity, the Pew Research Center’s estimate of the number of adherents of folk religions in China has relied instead on survey questions about worship of gods or spirits associated with Chinese folk religions. (See Methodology.)

[folk]

Amid these uncertainties, the folk religion population is expected to grow at a slower rate than the overall population in the coming decades. In the 2010-2015 period, the expected annual growth rate of the folk religion population is 0.7%, compared with 1.1% for the general population. Both the overall world population and the folk religion population are expected to experience a decline in growth rates in coming decades. The growth rate for followers of folk religions is expected to turn negative starting in 2040, representing not just slower growth but actual decline in the population.

Regional Change

Change in Regional Distribution of Folk Religions, 2010 vs. 2050

As of 2010, adherents of folk religions were most prevalent in the Asia-Pacific region, where nine-in-ten (90%) members of the world’s folk religion population resided. The remaining followers of folk religions were concentrated in sub-Saharan Africa (7%) and Latin America and the Caribbean (between 2% and 3%).

In the decades ahead, the share of the world’s folk religion population living in the Asia-Pacific region is expected to decline somewhat, to 82% by 2050, while the shares living in sub-Saharan Africa and the Latin America-Caribbean region are expected to increase (to 14% and more than 3%, respectively).

World Folk Religion Population by Region, 2010 and 2050

In the coming decades, adherents of folk and traditional religions are expected to increase in absolute number in every region of the world. In Asia and the Pacific, for example, the folk religion population is expected to grow by a few million, reaching 367 million in 2050. However, the share of the Asia-Pacific region’s population that follows folk religions is projected to decrease from 9% to 7% during this period. Similarly, though the folk religion population in sub-Saharan Africa is expected to double in size to more than 60 million by 2050, adherents of folk religions are expected to remain about the same as a share of the region’s population (slightly more than 3%).

Folk Religion Growth Compared With Overall Growth in Each Region, 2010 to 2050

In future decades, there are expected to be a few million more followers of folk religions in Latin America and the Caribbean (14 million in 2050 vs. 10 million in 2010).

Between 2010 and 2050, North America’s folk religion population is projected to experience a high rate of growth (158%), due to a combination of immigration, religious switching and the relatively small base folk religion population in 2010. The second-fastest growth among followers of folk religions is anticipated in sub-Saharan Africa, where the rate of growth among the folk religion population (128%) is projected to be similar to the region’s overall rate of growth (131%).

In future decades, the folk religion population in Latin America and the Caribbean is expected to grow somewhat more (43%) than the region overall (27%). By contrast, the folk religion population in Asia and the Pacific, in percentage terms, is expected to be relatively flat (1% growth), while the region’s population overall is forecast to experience modest growth (22%).

Change in Countries With Largest Folk Religion Populations

Projected Population Change in Countries With Largest Folk Religion Populations in 2010

Adherents of folk religions are not heavily concentrated in countries that are expected to experience large population growth between 2010 and 2050.

China, home to the largest folk religion population, is expected to have 14% of the world’s population in 2050, down from 20% in 2010.

Among the 10 countries with the most adherents of folk religions in 2010, only Nigeria and Brazil are expected to see sizable increases in the shares of their populations belonging to folk and traditional religions. In each of the other countries on this list, the share of the population following folk religions is expected to stay about the same or decrease slightly. For example, the share of China’s population that belongs to folk or traditional religions is expected to remain at about 22% in the decades ahead.

China was home to a majority (73%) of the world’s folk religion population in 2010, with nearly 300 million adherents of folk religions living there. Sizable folk religion populations also lived in Vietnam (40 million), Taiwan (10 million), India (6 million) and Brazil (between 5 million and 6 million) in 2010.

No country had a clear majority of its population practicing folk religions as of 2010.1 However, more than 40% of people in Vietnam (45%) and Taiwan (44%) were followers of folk religions.

In 2050, as was the case in 2010, China is expected to have a majority of the world’s folk religion population (63%), although a smaller majority than it had in 2010 (73%). Vietnam is expected to remain the country with the second-largest folk religion population, with 46 million (about 10% of the world’s total).

By 2050, Brazil is forecast to have the world’s third-largest folk religion population (9 million), surpassing Taiwan and India. Two countries in sub-Saharan Africa – Ivory Coast and Togo – are expected to join the list of countries with the 10 largest folk religion populations by 2050.

10 Countries With the Largest Folk Religion Populations, 2010 and 2050


Demographic Characteristics of Adherents of Folk Religions That Will Shape Their Future

Fertility

With a Total Fertility Rate (TFR) of 1.8 children per woman, followers of folk religions have lower fertility levels than the world’s overall population (2.5) from 2010-2015. In fact, the TFR of the folk religion population is below the replacement level of 2.1 children per woman (the number considered necessary to maintain a stable population, all else being equal).

Data on the fertility of adherents of folk and traditional religions is not easy to gather on a regional basis, primarily because of the many different religious groups that make up the category. Nonetheless, there are some notable fertility differences in a few regions. In sub-Saharan Africa, for example, the TFR for the folk religion population in the 2010-2015 period is higher than the rate for the region overall (5.1 vs. 4.8). By contrast, the TFR of the folk religion population in Latin America and the Caribbean is substantially lower (1.4) than the rate for the region’s total population (2.2).

Fertility rates for adherents of folk religions are highest in sub-Saharan Africa, where Total Fertility Rates for the 2010-2015 period range from 7.5 in Mali and 7.0 in Nigeria to 3.2 in South Africa and 4.7 in Zimbabwe. Outside of sub-Saharan Africa, fertility rates vary from 3.8 in Laos and 2.7 in India to 1.0 in Brazil and 1.2 in Chile.

Total Fertility Rates of Adherents of Folk Religions, by Country

Age Structure

Age Distribution, 2010

Globally, followers of folk religions were older as of 2010 (median age of 33) than the world’s overall population (28). In the Asia-Pacific region, where most adherents of folk religions live, the group’s median age (34) was five years older than the median age of the region as a whole (29).

In Latin America and the Caribbean, the median age of the folk religion population (35) was eight years older than the regional median (27). In sub-Saharan Africa, however, the median age of adherents of folk religions was the same as that of the general population (18).

Age Distribution of Folk Religions by Region, 2010


Religious Switching

Projected Scenarios for Adherents of Folk Religions With and Without Religious Switching, 2050

In the main projection scenario described in this report, religious switching is factored into the population projections for all 70 countries for which sufficient data are available. In an alternative scenario, however, no religious switching was modeled in any country. Comparing results between these two scenarios gives a sense of how much impact religious switching is expected to have on the size of the folk religion population in the years to come.

In some regions, including Latin America and the Caribbean, a greater number of people are projected to become followers of folk religions in future decades than are expected to leave folk religions for other religions or no religious affiliation. This net increase in people identifying with folk religions is expected to make the percentage of people in the Latin America-Caribbean region adhering to folk religions higher than it otherwise would be (1.9% of the 2050 population with switching vs. 1.3% without switching). The impact of religious switching is expected to be particularly strong in Brazil, where the Spiritist movement is growing.2 By 2050, if religious switching is factored into the projections, Brazil is expected to have 9 million adherents of folk religions; if religious switching is not included in the projection model, the number drops to 4 million.

In North America, a slightly higher percentage of the population in 2050 is expected to follow folk religions if religious switching is taken into account (0.6% with religious switching vs. 0.4% without religious switching).3

Migration

With a relatively small folk religion population worldwide, and an even smaller number of migrants who belong to folk religions, migration is not expected to significantly alter the number of adherents of folk religions in various regions of the world.

Folk Religion Migration, 2010-2015

Other Religions

In 2010, 0.8% of the world’s population belonged to religious groups not classified elsewhere in this report. By 2050, adherents of other religions are expected to decline slightly as a share of the world’s population (to 0.7%).

This “other religions” category includes followers of religions that are not specifically measured in surveys and censuses in most countries: the Baha’i faith, Taoism, Jainism, Shintoism, Sikhism, Tenrikyo, Wicca, Zoroastrianism and many others. Because of the scarcity of census and survey data, the Pew Research Center has not estimated the size of individual religions within this category, though some estimates from other sources are provided in the sidebar below. As a whole, this group is expected to grow from about 58 million in 2010 to more than 61 million in 2050.

Spotlight on Other Religions

The “other religions” category is diverse and comprises all groups not classified elsewhere. It includes followers of religions that are not specifically measured in most censuses and surveys, including (but not limited to) the faiths listed below. Recent estimates of population sizes for these groups generally come from sources other than censuses and nationally representative surveys.

Baha’i faith

The Baha’i faith began in Persia (now Iran) in the 19th century. Baha’is are widely dispersed across many countries, with significant populations in India, the United States, Kenya and elsewhere. The Baha’i International Community reported more than 5 million adherents in 2010.

Jainism

Jainism originated in India and dates back to at least the 6th century B.C.E. Today, the vast majority of Jains live in India, though significant numbers also are found among Indian immigrant communities in Kenya, the United States, Canada and the United Kingdom. The 2001 Indian census enumerated more than 4 million Jains in India, but some Jains have contended that number is a substantial undercount. According to estimates by the World Religion Database, there are about 250,000 Jains outside India.

Shintoism

Shintoism is a Japanese faith that has been part of religious life in Japan for many centuries. Although Shinto rituals are widely practiced in Japan, only a minority of the Japanese population identifies with Shintoism in surveys. The World Religion Database estimates there are almost 3 million Shintoists worldwide, with the vast majority concentrated in Japan.

Sikhism

Sikhism was founded at the turn of the 16th century by Guru Nanak in the Punjab, a region now split between India and Pakistan. More than nine-in-ten Sikhs are in India, but there are also sizable Sikh communities in the United Kingdom, the United States and Canada. The World Religion Database estimates there are a total of about 25 million Sikhs worldwide.

Taoism

Taoism (also known as Daoism) traditionally is said to have been founded in the 6th century B.C.E. by Chinese philosopher Lao Tzu. Adherents live predominantly in China and Taiwan. The World Religion Database estimates there are about 8.7 million Taoists.

Tenrikyo

Tenrikyo was founded in the 19th century by Nakayama Miki in Japan. The faith is one of many new Japanese religions; others include Shinreikyo, Mahakari, Omoto and PL Kyodan. Reliable estimates of the number of followers of Tenrikyo and other new Japanese religions are not available.

Wicca

Wicca is a Pagan or neo-Pagan religion that gained popularity in the 20th century. It is practiced mostly in the United Kingdom and the United States. Reliable estimates of the number of Wiccans around the world are not available.

Zoroastrianism

Zoroastrianism traditionally is said to have been founded by Zarathustra in Persia (now Iran) sometime before the 6th century B.C.E. Adherents live mainly in India and Iran. The World Religion Database estimates there are about 200,000 Zoroastrians worldwide.

Others

Other faiths in this category include Cao Dai, I-Kuan Tao, Mandaeism, the Rastafari movement, the Rtana movement, Scientology and Yazidism, to list just a few.

Projected Compound Annual Growth Rates for Other Religions Between Five-Year Periods

The “other religions” population is expected to grow at a slower rate than the general population in the decades ahead. In 2010-2015, for example, the growth rate for members of other religions is 0.5%, compared with 1.1% for the world’s population overall. By 2040-2045, adherents of other religions are projected to start declining in size (negative growth).

Regional Change

Members of other religions are expected to remain heavily concentrated in the Asia-Pacific region, where 89% resided in 2010 and 79% are projected to reside in 2050. North America’s share of the world’s “other religions” population is expected to grow from nearly 4% in 2010 to 11% in 2050. The share of the “other religions” population living in sub-Saharan Africa also is expected to increase (from 3% to 6%).

Change in Regional Distribution of Other Religions, 2010 vs. 2050

In the coming decades, the number of adherents of other religions is expected to decrease in the Asia-Pacific region, while the population belonging to other religions in each other region of the world is projected to grow.

Other Religions Population by Region, 2010 and 2050

In 2010, nearly 52 million people in the Asia-Pacific region belonged to other religions. By 2050, this number is expected to decrease to 49 million. As the absolute number of people adhering to other religions drops in the region, the share of the Asia-Pacific population belonging to other religions also will drop.

Meanwhile, the “other religions” population is projected to triple in size in North America, from 2.2 million (0.6% of the population) in 2010 to 6.6 million (1.5% of the population) in 2050, due largely to switching into other religions (such as Wicca and pagan religions) in the United States.

In sub-Saharan Africa, the number of adherents of other religions is expected to nearly double, rising to nearly 4 million people by 2050.

Other Religions Population Growth Compared With Overall Growth in Each Region, 2010 to 2050

Between 2010 and 2050, the most rapid growth of the “other religions” population, in percentage terms, is projected to occur in North America (197%), which is more than seven times the expected increase in the region’s overall population (26%).

In Europe, the “other religions” population is expected to increase 23% between 2010 and 2050, even though Europe’s population as a whole will decrease in size (minus 6% growth).

Meanwhile, it is projected that the “other religions” population will decrease (minus 6% growth) in the Asia-Pacific region, while the region as a whole will grow 22% between 2010 and 2050.

Change in Countries With Largest Populations Belonging to Other Religions

Projected Population Change in Countries with Largest Other Religions Populations in 2010

Six of the 10 countries with the largest “other religions” populations are expected to decline as a share of the world’s population between 2010 and 2050. China is expected to have 14% of the world’s population in 2050, a drop from nearly 20% in 2010. Japan’s population also is anticipated to make up a smaller share of the world’s population in 2050 than in 2010 (1.2% vs. 1.8%).

India is among the exceptions: The share of the world population living in India is projected to rise slightly between 2010 and 2050, remaining around 18%. But the percentage of India’s population that is in the “other religions” category is expected to decline from 2.3% in 2010 to 1.5% in 2050. The shares of the populations in Japan, Taiwan and Singapore belonging to other religions also are projected to decline in the coming decades.

Nearly half (47%) of the world’s adherents of other religions, mostly Sikhs and Jains, lived in India in 2010. Outside of India, the largest shares of people belonging to faiths in the “other religions” category were in China (16%), Japan (10%), Taiwan (7%), North Korea (5%) and the United States (3%).

With 26 million people (or about 42% of the world’s “other religions” population), India will remain home to the largest number of adherents of other religions in 2050.

Significant populations belonging to other religions are expected to remain in Asian countries in 2050, including China (9.3 million), Japan (4.2 million), North Korea (3.4 million) and Taiwan (2.7 million).

The United States is projected to hold the third-largest population of people belonging to other religions in 2050 (5.8 million), rising from the sixth-largest in 2010. About one-in-ten of the world’s adherents of other religions (9%) will live in the United States in 2050, according to the projections, and neighboring Canada is expected to join the list of countries with the 10 largest “other religions” populations come 2050.

10 Countries With the Largest Other Religions Populations, 2010 and 2050

Demographic Characteristics of Adherents of Other Religions That Will Shape Their Future

Fertility

With a Total Fertility Rate (TFR) of 1.7 children per woman, adherents of other religions have, on average, fewer children than the world population overall (2.5) between 2010 and 2015. This means that global fertility among members of other religions is below the replacement level of 2.1 children per woman (the number considered necessary to maintain a stable population, all else being equal).

Adherents of other religions in the Asia-Pacific region also have lower fertility (TFR of 1.6) compared with the region’s overall population (2.1).52

Countries where “other religions” populations have fertility rates above replacement level in the 2010-2015 period include Belize (3.0) and Peru (2.4). Fertility for this population is at replacement level in Canada (2.1) and the U.S. (2.1). In the remaining countries with reliable data, fertility rates for those in the “other religions” category are below replacement level.

Total Fertility Rates of Adherents of Other Religions, by Country

Age Structure

Age Distribution, 2010

People belonging to other religions in 2010 were older (median age of 32) than the overall global population (median age of 28). While 27% of the world’s population was under 15 in 2010, only 21% of the “other religions” population was under 15.53

Religious Switching

Religious switching was not modeled in most countries with a large number of people in the “other religions” category. Consequently, religious switching does not significantly influence global population projections for this group.

Data are available on switching in and out of other religions in the United States, however. In fact, religious switching explains almost all of the expected growth in the number of adherents of other religions in the U.S.54 Specifically, when religious switching is taken into account, about 1.5% of the U.S. population is expected to belong to other religions in 2050. Without religious switching, members of other religions would make up only 0.6% of the U.S. population in 2050, the same share belonging to other religions in the U.S. in 2010 (0.6%).

Migration

For most regions, migration is not expected to have a substantial impact on the growth of the “other religions” population. Europe is expected to experience modest growth in this category due to migration from Asia and the Pacific and sub-Saharan Africa.

Jews

As of 2010, there were nearly 14 million Jews around the world. In 2050, the Jewish population is expected to number about 16 million. The share of the world’s population that is Jewish – 0.2% – is expected to remain about the same in 2050 as it was in 2010.

Projected Compound Annual Growth Rates for Jews Between Five-Year Periods

Over the next few decades, Israel is projected to pass the United States and become, by a sizable margin, the country with the largest Jewish population.

These projections are based on estimates of people who self-identify as Jewish when asked about their religion on national censuses and large-scale surveys. They do not include so-called “cultural” or “ethnic” Jews – people who have direct Jewish ancestry and who consider themselves at least partially Jewish but who describe themselves, religiously, as atheist, agnostic or nothing in particular. For the purposes of the religious group projections in this report, these people are categorized as unaffiliated. The worldwide estimate of Jews could be larger if this group were included, or smaller if a narrower definition of who is Jewish (such as an unbroken line of matrilineal Jewish descent) were used.55

This analysis looks at Jews as one religious group and does not estimate changes in the size of specific branches of Judaism.56

In the decades ahead, the annual growth rate of the Jewish population is expected to remain lower than the growth rate for the general world population.

Regional Change

Change in Regional Distribution of Jews, 2010 vs. 2050

Jews were largely concentrated in North America (44%) and the Middle East-North Africa region (41%) in 2010. Most of the remainder of the global Jewish population was found in Europe (10%) and the Latin America-Caribbean region (3%).

In 2050, a majority of the world’s Jews (51%) are expected to live in the Middle East and North Africa (mostly Israel), while more than a third (37%) will live in North America. The share of the global Jewish population living in Europe is projected to decline to less than 8% by 2050.

World Jewish Population by Region, 2010 and 2050

In the coming decades, Jews are not expected to increase as a share of the population in any region of the world. In the Middle East-North Africa region, for example, about 1.6% of the population identified as Jewish in 2010; 1.4% of the region’s 2050 population is expected to be Jewish. Although the Jewish share of the Middle East and North Africa is projected to decline, the absolute number of Jews in the region is expected to rise from 5.6 million in 2010 to about 8.2 million in 2050.

In North America, the Jewish population is projected to decline both in total number (from 6 million in 2010 to 5.9 million in 2050) and as a share of the region’s population (from 1.8% in 2010 to 1.4% in 2050).

Jewish Population Growth Compared With Overall Growth in Each Region, 2010 to 2050

Between 2010 and 2050, the Jewish population is projected to grow in only two regions. The size of the Jewish population is expected to increase 46% in the Middle East-North Africa region, although this is less projected growth than the region’s population as a whole (73%). The small number of Jews in the Asia-Pacific region is projected to grow 21%, about on par with the region’s overall growth (22%).

In all other regions, the size of the Jewish population is projected to decrease. For example, the Jewish population in North America is expected to shrink in size (minus 2% growth) while the region’s population as a whole is expected to grow (26%). In Europe, the pace of population decline is expected to be more rapid for Jews (minus 15% growth between 2010 and 2050) than for Europe’s general population (minus 6%).

In sub-Saharan Africa, the relatively small Jewish population is projected to shrink from about 100,000 in 2010 to 70,000 in 2050. That minus 29% rate of growth is in stark contrast with sub-Saharan Africa overall, where the population is expected to grow 131% in the coming decades.

Change in Countries With Largest Jewish Populations

Projected Population Change in Countries With Largest Jewish Populations in 2010

The countries with large Jewish populations in 2010 are expected to experience slower population growth than the rest of the world in future decades. The 10 countries with the largest Jewish populations were home to about 14% of the world’s population in 2010; they are expected to hold less than 12% of the world’s people in 2050.

The United States and Israel had similarly sized Jewish populations in 2010 (5.7 million Jews in the U.S., 5.6 million in Israel). Other countries with a considerable number of Jews as of 2010 included Canada (350,000), France (310,000) and the United Kingdom (290,000).

Nearly 95% of all Jews in the world lived in the countries with the 10 largest Jewish populations. Only Israel had a majority-Jewish population, with about three-quarters of its population (76%) identifying as Jewish in 2010. In the other nine countries on this list, about 2% or less of each nation’s people were Jewish as of 2010.

By 2050, Israel’s Jewish population (8.1 million) is expected to be significantly larger than the U.S. Jewish population (5.4 million). Between 2010 and 2050, Israel’s Jewish population is expected to grow by about 2.5 million people while the U.S. Jewish population declines by about 330,000.

As the number of Jews in Israel increases, so will Israel’s share of the world’s Jews. By 2050, more than half of the world’s Jews (51%) are expected to live in Israel. In 2010, about 41% of Jews lived in Israel. Meanwhile, about a third of the world’s Jews (33%) will live in the United States at mid-century, down from 41% in 2010.

While the Jewish population in the U.S. shrinks, some other minority religious groups in the U.S. are projected to grow in size, largely due to immigration. As a result, Judaism is no longer expected to be the most common non-Christian religion in the U.S.; people who identify with the Jewish faith are expected to be fewer in number than Muslims in the U.S. by 2050.

10 Countries With the Largest Jewish Populations, 2010 and 2050


Demographic Characteristics of Jews That Will Shape Their Future

Fertility

Total Fertility Rates of Jews by Region, 2010-2015

The Total Fertility Rate (TFR) of Jews from 2010-2015 (2.3 children per woman) is above replacement level (2.1, or the number typically considered necessary to maintain a stable population, all else being equal). It is relatively high in the Middle East and North Africa (2.8) and relatively low in Europe (1.8) and North America (2.0).

In the Middle East-North Africa region, Jewish fertility is slightly lower than fertility for the regional population overall. In North America, Jews have about the same fertility rate as the general population, while in Europe, Jews have a slightly higher fertility rate than Europeans overall.

Jewish fertility is highest in Israel, with a Total Fertility Rate of 2.8 in the 2010-2015 period, but it is below replacement level in the United States (1.9).

Total Fertility Rates of Jews, by Country

Age Structure

Age Distribution, 2010

Globally, Jews were considerably older (median age of 37) than the world’s population (median age of 28) as of 2010. Indeed, about four-in-ten Jews (39%) were ages 45 and older, while roughly a quarter (26%) of the world’s people were at least 45.

In each region where detailed age information for Jews is available, Jews were older than the regions’ overall populations in 2010. For example, in the Middle East-North Africa region, Jews had an older median age (32) than the regional median (24). North America had the smallest gap between Jews and the population as a whole; North America’s median age was 37 as of 2010, compared with 41 for Jews living in North America.

Age Distribution of Jews by Region, 2010

Religious Switching

Religious switching was not modeled in Israel, home to 41% of Jews in 2010, because reliable data on patterns of religious switching in Israel were not available. However, data for religious switching among Jews in the United States are available, showing that more people are switching out of Judaism (as a religion) than are switching in.57 With religious switching included in the projection model, the Jewish share of the population in North America is expected to be 1.4% in 2050. In an alternate scenario in which switching is not included, the Jewish share of the region would be slightly higher (1.5%) in 2050.

Migration

For decades, migration from countries throughout the world has been a major contributor to the growing population of Jews in Israel. Similarly, decades of Jewish migration from Europe to the United States and Canada has been an important factor in the growth of the Jewish population in North America.

However, Jewish migration has decreased significantly in recent years, including to Israel and North America. Because the population projections in this report use migration data from the most recent decade as a guide for forecasting the future, migration is not expected to have a large impact on Jewish populations at the regional level in the coming decades, at least compared with its impact during the 20th century.

When migration is factored into the projection model, Jews are expected to make up a slightly smaller share of North America’s population (1.4%) than if the projections did not include migration (1.5%).

In the Middle East-North Africa region, the projection models with and without migration do not show a sizable difference in the share of the population that is Jewish (about 1.4% in 2050 in either scenario).

Chapter 3: Population Projections by Region

This chapter looks at the size and projected growth of the world’s major religious groups from 2010-2050 in six regions of the world. The regions are presented in alphabetical order: Asia and the Pacific, Europe, Latin America and the Caribbean, the Middle East and North Africa, North America and sub-Saharan Africa.
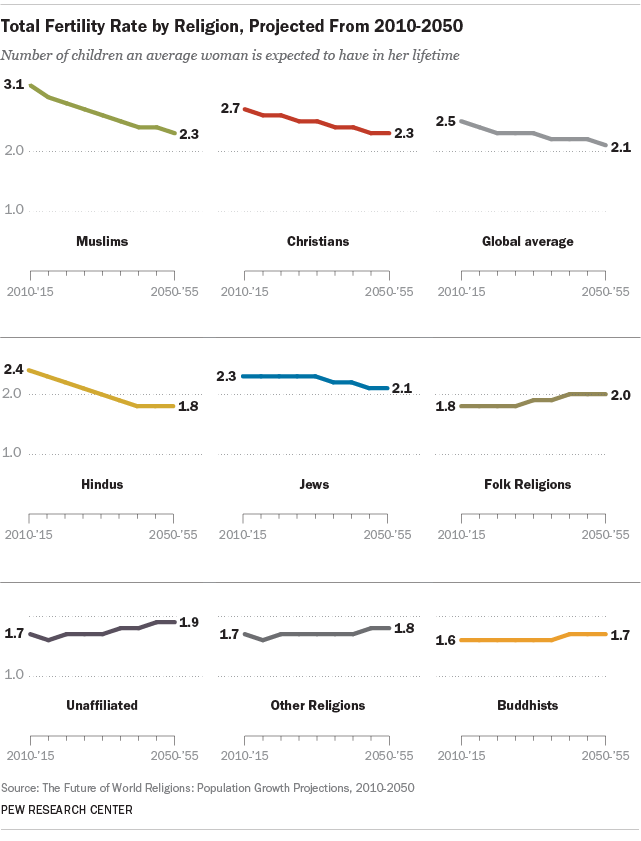
Each section begins with an overview of the projected changes in the size of religious groups in that region. Where appropriate, the sections highlight the situation in countries of special interest. The sections also examine the demographic factors that are influencing the growth of religious groups in various regions, including fertility, age structure, religious switching and migration. (For information on life expectancy by region, see Chapter 1.)

Asia-Pacific

Hindus were the largest religious group in the Asia-Pacific region as of 2010, with about 1 billion adherents. While the number of Hindus is expected to grow to nearly 1.4 billion by 2050, Muslims are projected to grow even faster and become the largest religious group in the region by mid-century. The Muslim population in Asia and the Pacific is expected to increase by almost 50% to nearly 1.5 billion in 2050.57

The number of people in the region who are religiously unaffiliated is expected to decrease between 2010 and 2050, falling from nearly 860 million to about 838 million. While the Asia-Pacific region will continue to be home to the vast majority of all Buddhists in the world, the number of Buddhists in the region also is projected to drop (from 481 million in 2010 to 476 million in 2050). Meanwhile, the Christian population in Asia and the Pacific is expected to grow by about 33%, rising from 287 million in 2010 to 381 million in 2050.

Size, Projected Growth of Major Religious Groups in Asia-Pacific, 2010-2050

Muslims are projected to make up nearly 30% of the region’s population in 2050, up from 24% in 2010. Hindus also are expected to increase as a share of the region’s population, rising from 25% in 2010 to nearly 28% in 2050. The Christian share of the population is expected to increase slightly, from just over 7% to nearly 8%. The growth of these religious groups can be traced mostly to their relatively young populations and high fertility rates.

By contrast, older populations and relatively low fertility rates are factors in why the share of the region’s population with no religious affiliation is projected to decline from 21% in 2010 to 17% in 2050. Similarly, the Buddhist share of the Asia-Pacific population is expected to drop from nearly 12% in 2010 to less than 10% in 2050. The proportion of the region’s population belonging to folk religions also is forecast to decline, from 9% in 2010 to about 7% in 2050.

Factors Driving Change

Fertility

Total Fertility Rates of Religious Groups in Asia- Pacific, 2010-2015

The Total Fertility Rate of Muslims in the Asia-Pacific region is 2.6 children per woman in the 2010 to 2015 period, considerably higher than the region’s overall fertility rate of 2.1 children. Fertility rates also were relatively high for Hindus (2.4) and Christians (2.3). By contrast, fertility rates for Buddhists (1.6), the religiously unaffiliated (1.6) and adherents of other religions (1.6) all were below the replacement level of approximately 2.1 children per woman.

Age Structure

Age Breakdown of Religious Groups in the Asia-Pacific, 2010

The groups projected to grow in population size in the Asia-Pacific region had relatively young populations in 2010. The median ages of Muslims (24), Hindus (26) and Christians (28) all were lower than the regional median age (29) and considerably younger than the median age of adherents of other religions (33) and folk religions (34), as well as Buddhists (34), the religiously unaffiliated (35) and Jews (36) in the region.

Religious Switching

The population projections in this report incorporate patterns in religious switching in 13 countries in the Asia-Pacific region for which there was reliable data on the number of people who say they no longer belong to the religious group in which they were raised. Reliable data on religious switching were unavailable for China and India, the most populous countries in the region. (For more details, see the Methodology.)

The size of religious groups in the Asia-Pacific region as a whole did not change appreciably whether or not switching was included in the projection models, which is why the data are not shown. (This does not mean that there were no discernible differences at the country level.)

Migration

In the decades ahead, more migrants are expected to move out of the Asia-Pacific region than move into it. This outbound movement is not anticipated to make a large difference in the overall religious composition of the region, however, given the large number of people in each of the major religious groups. Consequently, the report does not show different projection scenarios with and without migration for this region.

Europe

Europe is the only region projected to see a decline in its total population between 2010 and 2050. Although Christians will continue to be the largest religious group in the region, Europe’s Christian population is expected to drop by about 100 million people, falling from 553 million in 2010 to 454 million in 2050.58 Europe’s Jewish population also is expected to shrink, from 1.4 million in 2010 to 1.2 million in 2050. The remaining religious groups in Europe are projected to grow in number due to a combination of higher fertility, younger populations and net gains via migration and religious switching.

Europe’s Muslim population is projected to increase by 63%, growing from 43 million in 2010 to 71 million in 2050. The religiously unaffiliated population in Europe is expected to grow by about 16%, from 140 million in 2010 to 162 million in 2050. Hindus, Buddhists, members of folk religions and members of other religions in Europe are expected to experience large gains relative to their 2010 population size, but none of these groups is forecast to exceed 3 million people in 2050. In 2010, there were roughly equal counts of Jews, Hindus and Buddhists in the region (1.4 million each), but by 2050, the Jewish population (1.2 million) is expected to be about half the size of both the Hindu (2.7 million) and Buddhist (2.5 million) populations.

Size, Projected Growth of Major Religious Groups in Europe, 2010-2050

The decline in the size of Europe’s Christian population will result in Christians decreasing as a share of all Europeans (from 75% in 2010 to 65% in 2050). By contrast, the share of Europe’s population with no religious affiliation is projected to increase from 19% in 2010 to 23% in 2050, and the Muslim share of Europe’s population is expected to nearly double, from less than 6% in 2010 to more than 10% in 2050.

Factors Driving Change

Fertility

Total Fertility Rates of Religious Groups in Europe, 2010-2015

Europe’s Muslim population has higher fertility than other religious groups in the region. The Total Fertility Rate of Muslims in Europe is 2.1 children per woman in the 2010 to 2015 period. Other religious groups have fertility rates below replacement level, including Jews (1.8), Christians (1.6), Hindus (1.5) and the religiously unaffiliated (1.4). The low fertility rate in Europe as a whole (1.6) is largely responsible for the projected decline in the region’s total population.

Age Structure

Age Breakdown of Religious Groups in Europe, 2010

The religious groups projected to experience growth in Europe in the decades ahead tended to have younger populations in 2010 than the Christian majority. The median ages of Muslims (32), Hindus (34) and the religiously unaffiliated (37), for example, were younger than the regional median age (40) and the median age of Christians (42).

Religious Switching

Projected Religious Composition of Europe in 2050, With and Without Religious Switching

The religiously unaffiliated population in Europe is expected to grow because of high levels of religious switching, largely from Christianity. (For information on the impact of religious switching on the demographic projections, see Chapter 1.) Without religious switching, the unaffiliated share of the population would be expected to remain about the same in 2050 as it was in 2010 (19%). Taking into account projected patterns of religious switching, however, the unaffiliated share of Europe’s population is expected to increase to 23% by mid-century.

In a projection with no religious switching, the Christian share of Europe’s population would be forecast to decline from 75% in 2010 to 70% in 2050. Because of expected religious switching, however, the Christian share of the population is expected to decline even further, to 65% in 2050.

Migration

Projected Religious Composition of Europe in 2050, With and Without Migration

Migration is expected to alter the religious landscape of Europe in future decades. (For information on the impact of migration on the demographic projections, see Chapter 1.) In a projection with no migration, the Muslim share of Europe’s population would be expected to grow from 6% in 2010 to 8% in 2050. When expected migration is factored in, the Muslim share of the population forecast in 2050 rises to 10%.

As migration from Asia to Europe continues, Hindus, Buddhists and adherents of folk religions and other religions all are expected to increase slightly as a share of the European population. By contrast, migration is expected to decrease the share of the region’s population that is Christian or unaffiliated.

Latin America and the Caribbean

Christians are expected to remain the largest religious group in Latin America and the Caribbean in the decades ahead, growing by 25% from 531 million in 2010 to 666 million in 2050.59 The region’s unaffiliated population is forecast to have the largest percentage increase (44%), growing from 45 million in 2010 to 65 million in 2050. The number of adherents of folk religions is projected to grow by 43%, from 10 million to 14 million.

This analysis does not project the size of religious subgroups. But in many Latin American countries, there has been considerable movement from Catholicism to various Protestant groups and denominations in recent decades, and this movement is expected to continue in coming decades.60

Size and Projected Growth of Major Religious Groups in Latin America and Caribbean, 2010-2050

Factors Driving Change

Fertility

Total Fertility Rates of Religious Groups in Latin America and Caribbean, 2010-2015

The Total Fertility Rate of the religiously unaffiliated population in Latin America and the Caribbean is 2.3 children per woman in the 2010 to 2015 period, higher than the rate for any other religious group in the region. The relatively high fertility of the unaffiliated contributes to the group’s expected growth as a share of the region’s population. The fertility rate of Christians in the region is 2.2, equal to the regional rate and slightly above the replacement level of 2.1 children per woman.

Total Fertility Rates for other religious groups were considerably lower than the regional average and the replacement level.

Age Structure

Age Breakdown of Religious Groups in Latin America and Caribbean, 2010

The median age of the religiously unaffiliated (26) in the Latin America-Caribbean region was slightly younger than that of Christians (27) and the overall population (27) in 2010. By contrast, the median age of Hindus (32) and those belonging to folk religions (35) was considerably higher.

Religious Switching

Projected Religious Composition of Latin America and Caribbean in 2050, With and Without Religious Switching

The religiously unaffiliated population in Latin America and the Caribbean is expected to grow in part because of religious switching. (For information on the impact of religious switching on the demographic projections in this report, see Chapter 1.) In a projection scenario with no religious switching, the unaffiliated share of the region’s population in 2050 (8.0%) would remain about the same as it was in 2010 (7.7%). Taking into account projected patterns of religious switching, however, the unaffiliated share of the population is expected to be nearly 9% by mid-century.

Religious switching also is expected to result in an increase in the proportion of people in Latin America and the Caribbean who identify with folk religions, including Candomblé, Umbanda and Spiritism.61

The Christian share of the region’s population in 2050 is expected to be modestly smaller as a result of religious switching.

Migration

Millions of migrants from Latin America and the Caribbean are projected to move out of the region in the decades ahead, and many are expected to move to the United States. But this northward migration is not expected to dramatically change the religious composition of the Latin America-Caribbean region. Consequently, the report does not show different projection scenarios with and without migration for this region. (For more information on the impact of migration on the demographic projections in this report, see Chapter 1.)

Middle East-North Africa

More than nine-in-ten people in the Middle East and North Africa were Muslim as of 2010 (93%), and the share of the region’s population that is Muslim is expected to be slightly higher in 2050 (94%).

The Middle East-North Africa region’s Muslim population is expected to grow by 74% from 2010 to 2050, from 317 million to 552 million.62 Christians and Jews are projected to remain the second- and third-largest religious groups in the region, respectively, with more modest population gains of 43% and 46%.

The smaller, religiously unaffiliated population is forecast to grow 56%, from about 2 million to more than 3 million. Hindus, adherents of folk religions and Buddhists are expected to experience the greatest growth as a percentage of their modest 2010 counts, with each group more than doubling in size by 2050.

Size and Projected Growth of Major Religious Groups in Middle East and North Africa, 2010-2050

Only about a fifth of the world’s Muslims live in the Middle East and North Africa, but it is the only region where a majority of the population is Muslim.63 While the Muslim share of the region’s population increases slightly in the coming decades, the Christian and Jewish shares are expected to decline modestly.

Factors Driving Change

Fertility

Total Fertility Rates of Religious Groups in Middle East and North Africa, 2010-2015

The Total Fertility Rate of Muslims in the Middle East-North Africa region is 3.0 children per woman in the 2010 to 2015 period, considerably higher than replacement-level fertility (2.1). The fertility rate of Jews is 2.8. Data on the fertility of Christians is not consistently reliable across the region. However, the available evidence suggests that Christian fertility in the region tends to be lower than Muslim fertility. In Egypt, for example, the fertility rate for Christians is 1.9, compared with 2.7 for Muslims.

Age Structure

Age Breakdown of Religious Groups in Middle East and North Africa, 2010

As of 2010, the median ages of Christians (29) and Jews (32) were older than the median age of Muslims (23) in the Middle East-North Africa region. The higher median age of Christians partly explains why Christians are forecast to make up a declining share of the region’s population in future decades.

Religious Switching

The projected size of religious groups in the Middle East-North Africa region in 2050 did not change appreciably whether or not switching was included in the projection models. Survey data from select countries – including Egypt, Iraq and Tunisia – indicate that changes in religious identity are rare in the region. A Pew Research Center analysis found that, as of 2012, more than half of the countries in the Middle East and North Africa have laws banning apostasy (the act of abandoning one’s faith), in some cases carrying the death penalty as punishment. Such laws are less common in other regions.64

Because of a lack of data, religious switching was not modeled for Israel.

Migration

Projected Religious Composition of Middle East and North Africa in 2050, With and Without Migration

Migration is expected to alter the religious landscape of the Middle East and North Africa in future decades, particularly in the six Gulf Cooperation Council (GCC) countries: Bahrain, Kuwait, Oman, Qatar, Saudi Arabia and the United Arab Emirates. To maintain their economic growth, the GCC countries rely heavily on a labor force largely made up of immigrant workers from such countries as India, Egypt, Pakistan, Bangladesh, the Philippines and Sri Lanka.65

In a projection scenario with no migration, the expected shares of Hindus and Buddhists in the region would be half as large as they are in the 2050 forecast that incorporates expected migration flows from Asia. While the shares of the region’s population that are Hindu or Buddhist are expected to increase due to migration, these religious groups still are expected to make up less than 1% of the region’s total population in 2050.

While emigration out of the Middle East and North Africa is projected to lower the share of Christians in countries such as Egypt, Iraq and Syria, the immigration of Christians into the GCC countries is expected to more than offset these departures for the region overall. Thus, migration is expected to slow the projected decline in the Christian share of the population in the Middle East-North Africa region. If migration were not factored into the 2050 projections, the estimated Christian share of the region’s population would drop below 3%. With migration factored in, however, the estimated Christian share is just above 3% (compared with nearly 4% as of 2010).

(For more information on the impact of migration on the demographic projections in this report, including a more detailed look at Christian migration into and out of the Middle East and North Africa, see section in Chapter 1.)

Sub-Saharan Africa

The total population in sub-Saharan Africa is expected to grow at a faster pace than in any other region in the decades ahead, more than doubling from 823 million in 2010 to 1.9 billion in 2050. As a result, the two dominant religions in the region – Christianity and Islam – both are expected to have more than twice as many adherents in 2050 as in 2010.71

Christians are projected to remain the region’s largest religious group, growing from 517 million in 2010 to more than 1.1 billion in 2050. But the Muslim population is expected to grow at a faster rate than the Christian population (170% vs. 115%), rising from 248 million to 670 million. Most of the smaller religious groups in sub-Saharan Africa, including adherents of folk religions and the religiously unaffiliated, are expected to experience at least modest growth in the decades ahead, although the small Jewish population is projected to shrink.

While the absolute number of Christians in sub-Saharan Africa is expected to double in size by 2050, the Christian share of the region’s population is expected to decline, dropping from 63% in 2010 to 59% in 2050. Meanwhile, the Muslim share is projected to increase from 30% to 35%.

Size and Projected Growth of Major Religious Groups in Sub-Saharan Africa, 2010-2050

Factors Driving Change

Fertility

Total Fertility Rates of Religious Groups in Sub-Saharan Africa, 2010-2015

The Total Fertility Rates for the two fastest-growing religious groups in sub-Saharan Africa – Muslims and adherents of folk religions – are higher than the rates for Christians and the unaffiliated. However, fertility rates for all major religious groups in sub-Saharan Africa are considerably higher than the replacement level of 2.1 children per woman.

Age Structure

Age Breakdown of Religious Groups in Sub-Saharan Africa, 2010

The groups projected to experience rapid growth in sub-Saharan Africa in the decades ahead had very young populations in 2010. Nearly half of the region’s Muslims (46%) were under age 15, as were 44% of those adhering to folk religions, 41% of Christians and 40% of the unaffiliated.

The median ages of these groups ranged from 17 (for Muslims) to 20 (for the unaffiliated). The median age for the region overall was 18.

Religious Switching

Projected Religious Composition of Sub-Saharan Africa in 2050, With and Without Religious Switching

Religious switching is expected to change the religious landscape of sub-Saharan Africa in future decades only modestly. (For information on the impact of religious switching on the demographic projections in this report, see Chapter 1.) The Muslim share of sub-Saharan Africa’s 2050 population is expected to be 0.3 percentage points higher than it would be if projected religious switching were not taken into account. By contrast, the projection for the Christian share of the region in 2050 is 0.3 percentage points lower than if religious switching were not included in the projections.

Migration

In the decades ahead, more migrants are expected to move out of sub-Saharan Africa than move into the region. This outbound migration is not expected to have a large impact on the overall religious composition of the region. Consequently, the report does not show different projection scenarios with and without migration for this region.

North America

Christians are projected to remain the largest religious group in North America in the decades ahead, and their numbers are expected to increase from 267 million as of 2010 to 287 million in 2050.66 But North America’s Christian population is forecast to grow at a much slower rate (8%) than most other religious groups in the region, leading to a decline in the share of North America’s total population that is Christian.

The religiously unaffiliated population is expected to nearly double in size, growing from 59 million in 2010 to 111 million in 2050. The number of Muslims is expected to nearly triple, from more than 3 million as of 2010 to more than 10 million in 2050, making Muslims the third-largest religious group in the region by mid-century.

Size, Projected Growth of Major Religious Groups in North America, 2010-2050

North America’s Hindu and Buddhist populations are expected to reach around 6 million each by 2050, although the rate of increase is projected to be much greater for Hindus (160%) than for Buddhists (58%). Increases of more than 100% also are forecast for the number of people who practice folk religions or identify with other religions (such as members of the Baha’i faith, Jains and Sikhs).

The size of the Jewish population in North America is projected to decrease slightly between 2010 and 2050; this is because Jews in the region were relatively old and had low fertility rates compared with other religious groups as of 2010. Some religious switching out of Judaism also is expected.67 By mid-century, North America’s Muslim population is expected to be larger than its Jewish population (10 million Muslims vs. about 6 million Jews).

While the absolute number of Christians in North America is projected to rise in the decades ahead, the Christian share of the region’s population is expected to decrease from 77% in 2010 to 66% in 2050. That decline correlates in large part with an increase in the unaffiliated share of North America’s population, from 17% in 2010 to 26% in 2050.

Factors Driving Change

Fertility

Total Fertility Rates of Religious Groups in North America, 2010-2015

The Total Fertility Rate of Muslims in North America is 2.7 children per woman in the 2010 to 2015 period, well above the regional average (2.0) and the replacement level (2.1). The fertility rate for Christians (2.1) is on par with replacement level. Other religious groups in the region have fertility rates below replacement level, including Jews (2.0) and the religiously unaffiliated (1.6).

Age Structure

Age Breakdown of Religious Groups in North America, 2010

Many of the groups projected to experience rapid growth in North America had relatively young populations in 2010. The median ages of Muslims (26), Buddhists (30), Hindus (30) and the religiously unaffiliated (30) were all younger than the regional median age (37) as well as the median ages of Christians (39) and Jews (41) in North America.

Religious Switching

Projected Religious Composition of North America in 2050, With and Without Religious Switching

The religiously unaffiliated population in North America is expected to grow primarily because of high levels of religious switching.68 (For information on the impact of religious switching on the demographic projections in this report, see Chapter 1.) Without religious switching, the unaffiliated share of the population in 2050 would be expected to remain about the same as it was in 2010 (17%). Taking into account projected patterns of religious switching, however, the unaffiliated share of the population is expected to increase to 26% by mid-century.

Religious switching also is expected to result in an increase in the proportion of North Americans in the “other religions” category, which includes such groups as Unitarian Universalists and Wiccans.69

If no religious switching were projected, the Christian share of the population in 2050 (75%) would be close to the 2010 share (77%). Because of expected switching, however, the Christian share of North America’s population is projected to be significantly smaller (66%).

Projected religious switching also lowers the expected Muslim, Buddhist and Jewish shares of the region’s 2050 population.

Migration

Projected Religious Composition North America In 2050, With and Without Migration

Migration also is expected to alter the religious landscape of North America in future decades. (For information on the impact of migration on the demographic projections in this report, see Chapter 1.) Muslims, Hindus and Buddhists all are expected to increase as a share of North America’s population because of immigration, primarily from countries in the Asia-Pacific region and the Middle East and North Africa. By contrast, the Jewish and religiously unaffiliated populations are projected to be slightly smaller in size in the decades ahead than they would be if migration were not taken into account. Migration is not expected to substantially change the share of the region’s population that is Christian.70

Appendix A: Methodology

This appendix details the methods used in this study to project changes in the population size and geographic distribution of eight major religious groups from 2010 to 2050. It is organized in five sections. The first section explains how the baseline (2010) religious composition estimates were derived. The second section describes how key input data (age and sex composition, fertility, mortality, migration and religious switching) were gathered and standardized. The third part of this appendix introduces the projection methods and assumptions. The fourth section offers some important disclaimers about these projections. And the final part includes additional notes about the regional categories used in this study; explains how China’s religious composition was estimated; and discusses differences between the current estimates and those in previous Pew Research Center religious demography reports.

Estimating Religious Composition in 2010

Data Collection and Documentation

Researchers acquired and analyzed religious composition information from about 2,500 data sources, including censuses, demographic surveys, general population surveys and other studies – the largest project of its kind to date. Censuses were the primary source for religious composition estimates in 90 countries, which together cover 45% of all people in the world.72 Large-scale demographic surveys were the primary sources for an additional 43 countries, representing 12% of the global population. General population surveys were the primary source of data for an additional 42 countries, accounting for 37% of the global population.

Together, censuses or surveys provided estimates for 175 countries, representing 95% of the world’s population. In the remaining 59 countries, representing 5% of the world’s population, the primary sources for the religious composition estimates include population registers and institutional membership statistics reported in the World Religion Database and other sources. A list of the primary sources used to estimate the overall religious composition of each country is provided in Appendix B.

Censuses and nationally representative surveys can provide valid and reliable measures of religious landscapes when they are conducted following the best practices of social science research. Valid measurement in censuses and surveys also requires that respondents are free to provide information without fear of negative governmental or social consequences. However, variation in methods among censuses and surveys (including sampling, question wording, response categories and period of data collection) can lead to variation in results. Social, cultural or political factors also may affect how answers to census and survey questions are provided and recorded.

The measure of religious identity in this study is sociological rather than theological. In order to have statistics that are comparable across countries, the study attempts to count individuals who self-identify with each religion. This includes people who hold beliefs that may be viewed as unorthodox or heretical by others who claim the same religion. It also includes people who do not regularly practice the behaviors prescribed by their religion, such as those who seldom pray or attend worship services.

Standardization of Religious Categories and Measurement Strategies

At least three researchers worked together to produce each country’s religious composition estimates, observing the general procedures and considerations described below.

Pew Research Center staff standardized religion categories in all available censuses and surveys for each country. Censuses and surveys collect information on religious identity at different levels of specificity. For example, depending on the source, the most specific level of affiliation measured could be Christian, Protestant, Baptist or Southern Baptist. Researchers coded religious identities into standard categories that aggregate into the eight major global religious categories used in this report.

Identifying Primary Source(s) for Religious Composition Estimates

After considering all evidence available, researchers identified one or more primary sources for each country’s religious composition estimate. Researchers sought a recent, reliable source – ideally, a census or large-scale demographic survey. Researchers favored sources in which religion was measured with a single question that permitted respondents to identify specific affiliations or no affiliation at all.73

Nationally representative surveys were occasionally chosen as a primary source rather than a census or demographic survey due to limitations in the measurement of religion in the latter sources. In Vietnam, for example, the 2009 census and the 2005 Demographic and Health Survey did not adequately measure folk religion identities. Researchers instead relied on the 2005 Asian Barometer survey, which measured a wider range of religious identities, including identification with folk religions.

Making Adjustments for Groups Not Adequately Measured

As necessary, researchers made adjustments to the primary source(s) to account for omitted or underrepresented groups since small minority groups are sometimes not measured or not reported in surveys and censuses. Multiple survey sources, denomination counts and estimates produced by country experts for each nation were used to assess whether minority religious groups were omitted or undercounted in the selected primary source(s).

In cases where censuses and surveys lacked sufficient detail on minority groups, the study also drew on estimates provided by the World Religion Database, which takes into account other sources of information on religious affiliation, including statistical reports from religious groups themselves.

Adjusting for Limitations in a Survey Questionnaire

Usually, researchers assumed that members of underrepresented groups were included in the sample but were not adequately measured by the survey instrument. Adjustments frequently were made among people who responded “other religion” or failed to answer the religion question. In a few cases, the study made adjustments based on evidence that political, legal or cultural dynamics in a country compromised the validity of self-reported religious identity.

In India, for instance, there is evidence of a Christian undercount in the census; some Christians who belong to Scheduled Castes (historically referred to as Untouchables or Dalits) choose to identify as Hindu when completing official forms such as the census.74 This is due to a mandate in the Indian constitution specifying that only Hindus, Sikhs and Buddhists can receive caste-based government affirmative-action benefits (known as reservations in India).75 After analyzing Indian survey data and convening a special consultation on this topic with leading India demographers at the 2010 Asian Population Association’s meeting in New Delhi, researchers adjusted the Christian population of India’s 2001 population from 2.3% to 2.6%, assuming a 10% undercount in the census.76 In this case, the adjustment comes from the Hindu category. (Hinduism is the most common religion in India.)

Adjusting for Sampling Limitations

In some situations, underrepresented groups are likely to be omitted from the sample itself. For example, recent migrants who may not be fluent in the language used in a survey often are missing in samples. Accounting for groups not included in the sample requires proportionately deflating survey data to account for underrepresented populations. For example, researchers made adjustments to survey-based estimates in Europe where they found evidence that some survey samples and population registers underrepresented Muslim migrants.

In this study, researchers sought to ensure that primary sources were representative of the entire country. When this was not the case, it was usually due to concerns about the safety of interviewers and census takers or disputes about political boundaries. In such cases, researchers attempted to make appropriate adjustments or find an alternative data source that was nationally representative.

For example, the 2001 Sri Lankan census was not conducted in a handful of northern and eastern districts because of perilous conditions due to armed conflict. After analyzing religion data from earlier censuses, researchers determined that the areas that were not covered by the 2001 census historically had a different makeup than the rest of the country. Researchers adjusted the 2001 census data for Sri Lanka based on 1981 census data covering regions omitted in the 2001 census.77

Religious identity is sometimes linked to ethnic identity, particularly for religious minorities. In a small number of countries where the census did not measure religious affiliation or where survey data on religious affiliation had sampling limitations, researchers used ethnicity data to estimate the religious affiliation of small groups. For example, ethnicity data from the 2002 Russian census was used together with 2005 Generations and Gender Survey data to estimate the proportion of Muslims in Russia. The survey did not adequately sample the country’s predominantly Muslim areas, but it did provide information on the share of Muslims within ethnic groups associated with Islam.78 This information, combined with census ethnicity data, was used to adjust the Muslim composition estimate in regions the survey sampled inadequately.

Making Adjustments for the Religious Affiliation of Infants

Parents are sometimes hesitant to report a religious affiliation for their infant children even though they will claim a religion for the child when he or she is slightly older. Researchers observed evidence of this phenomenon in some Christian-majority countries where Christian parents were disproportionately describing their infants as religiously unaffiliated.

This is evident when comparing census numbers over multiple years. In Brazil, for example, the 2000 census reported that 11% of those ages 0-4 were unaffiliated. By the time of the 2010 census, only 8% of the same birth cohort (then 10 to 14 years old) was unaffiliated. While some of this change may be explained by mortality and migration, it is at least partly due to parents being more willing to describe their older children as Christians. In order to compensate for this measurement bias in Brazil and a few other countries where there was evidence of this phenomenon, researchers applied the religious composition of older children (those 5-9 years old) to infants and young children (those 0-4 years old). This adjustment was made only where there was a substantial difference between the religious composition of the youngest age group and children ages 5-9.79

Making Adjustments for Missing Religion Data

Some degree of missing data is found in most surveys and censuses. Census agencies typically make adjustments for missing data before reporting results. For example, though some respondents fail to answer questions about sex and age, census agencies follow procedures to impute missing values so it is not necessary to report “sex not stated” and “age not stated” as sex and age categories. Some census agencies, such as Statistics Canada, have historically imputed religion values for respondents who have not answered the census religion question.

The likelihood that religion data will be missing increases when religion questions are labeled as optional, as is the case on censuses in countries such as Australia, the United Kingdom and the Czech Republic.80 Census agencies in countries where religion is labeled as an optional question often report “religion not stated” results alongside standard categories of affiliation and non- affiliation. This strategy allows the census agencies to demonstrate that answering their religion question was indeed optional. However, for purposes of this study, the “religion not stated” category is not a meaningful religious identity. Therefore, after making any necessary adjustments for undercounted groups, religious shares were recalculated based on the population of all people who gave valid responses to the census or survey. The effect of this approach was to proportionately raise the shares of all religious groups, including the religiously unaffiliated.

Following the procedures described above, researchers produced national-level estimates of the religious composition of each country for the year measured by the primary source. In order to report 2010 population figures, the religious composition percentages based on data collected in 2008 or later have been multiplied by the United Nations’ 2010 population estimate for each country and territory.

Projecting Earlier Data to 2010

Estimates based on data collected prior to 2008 have been projected forward to 2010. In those cases, researchers used additional data on differential fertility, age and sex composition as well as migration to project populations forward to 2010, the base year for the projections in this report. Additional information about the projections to 2010 and the estimates of religious composition are available in Appendix A of the 2012 Pew Research Center report “The Global Religious Landscape: A Report on the Size and Distribution of the World’s Major Religious Groups as of 2010.” See https://assets.pewresearch.org/wp-content/uploads/sites/11/2012/12/globalReligion-appA.pdf.

The 2010 religious composition used for each country generally matches the estimates used in the 2012 report, except in cases where new sources, including recently released census data, allowed researchers to update estimates.

Input Data for Population Projections

The demographic projections in this report use data on age and sex composition, fertility, mortality, migration and religious switching. This section describes how these data were gathered and standardized for use in the projections.

Age and Sex Structure Procedures

Religious affiliation varies by age.81 In this section, the phrase “age structure” is used as shorthand to refer to the religious composition of age-sex groups. In order to calculate the median ages of religious groups and carry out population projections, researchers assembled age structures for each of the eight religious groups in every country. Data on age structures were collected in 20 age categories (measured in five-year increments with a top value of 95 and above) for males and females (e.g., males ages 15-19), resulting in a total of 40 categories.

Age structures were compiled in three steps. First, census or survey data were used to capture the religious affiliation of each available age group. Second, survey data on religion by age were adjusted to account for small sample sizes. And third, results were adjusted to match the religious breakdown by age and sex with each country’s overall religious composition. These steps are described in detail below.

Estimating Religion by Age and Sex

Researchers constructed initial age structures by analyzing survey data sets, census data sets and tables published by census agencies. While censuses usually enumerate religion for the entire population, including children, general population surveys do not usually include interviews with children. Since age structures require religious affiliation data for children, children were assigned religious affiliations when necessary based on the best methods available. For data sets that measured religious affiliation only for adult respondents, yet included the number and ages of children (and other adults) in the household, researchers were able to estimate the religious affiliation of remaining household members. In most cases, the religious affiliation of the respondent or head of the household was assigned to all additional members of the household who were not surveyed.82 For surveys that did not offer household information, such as the AmericasBarometer or the European Values Study, children were assigned a religious affiliation based on the fertility patterns and religious affiliation of women of childbearing age, as well as information about the religious affiliation of the youngest respondents measured in the survey.

For many countries, reliable age data were not available for all eight religious groups. Sometimes a survey indicated the overall size of a small religious group yet lacked sufficient numbers to reliably estimate the group’s age breakdown. In such cases, the age breakdowns of minority religious groups were based on the country’s overall age distribution or the combined age distribution of respondents from all minority religions in a survey.

Adjustments to Minimize Errors Due to Sample Size

The reliability of survey estimates is partly dependent on the number of people surveyed (the sample size). Since respondents who identify with each religious group are divided into 40 age and sex categories, the number of Buddhists, for example, in any one age-sex category may be small and produce less reliable estimates than a larger count would produce. This introduces significant variation in patterns of religious affiliation by age: Affiliation levels may bounce between highs and lows for consecutive age groups. To eliminate unlikely variation, researchers smoothed data using statistical procedures intended to reveal the general underlying pattern.83

Census data are not smoothed because census data represent a complete enumeration of all individuals living in a country. However, in some cases, the age categories reported by census agencies are in 10-year age groups or aggregated for all adults above a certain age, such as 60. Researchers used statistical modeling techniques to distribute the composition of these aggregated age groups across the more specific five-year age categories used in this study.

Matching Religion by Age and Sex to Overall Population by Age and Sex

The overall religious affiliation resulting from the age structure procedures sometimes varies from the religious composition estimated for the country using the procedures described in the first section of this appendix. This difference exists for two reasons. First, the data sources used for the age-structure procedure may be different from the data sources used for the religious composition. Second, overall religious compositions were adjusted manually to account for undercounts and sampling issues.

In order to match the overall religious composition figures to the data on religion by age and sex, the age structure was adjusted. The adjustment procedure used is often referred to as iterative proportional fitting (IPF), or raking. Raking makes adjustments to the percentages of religious affiliation for each age group without significantly altering the underlying religious affiliation patterns by age group. Additionally, raking is used to match each country’s counts of males and females in particular age groups to the U.N.’s estimate of the country’s overall age distribution.

When survey or census data on the differential religious composition of age-sex groups were not available, each age-sex group was assigned the same religious composition. Lack of differential religious composition data by age-sex group was most common in countries with very small populations.

Sources for Age and Sex Structure Data

As mentioned above, the data source used for a country’s age structure is sometimes different from the source used for the country’s overall religious composition (see Appendix B on page 196 for a list of religious composition sources by country). This is the case, for example, when census data with overall religious composition results are available but a detailed breakdown by age and sex is not released by the census bureau, in which case another source must be used to generate the age structure. Sources are also different when multiple waves of a survey series have to be combined in order to have a sample size large enough to construct reliable age structures.

Age structures were further adjusted in countries where the age structure data source is much older than the source used for the religious composition of the country. In order to harmonize the data on overall religious affiliation with the age structure data, the latter is aged in five-year projections while holding the religious composition data constant.

In a small number of countries, age structures were estimated based in part on ethnicity or citizenship data. For example, all six Gulf Cooperation Council (GCC) countries release information on the age distribution of citizens and non-citizens, but only Bahrain further breaks down this information by Muslims and non-Muslims.84 For this reason, age distribution estimates for citizens and non-citizens in other GCC countries are modeled on Bahrain, where almost all citizens are Muslim but a substantial share of non-citizen residents (mostly migrant workers) belong to other faiths.

Estimating Fertility

In many countries, there are substantial differences in the number of children born to women in different religious groups. Furthermore, religious groups often vary in the share of women in their population who are of childbearing age, and women in some groups may, on average, begin having children at younger or older ages than do women in other groups. These differences in childbearing patterns, age structure and fertility timing combine to produce differences in the rates at which babies are born to adherents of the world’s major religions.

Fertility data were gathered from censuses and surveys, and fertility rates were estimated via direct and indirect measures. Some censuses and surveys directly measure recent births or the number of children a woman has ever born by the time of the survey. In other cases, fertility data were gathered indirectly; for example, by using data on the age of a mother’s children to estimate her past birth patterns. These various sources of fertility data were used to estimate age-specific and Total Fertility Rates for religious groups in each country.85

In many countries, data on differential fertility are available for the largest religious groups but sufficient detail is not available for all minority religious groups. In Nigeria, for example, more than 98% of women of reproductive age are either Christian or Muslim, and there are sufficient data for estimating fertility for these two groups. For other groups in Nigeria, however, researchers had to base estimates on more limited data. Similarly, there are many countries in which one religious group makes up 95% or more of the women of reproductive age, resulting in a relatively small number of women of other religions (and thus limiting fertility data for those religious groups).

In some countries, differential fertility data by religion were not available. In these cases, researchers applied prevailing national fertility rates to all religious groups equally.

Life Expectancy

Little research has been conducted on cross-national differences in mortality and life expectancy across religious groups. In the absence of better data, the same mortality patterns within each country are assumed for all groups; for example, Christians and Muslims born in the same year in Nigeria are assumed to have the same life expectancy at birth. Each country’s projected mortality patterns are based on U.N. mortality tables for the country. At the global level, mortality rates for each group reflect differences between the countries in which the various groups are concentrated.

Estimating and Projecting the Size and Religious Composition of Migrant Flows

To model the impact of migration on future religious change, the population projections in this report required an estimate of the religious composition of recent migrant flows between countries – that is, how many migrants moving from Country X to Country Y are Christian? How many are Muslim? How many are Hindu? Etc. Data on the size and religious breakdown of migrant flows were pieced together in two steps. The first step was to estimate how many people move to and from every country in the world. Second, the religious composition of migrants moving between countries was estimated.

Generally speaking, there is much better information on migrant “stocks” (how many foreign-born people reside in each country, and where they were born) than there is on migrant “flows” (how many people move between countries each year). The limited flow data that are available may not capture all modes of travel or all kinds of international migrants, and it can be difficult to distinguish short-term travel from long-term migration. Since data on migration flows are incomplete, data on migrant stocks from the World Bank (for the year 2000) and the Pew Research Center’s Global Religion and Migration Database (for the year 2010) were used to estimate migration flows for both males and females between 2000 and 2010. (Both data sources represent a compilation of census and survey data from around the world, estimating the size of the foreign-born population in each destination country, broken down by country of origin.86)

Flows were estimated by first approximating 2005 stocks using interpolated trends based on differences between the 2000 and 2010 migrant stock information. Second, using an innovative technique developed by researchers at the Vienna Institute of Demography, differences in foreign-born populations between 2005 and 2010 were used to estimate migration flows for 155 countries.87 Using empirical data and observed regularities in the age patterns of migration flows, researchers were able to disaggregate each estimated total flow into subtotals by five-year age groups.

Resulting estimates of migration flows were reviewed by Pew Research Center staff to be sure all estimates represented recent migration patterns, and some adjustments were made. Several countries with a total population of less than a million people did not have recent data on migration; thus, migration flows for these smaller countries are not included in the population projections. Migration patterns to some countries changed between 2000 and 2010. Most notably, the economic crisis in the latter part of the decade slowed migration in many parts of the world. Consequently, future migration flows were reduced by 25% for most countries and up to 50% for a handful of countries.88 Lastly, the origins of migrants can change over the course of a decade. In Israel, for example, the origins of migrants in 2000 were much different than those arriving in 2010. In this case, data containing the most recent migration flows into Israel were used. Adjustments made to migrant flows are listed by country in the appendix on data sources (see Appendix B on page 196).

The second step was to identify the religious breakdown of migrants. It is important to realize that the religious composition of migrants is not always the same as the religious composition of the general population in their country of origin. In many cases, members of some religious groups are more likely than others to leave a country, and they are also more likely to choose certain destination countries. Religious minorities, in particular, may be disproportionately likely to migrate to a country in which their religion is in the majority. For example, surveys of recent immigrants indicate that Christians from the Middle East and North Africa are more likely than Muslims from the region to move to the United States. During the 2010-2015 period, an estimated 13% of migrants to the U.S. from the Middle East-North Africa region were Christian, although only about 4% of the region’s overall population was Christian as of 2010. Consequently, the religious breakdown for most of the world’s movement of migrants is drawn from the Pew Research Center’s Global Religion and Migration Database – a data source estimating the religious breakdown of migrant populations based on global census and survey information. The information in the database is of varying quality. But because data on the religious breakdowns of migration patterns are more readily available in the world’s top destination regions (Europe, North America and some countries in the Asia-Pacific region), the religious composition estimates for the vast majority of migrants are based on data of high quality.89

Using all of this information, researchers calculated migration rates to and from most countries by age, sex and religion.90 Using migration rates instead of population counts allows for a more dynamic model of future migration. As countries increase or decrease in size and their religious composition changes, the migration rates will produce corresponding changes in the size and religious composition of migrant flows.

Estimating Religious Switching

Studies of religious switching indicate that this phenomenon is often concentrated in young adult years, roughly between ages 15 and 29. Change in religious affiliation may occur as young adults move away from their parents and partner with someone of a different affiliation status. While some religious switching may take place at other ages, switching is modeled as a life course phenomenon in which some young adults change their religious affiliation status. There may be some time periods during which people of all ages are prone to religious switching, such as when political circumstances in a country encourage or discourage religious identity or lack of religious identity.91 Our models do not attempt to include such period effects.

Sources of Switching Data

The typical procedure for measuring religious switching is to compare the religion in which a person grew up with their current religion (when the person is an adult). The best sources of data on religious switching are nationally representative surveys that ask adults about their current religion as well as the religion in which they were raised. In 70 countries, data are available on both the religious upbringing of survey respondents and on current adult religious identity.92 These surveys typically have sample sizes between 1,000 and 3,000 respondents. Data sources include cross-national surveys carried out as part of the International Social Survey Program and by the Pew Research Center, as well as some surveys carried out only in one country.93 Unfortunately, while censuses and large-scale demographic surveys often measure current religious affiliation, they generally do not measure religious origins, and so they cannot be used to directly measure religious switching. (Censuses in Northern Ireland and Scotland are exceptions.)

Since men and women often follow different switching patterns, researchers calculated rates of switching separately for men and women based on the experiences of adults ages 18-54 at the time of the survey. Researchers assume that the experience of young respondents is the best source of information about likely switching patterns for emerging generations, so the experiences of older respondents (those ages 55 and above) are excluded from the analysis. The analysis was initially restricted to the switching experience of 30- to 54-year-olds; while this restriction allowed the focus to be on respondents who have recently completed their young adult years, it left less-than-optimal sample sizes. Including the full range of adults ages 18-54 in the sample increased sample sizes and did not appear to compromise the reliability of the switching rates.94

Coverage of Religious Switching Data

The 70 countries where switching was modeled in the main scenario held 43% of the world’s population in 2010, including many countries where switching between having a religious affiliation and not having a religious affiliation is common, such as the United States, France, Australia and New Zealand. The most populous countries in which switching was not modeled are China and India. Prior to this study, the most extensive analysis of religious switching covered 40 countries.95

China

It is difficult to formally project religious switching in China without information on recent or likely patterns of switching. For example, it is not clear at what rate people in China may be converting to Christianity from other groups, and retention patterns among Christian converts are not known. Nor is it clear at what rate Islam, Buddhism and other faiths may be gaining adherents in China. If China experiences a net movement toward religious affiliation via switching in the decades ahead, that would tilt the needle toward a more religiously affiliated global population, particularly since China is currently home to a majority of the worldwide unaffiliated population. (For more details on religious switching in China, see sidebar in Chapter 1 of the report.)

India

Like China, India is home to more than a billion people. But unlike China, where many people have diffuse religious identities or no religious affiliation, in India the overwhelming majority of the population identifies with some religion. Religious switching has long been a sensitive subject in India, and media accounts include allegations of mass conversions, forced conversions, proselytizing, and other controversies related to religious switching, particularly from Hinduism to Christianity or Islam. However, there is very little empirical data on religious switching in the Indian population. No current, nationally representative survey of Indians provides reliable data both on respondents’ childhood religion and on their current religious affiliation (the basis for calculating switching rates).96 After analyzing Indian survey data and consulting other sources of information on the country, researchers were unable to discern a clear pattern of religious switching. As a result, this report does not estimate religious switching in India.

Other countries where religious switching was not modeled include some Muslim-majority countries with little evidence of religious change (such as Afghanistan and Bahrain), countries where religious switching data are not consistent or reliable (such as Vietnam) and countries with no data or evidence of religious activity (such as North Korea).

Muslim-Majority Countries

This analysis of religious switching draws on surveys in 19 countries where Muslims constitute a majority of the population. Generally, however, there are few reports of people disaffiliating from Islam in these countries. One reason for this may be the social and legal repercussions associated with disaffiliation in many Muslim-majority countries, up to and including the death penalty for apostasy. It is possible that in the future, these societies could allow for greater freedom to religiously disaffiliate. The demographic projections in this report do not seek to predict the likelihood of such changes in political and social dynamics, or to model what the consequences might be.

Population Projections: Methods and Assumptions

The Projection Approach

The technical calculations for the projections in this report were made by researchers at the Age and Cohort Change Project of the International Institute for Applied Systems Analysis (IIASA) using an advanced variation of the standard demographic method of making population projections. The standard approach is called the cohort-component method, and it takes the age and sex structure of a population into account when projecting the population forward in time. This has the advantage of recognizing that an initial baseline population can be relatively “young,” with a high proportion of people in younger age groups (such as Nigeria) or relatively “old,” with a high proportion of older people (such as Japan).

Cohorts are groups of people that had an experience in a particular time. A birth cohort, the type of cohort referenced in this context, comprises people born in a certain period. Birth cohorts can also be described as males or females who have reached a certain age in a particular year. For example, the cohorts of females ages 15-19 in the year 2000 and males ages 15-19 in the year 2000 shared the experience of being born between 1981 and 1985.

Components are the three ways in which populations grow or shrink: new entrants via births, exits via deaths and net changes from migration. Each cohort of the population is projected into the future by adding likely gains – births and people moving into the country (immigrants) – and subtracting likely losses – deaths and people moving out (emigrants) – year-by-year. The very youngest cohorts, those ages 0-4, are created by applying age-specific fertility rates to each female cohort in the childbearing years (ages 15-49).97

The cohort-component method has been in existence for more than a century. First suggested by the English economist Edwin Cannan in 1895, then further improved by demographers in the 1930s and ’40s, it has been widely adopted since World War II. It is used by the United Nations Population Division, the U.S. Census Bureau, other national statistical offices and numerous academic and research institutions.

The advanced variant of this approach, multistate cohort component projection, became viable starting in the 1970s thanks to the availability of mainframe computers and work by the American geographer Andrei Rogers, among others. The multistate approach permits simultaneous projection of the eight religious groups included in this study, taking into account variation by religion in age, sex, childbearing patterns and propensity and direction of migration. This approach also enables modeling of religious switching as a transition between religious “states.”

Projections have been carried out for 198 countries and territories with populations greater than 100,000. The regional and global totals in the study also include estimates for 36 countries and territories that collectively made up 0.02% of the world’s population in 2010. Estimates for these low population countries and territories are based on U.N. estimates of the countries’ future population sizes; the distribution of religious identities in these countries is based on 2010 data.

Projection inputs for each country – including differential data by religion on fertility, age structure, migration and, where available, switching rates – were used for multistate cohort component projections going out to the year 2050. Country-level 2010 population data and fertility trajectories are based on the 2010 revision of the United Nations’ World Population Prospects.

The projection models assume that fertility differences between the religiously affiliated and the unaffiliated will gradually converge by the year 2110, as educational differentials between the groups disappear. The main projection scenario extends current switching rates in the 70 countries with available data.

This report focuses on the main scenario with fertility convergence (i.e., narrowing fertility differentials between religious groups); constant religion-specific out-migration rates by age, sex and destination matrices; and constant religious-switching rates. In order to explain the influence of demographic factors, the report also presents alternative scenarios with: (1) no differences in fertility by religious groups; (2) no migration flows between countries; (3) no religious switching between religious groups; and (4) proxy data used in 85 countries to model the effects of religious switching in a total of 155 countries.

Fertility

In the main scenario, all religious groups within each country are assumed to see their fertility levels slowly converging toward identical fertility rates by 2110 – a century from the baseline year of the projections. The assumption that fertility differences gradually will diminish within countries is based on evidence that when people live in the same economic and social milieu, their fertility patterns tend to become increasingly similar over time. Studies have shown, for example, that the offspring of immigrants to the United States and Europe tend to adopt the fertility patterns of the general population in the countries where they live within a few generations. The adoption of a relatively conservative, 100-year timeframe for within-country convergence reflects the fact that geographic clustering, differing education levels and other factors may perpetuate distinctive childbearing patterns among some religious groups. At each step of the main projection scenario, fertility for the total population of a country follows the U.N. medium variant assumptions from the 2010 revision (U.N. 2011).

An alternative scenario discussed in Chapter 1 of this report assumes that there are no religion-specific differentials in fertility. In this scenario, all religious groups are assumed to have the same level and pattern of fertility as the total population of a country throughout the projection period. The changes in fertility over time follow the U.N. medium variant assumptions.

Migration

The main scenario assumes constant religion-specific out-migration rates by age, sex and destination matrices by sex and religion calculated for the baseline period; this procedure is described in the previous section. The out-migration rates are based on the 2005-2010 time period. Because of the significant drop in migration experienced during the recent financial recession after 2008, migration rates were decreased by 25% for most countries and up to 50% for a handful of countries, as noted earlier in the Methodology. This provides for a more conservative approach for migration’s influence on religious change around the world. In each iterative time period of the projections, out-migration and immigration flows are calculated by age, sex and religion based on the baseline rates and destination matrices.

Another migration scenario assumes no migration in the world. By way of comparison, this scenario highlights the effect of migration on the religious composition of countries under consideration.

Religious Switching

The main projection scenario includes constant switching rates from the baseline estimates. Those rates are used to calculate the flow of people in certain age and sex groups who move from one religion to another at each five-year interval of the projections. The main scenario models switching in 70 countries for which recent estimates of switching were available. Another scenario models switching in an additional 85 countries, as described in Chapter 1. A third scenario models what would happen if people do not change their religion during their lifetimes.

In countries for which switching data are available, researchers generated recent rates of switching. The main projection model assumes that emerging cohorts will switch from their childhood status at the same rate observed in recent survey data. As new cohorts progress from ages 15 to 29 in the projections, they experience these rates of change. For example, if 20% of the adults measured in a recent survey say that they grew up Christian but are now unaffiliated, the model projects that 20% of Christian children ages 10-14 will disaffiliate by the time they are ages 30-34.98 The model takes into account recent patterns of switching in all directions, which may be partially offsetting.

For projection purposes, each person was allowed one switch, which is all that is directly measured in the surveys this method draws upon. Though this does not capture the complexity of individual religious identity and switching, it captures aggregate patterns of change.

Life Expectancy

Based on the United Nations’ medium scenario assumptions (U.N. 2011), this study projects that life expectancy at birth will gradually increase in all countries. There is no high, medium or low assumption because each country, regardless of its current economic condition, is assumed to be moving toward better living standards and, therefore, longer life expectancy at birth. Following the 2010 revision of U.N. projection assumptions (U.N. 2011), gender-specific differences in mortality are introduced based on the U.N. assumptions of life expectancy by sex.

Disclaimers

Since religious change previously has never been projected on this scale, some cautionary words are in order. Population projections are estimates built on current population data and assumptions about demographic trends, such as declining birth rates and rising life expectancies in particular countries. The projections are what will occur if the current data are accurate and the trends play out as expected. But many events – scientific discoveries, armed conflicts, social movements, political upheavals, natural disasters and changing economic conditions, to name just a few – can shift demographic trends in unforeseen ways. Because of unforeseeable events or demographic changes, the projections are limited to a 40-year time frame.

Another limitation of this study is that current patterns of religious switching are available for only 70 countries, which constitute 43% of the world’s population. The most populous omissions are China and India. While there are insufficient data to directly measure individual change in religious identity in India, cohort-based analysis of Indian census and survey data does not provide evidence that switching per se is leading to net change in the size of religious groups in the country. In China, about 5% of the population is estimated to be Christian at present, and more than 50% is religiously unaffiliated. Because reliable figures on religious switching in China are not available, the projections do not contain any forecast for conversions in the world’s most populous country. But if Christianity expands rapidly in China in the decades to come – as some experts on China predict – then by 2050 the global number of Christians could be significantly higher than projected, and the decline in the percentage of the world’s population that is religiously unaffiliated could be even sharper. (See sidebar on China in Chapter 1.)

This study does not attempt to model how religious switching patterns may change in the future as countries experience changes in education, urbanization, political governance and economic development. It is uncertain how economic growth might impact levels of religious affiliation. Economic development could be accompanied by increasing rates of religious disaffiliation in countries that currently show little movement toward disaffiliation. However, it should not be taken for granted that all countries will follow a European pattern, in which religious disaffiliation increases following advanced economic development. There is no clear precedent for this sequence in a Muslim-majority country. In Hindu-majority India, religious affiliation remains almost universal even as the country is experiencing major social changes. And while it is difficult to assess religious change in China from the available data, religious identification seems to have increased as the country has developed economically.99

Additional Notes

Sources for China Data

For most countries, estimates for the size of the eight religious groups are based on one or two primary sources. However, the estimates for China come from several sources, since data on religion in China are deficient.100 The following descriptions summarize the various sources used to estimate the size of each religious group in China.

Muslims

Most Chinese Muslims belong to one of several ethnic groups that are overwhelmingly Muslim. The 2000 Chinese census included a measure on ethnicity. While not all members of these ethnic groups would necessarily identify as Muslim, the census figures provide a reasonable and generally accepted approximation of the size of China’s Muslim population.

Christians

Because there is some evidence that Chinese Christians may underreport their religious identity on public opinion surveys, the Pew Research Center reviewed multiple sources to arrive at an approximation of the size of China’s Christian population. For details, see Appendix C: Methodology for China, in the Pew Research Center’s December 2011 report “Global Christianity.”

Hindus and Jews

Members of these two religious groups in China are predominantly expatriates and are relatively few in number.101 The Pew Research Center’s estimates for Hindus and Jews in China rely primarily on the World Religion Database.

Buddhists, Adherents of Other Religions, Adherents of Folk Religions and the Religiously Unaffiliated

Estimates for these four religious groups are based on an analysis of the 2007 Spiritual Life Study of Chinese Residents by Pew Research Center staff.102 Estimates of the size of the Buddhist population and the number of members of other religions – the largest being Taoism – come directly from the 2007 study.

Folk Religions

[A Treatise on Religion and Myth]

Religiously Unaffiliated

The unaffiliated are all who do not identify with one of the other religions.

Differences Between Current Estimates and Previous Pew Research Center Estimates

Estimates of the religious composition of a few countries have changed since the Pew Research Center published its 2012 report on the size and distribution of the world’s major religious groups as of 2010, “The Global Religious Landscape.” Researchers obtained new or updated data for the following countries: Bangladesh, Finland, Kosovo, Mali, Mauritius, Portugal, Serbia, Switzerland and the United Kingdom. In addition, this report reflects the dissolution of the Netherlands Antilles into Curaçao, Sint Maarten and the Caribbean Netherlands.

The Pew Research Center’s 2011 report “The Future of the Global Muslim Population” found that India had the third-largest Muslim population, after Indonesia and Pakistan. However, this report finds that India has the second-largest Muslim population. The 2011 report used country population estimates from the 2008 revision of the United Nations’ World Population Prospects, which estimated Pakistan’s total 2010 population to be 184.8 million. This report relies on the 2010 revision of World Population Prospects data, in which Pakistan’s total 2010 population is estimated to be 173.6 million. In addition to lowering its estimate for Pakistan, the U.N. Population Division also raised its estimate of India’s total population between the 2008 and 2010 World Population Prospects. Meanwhile, the current round of Pakistan’s population census has experienced many delays. Preliminary population estimates from Pakistan’s 2011 housing census suggest the population could be substantially greater than estimated in the 2010 World Population Prospects data (197.4 million, according to a report in the Times of India). But the reliability of the preliminary estimates has been publicly contested.

In the Pew Research Center’s 2011 report “Global Christianity,” the region with the largest Christian population was the Americas. However, as described in the region note below, this report divides the Americas into two regions (North America and the Latin America-Caribbean region). While the combined regions would still have the largest Christian population in the world, among the six regions used in this report, Europe becomes the region with the largest Christian population.103

A Note on Regions

This report groups 234 countries and territories into six major regions: Asia and the Pacific, Europe, Latin America and the Caribbean, the Middle East and North Africa, North America and sub-Saharan Africa. (Some previous Pew Research Center reports grouped the world into five regions; North America and the Latin America-Caribbean region were grouped together as the Americas.)
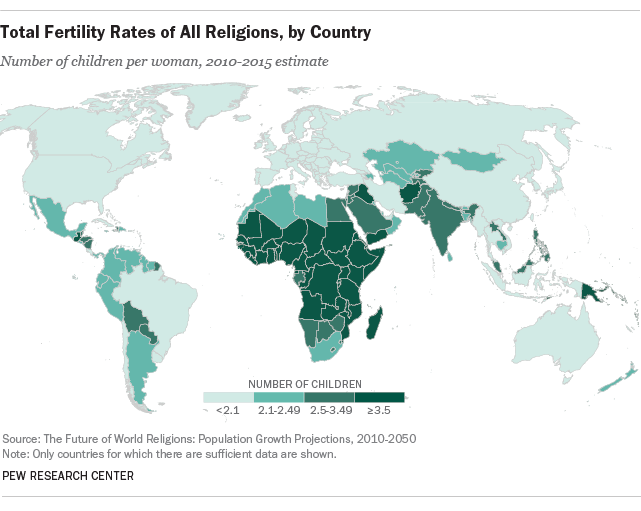
The 60 countries and territories in the Asia and the Pacific region are: Afghanistan, American Samoa, Armenia, Australia, Azerbaijan, Bangladesh, Bhutan, Brunei, Burma (Myanmar), Cambodia, China, Cook Islands, Cyprus, Federated States of Micronesia, Fiji, French Polynesia, Guam, Hong Kong, India, Indonesia, Iran, Japan, Kazakhstan, Kiribati, Kyrgyzstan, Laos, Macau, Malaysia, Maldives, Marshall Islands, Mongolia, Nauru, Nepal, New Caledonia, New Zealand, Niue, North Korea, Northern Mariana Islands, Pakistan, Palau, Papua New Guinea, the Philippines, Samoa, Singapore, Solomon Islands, South Korea, Sri Lanka, Taiwan, Tajikistan, Thailand, Timor-Leste, Tokelau, Tonga, Turkey, Turkmenistan, Tuvalu, Uzbekistan, Vanuatu, Vietnam and Wallis and Futuna.

The 50 countries and territories in Europe are: Albania, Andorra, Austria, Belarus, Belgium, Bosnia-Herzegovina, Bulgaria, Channel Islands, Croatia, Czech Republic, Denmark, Estonia, Faeroe Islands, Finland, France, Georgia, Germany, Gibraltar, Greece, Hungary, Iceland, Ireland, Isle of Man, Italy, Kosovo, Latvia, Liechtenstein, Lithuania, Luxembourg, Malta, Moldova, Monaco, Montenegro, Netherlands, Norway, Poland, Portugal, Republic of Macedonia, Romania, Russia, San Marino, Serbia, Slovakia, Slovenia, Spain, Sweden, Switzerland, Ukraine, United Kingdom and Vatican City.

The 48 countries and territories in Latin America and the Caribbean are: Anguilla, Antigua and Barbuda, Argentina, Aruba, Bahamas, Barbados, Belize, Bolivia, Brazil, British Virgin Islands, Caribbean Netherlands, Cayman Islands, Chile, Colombia, Costa Rica, Curacao, Cuba, Dominica, Dominican Republic, Ecuador, El Salvador, Falkland Islands (Malvinas), French Guiana, Grenada, Guadeloupe, Guatemala, Guyana, Haiti, Honduras, Jamaica, Martinique, Mexico, Montserrat, Nicaragua, Panama, Paraguay, Peru, Puerto Rico, Sint Maarten, St. Kitts and Nevis, St. Lucia, St. Vincent and the Grenadines, Suriname, Trinidad and Tobago, Turks and Caicos Islands, U.S. Virgin Islands, Uruguay and Venezuela.

The 20 countries and territories of the Middle East and North Africa are: Algeria, Bahrain, Egypt, Iraq, Israel, Jordan, Kuwait, Lebanon, Libya, Morocco, Oman, the Palestinian territories, Qatar, Saudi Arabia, Sudan, Syria, Tunisia, United Arab Emirates, Western Sahara and Yemen.

The five countries and territories of North America are: Bermuda, Canada, Greenland, St. Pierre and Miquelon and the United States.

The 51 countries and territories of sub-Saharan Africa are: Angola, Benin, Botswana, Burkina Faso, Burundi, Cameroon, Cape Verde, Central African Republic, Chad, Comoros, Democratic Republic of the Congo, Djibouti, Equatorial Guinea, Eritrea, Ethiopia, Gabon, Gambia, Ghana, Guinea, Guinea-Bissau, Ivory Coast, Kenya, Lesotho, Liberia, Madagascar, Malawi, Mali, Mauritania, Mauritius, Mayotte, Mozambique, Namibia, Niger, Nigeria, Republic of the Congo, Reunion, Rwanda, Sao Tome and Principe, Senegal, Seychelles, Sierra Leone, Somalia, South Africa, South Sudan, St. Helena, Swaziland, Tanzania, Togo, Uganda, Zambia and Zimbabwe.

A Note on Country and Territory Designation

The word “country” in this report includes countries recognized as such by the United Nations. The word “territory” in this report does not have a technical definition, but rather is a general term for distinct geographical entities not recognized as countries by the United Nations but that have separate population estimates reported by the U.N. Territories in this report include such entities as Hong Kong and Macau (special administrative regions of China), Greenland (an autonomous constituent country within the Kingdom of Denmark) and the Commonwealth of Puerto Rico (an unincorporated territory of the United States).

A Note on Rounding

In this report, estimates of 9,999 persons or fewer are identified as “<10,000.” All other count estimates in tables are rounded to the nearest 10,000. In the narrative of the report, many estimates are rounded to the nearest million or percentage point.

Country and Territory Projection Categories

Formal projections were made for 198 countries. In the main scenario, data on religious switching were available for 70 countries. In an additional scenario, described in Chapter 1 of this report, switching data from similar countries were used as a proxy to estimate switching in an additional 85 countries. For example, in this scenario, switching rates from the United States were used to estimate switching patterns in Canada. In 43 countries, religious switching was not estimated in any projection scenario. Formal projections were not carried out for 36 countries and territories, though estimates from these countries are included in regional and global totals throughout this report.

Countries With Religious Switching Data

The 70 countries and territories with available switching data are: Albania, Australia, Austria, Bangladesh, Belgium, Bosnia-Herzegovina, Botswana, Brazil, Cameroon, Chad, Chile, Croatia, Czech Republic, Denmark, Dominican Republic, Egypt, Ethiopia, Finland, France, Germany, Ghana, Hungary, Indonesia, Iraq, Ireland, Italy, Japan, Jordan, Kazakhstan, Kenya, Kyrgyzstan, Latvia, Lebanon, Liberia, Malaysia, Mali, Mexico, Morocco, Mozambique, Netherlands, New Zealand, Niger, Nigeria, Norway, Pakistan, Palestinian territories, Poland, Portugal, Russia, Rwanda, Senegal, Slovakia, Slovenia, South Africa, South Korea, Spain, Sri Lanka, Sweden, Switzerland, Taiwan, Tajikistan, Tanzania, Tunisia, Uganda, Ukraine, United Kingdom, United States, Uruguay, Venezuela and Zambia.

Countries in Extra Switching Scenario

The 85 countries and territories in the extra switching scenario are: Angola, Argentina, Aruba, Bahamas, Barbados, Belarus, Belize, Benin, Bolivia, Bulgaria, Burkina Faso, Canada, Central African Republic, Channel Islands, Colombia, Costa Rica, Cuba, Ecuador, El Salvador, Equatorial Guinea, Eritrea, Federated States of Micronesia, Fiji, French Guiana, French Polynesia, Gabon, Gambia, Greece, Grenada, Guadeloupe, Guam, Guatemala, Guinea, Haiti, Honduras, Hong Kong, Iceland, Iran, Ivory Coast, Jamaica, Kuwait, Lesotho, Libya, Lithuania, Luxembourg, Macau, Madagascar, Malawi, Maldives, Malta, Martinique, Mauritania, Moldova, Montenegro, New Caledonia, Nicaragua, Oman, Panama, Paraguay, Peru, Puerto Rico, Qatar, Republic of Macedonia, Republic of the Congo, Reunion, Romania, Samoa, Saudi Arabia, Sierra Leone, Singapore, Solomon Islands, South Sudan, St. Lucia, St. Vincent and the Grenadines, Sudan, Syria, Togo, Tonga, Turkmenistan, U.S. Virgin Islands, United Arab Emirates, Vanuatu, Western Sahara, Yemen and Zimbabwe.

Countries With No Switching Modeled

The 43 countries and territories that were projected but lack switching data are: Afghanistan, Algeria, Armenia, Azerbaijan, Bahrain, Bhutan, Brunei, Burma (Myanmar), Burundi, Cambodia, Cape Verde, China, Comoros, Cyprus, Democratic Republic of the Congo, Djibouti, Estonia, Georgia, Guinea-Bissau, Guyana, India, Israel, Kosovo, Laos, Mauritius, Mayotte, Mongolia, Namibia, Nepal, North Korea, Papua New Guinea, Philippines, Sao Tome and Principe, Serbia, Somalia, Suriname, Swaziland, Thailand, Timor-Leste, Trinidad and Tobago, Turkey, Uzbekistan and Vietnam.

Countries Not Formally Projected

The 36 countries and territories that were not formally projected due to their small population size and lack of sufficient input data are: American Samoa, Andorra, Anguilla, Antigua and Barbuda, Bermuda, British Virgin Islands, Caribbean Netherlands, Cayman Islands, Cook Islands, Curacao, Dominica, Faeroe Islands, Falkland Islands (Malvinas), Gibraltar, Greenland, Isle of Man, Kiribati, Liechtenstein, Marshall Islands, Monaco, Montserrat, Nauru, Niue, Northern Mariana Islands, Palau, San Marino, Seychelles, Sint Maarten, St. Helena, St. Kitts and Nevis, St. Pierre and Miquelon, Tokelau and Turks and Caicos Islands.