
Pew Research Center

FOR RELEASE JANUARY 14, 2014

Religious Hostilities Reach Six-Year High

A third of the 198 countries studied had a high or very high level of social hostilities involving religion in 2012. About three-in-ten countries had a high or very high level of government restrictions on religion, roughly the same as in 2011.

FOR MEDIA OR OTHER INQUIRIES:

Communications Department
202.419.4372
www.pewresearch.org

RECOMMENDED CITATION

Pew Research Center, January 2014, "Religious Hostilities Reach Six-Year High"

About Pew Research Center

Pew Research Center is a nonpartisan, nonadvocacy fact tank that informs the public about the issues, attitudes and trends shaping the world. It does not take policy positions. The Center conducts public opinion polling, demographic research, computational social science research and other data-driven research. It studies politics and policy; news habits and media; the internet and technology; religion; race and ethnicity; international affairs; social, demographic and economic trends; science; research methodology and data science; and immigration and migration. Pew Research Center is a subsidiary of The Pew Charitable Trusts, its primary funder.

© Pew Research Center 2026

Table of contents

  • About Pew Research Center
  • Religious Hostilities Reach Six-Year High
  • Preface
  • Appendix 1: Methodology
  • Appendix 2: Government Restrictions Index
  • Appendix 3: Social Hostilities Index

Religious Hostilities Reach Six-Year High

A third of the 198 countries studied had a high or very high level of social hostilities involving religion in 2012. About three-in-ten countries had a high or very high level of government restrictions on religion, roughly the same as in 2011.

RestrictionsVpromo_640x300

restrict-5-1

The share of countries with a high or very high level of social hostilities involving religion reached a six-year peak in 2012, according to a new study by the Pew Research Center. A third (33%) of the 198 countries and territories included in the study had high religious hostilities in 2012, up from 29% in 2011 and 20% as of mid-2007. Religious hostilities increased in every major region of the world except the Americas. The sharpest increase was in the Middle East and North Africa, which still is feeling the effects of the 2010-11 political uprisings known as the Arab Spring.1 There also was a significant increase in religious hostilities in the Asia-Pacific region, where China edged into the “high” category for the first time. The share of countries with a high or very high level of government restrictions on religion stayed roughly the same in the latest year studied. About three-in-ten countries in the world (29%) had a high or very high level of government restrictions in 2012, compared with 28% in 2011 and 20% as of mid-2007. Europe had the biggest increase in the median level of government restrictions in 2012, followed closely by the Middle East-North Africa – the only other region where the median level of government restrictions on religion rose. Looking at the overall level of restrictions – whether resulting from government policies or from social hostilities – the study finds that restrictions on religion are high or very high in 43% of countries, also a six-year high. Because some of these countries (like China) are very populous, more than 5.3 billion people (76% of the world’s population) live in countries with a high or very high level of restrictions on religion, up from 74% in 2011 and 68% as of mid-2007.

restrict-5-2

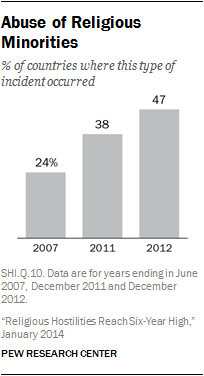
Among the world’s 25 most populous countries, Egypt, Indonesia, Russia, Pakistan and Burma (Myanmar) had the most restrictions on religion in 2012, when both government restrictions and social hostilities are taken into account. As in the previous year, Pakistan had the highest level of social hostilities involving religion, and Egypt had the highest level of government restrictions on religion. Social hostilities related to religion in Burma (Myanmar) rose to the “very high” level for the first time in the study. During the latest year studied, there also was an increase in the level of harassment or intimidation of particular religious groups. Indeed, two of the seven major religious groups monitored by the study – Muslims and Jews – experienced six-year highs in the number of countries in which they were harassed by national, provincial or local governments, or by individuals or groups in society. As in previous years, Christians and Muslims – who together make up more than half of the global population – were harassed in the largest number of countries (110 and 109, respectively). This is the fifth time the Pew Research Center has reported on religious restrictions around the globe. (See About the Study section.) The new study scores 198 countries and territories on the same 10-point indexes used in the previous studies:

  • The Government Restrictions Index (GRI) measures government laws, policies and actions that restrict religious beliefs and practices. The GRI is comprised of 20 measures of restrictions, including efforts by governments to ban particular faiths, prohibit conversions, limit preaching or give preferential treatment to one or more religious groups.
  • The Social Hostilities Index (SHI) measures acts of religious hostility by private individuals, organizations or groups in society. This includes religion-related armed conflict or terrorism, mob or sectarian violence, harassment over attire for religious reasons or other religion-related intimidation or abuse. The SHI includes 13 measures of social hostilities.2

Increases in Social Hostilities
restrict-5-3

[in Libya]

restrict-5-4

The study finds that the share of countries where violence, or the threat of violence, was used to compel people to adhere to religious norms also increased in 2012. Such actions occurred in 39% of countries, up from 33% in 2011 and 18% as of mid-2007. In Vietnam, for instance, the managing council of the government-recognized Cao Dai religion, a syncretistic religious movement that originated in Vietnam in the 20th century, orchestrated an assault on followers of an unsanctioned Cao Dai group in September 2012, injuring six. The head of the Cao Dai managing council said the reason for the assault was that the followers of the unsanctioned group were not worshipping according to the dictates of the council.3 In addition to new instances of violence, efforts to enforce religious norms intensified in other countries. In India, members of a Hindu nationalist organization, Hindu Jagarana Vedike, enforced a morality code, including an attack on young men and women for allegedly drinking and dancing at a birthday party in the state of Karnataka in July.4 And in parts of Somalia under the control of the Islamic militant group al-Shabab, the group continued to ban cinemas, music, smoking, shaving beards and other behavior it views as “un-Islamic.” The group reportedly beheaded a 24-year-old man in Barawa in November 2012 after accusing him of converting to Christianity.5

restrict-5-5

The new Pew Research Center study finds that harassment of women over religious dress occurred in nearly a third of countries in 2012 (32%), up from a quarter in 2011 (25%) and less than one-in-ten (7%) as of mid-2007. In China, for instance, a Han Chinese man accosted a Uighur Muslim girl in Henan province and lifted her veil in November 2012. In response, violent protests broke out as hundreds of Uighurs demonstrated against the incident.6 And in Moldova, two men attacked a Muslim woman in the capital city of Chisinau, calling her a “terrorist” and tearing her headscarf.7

restrict-5-6

Mob violence related to religion occurred in a quarter of countries in 2012 (25%), up from 18% in 2011 and 12% as of mid-2007. In May 2012, for instance, a Muslim mob in Kenya attacked and killed two pastors who were visiting a Christian who had converted from Islam.8 Mob violence also escalated in Indonesia, as Muslim groups targeted houses of worship, religious schools and homes of other Muslims they deemed “unorthodox,” according to the U.S. Department of State. In August 2012, for instance, some 500 Sunni hard-liners attacked a Shia community in the city of Sampang, killing two people, burning dozens of homes and displacing hundreds of people.9 And in Nigeria, hundreds of Muslim youths attacked and burned Christian businesses and places of worship in November 2012 after a Christian was accused of blasphemy. Four Christians were killed.10

restrict-5-7

Religion-related terrorist violence occurred in about a fifth of countries in 2012 (20%), roughly the same share as in 2011 (19%) but up markedly from 2007 (9%). In March 2012, a rabbi and three Jewish children were killed by an Islamist extremist at a Jewish school in Toulouse, France.11 In the United States, an August 2012 shooting at a Sikh temple in Wisconsin left six worshippers dead and three others wounded.12 In some countries where there had previously been religion-related terrorist attacks, these attacks escalated. The widely covered 2013 al-Shabab attack on a Nairobi mall (which falls outside the date range studied in this analysis), for instance, was part of a steady increase in religion-related terrorism in Kenya. In July and November 2012, militants attacked churches near the Kenya-Somalia border with grenades and gunfire, leaving more than a dozen dead and more than 50 wounded.13

restrict-5-8

The new study finds that the share of countries experiencing sectarian violence rose last year, continuing a trend noted in the previous report in this series.14 Sectarian violence was reported in nearly one-fifth of the world’s countries in 2012 (18%), up from 15% in 2011 and 8% as of mid-2007. In China, for example, sectarian tensions escalated into violence in October 2012 when Tibetan Buddhist monks led an attack against Hui Muslims at a site where a new mosque was being built in Gansu province.15 Ongoing sectarian violence also continued unabated in some countries in 2012. In Burma (Myanmar), for instance, communal violence between Rohingya Muslims and Rakhine Buddhists has resulted in hundreds of deaths and displaced more than 100,000 people from their homes.16 In Syria, the ongoing civil war has fallen partly along sectarian lines, leaving tens of thousands dead and displacing millions in recent years.17 And in Iraq, sectarian strife between Sunni and Shia Muslims continued, and attacks of some kind continued to occur on an almost daily basis.18

Government Restrictions Stayed Roughly the Same

The overall level of government restrictions worldwide stayed roughly the same. There were some increases on a few measures. The study finds that the share of countries where some level of government interfered with worship or other religious practices increased to 74% in 2012, up from 69% in 2011 and 57% in the baseline year. In Tuvalu, for instance, the central government began enforcing a law that prevents unapproved religious groups from holding public meetings.19 According to the study, public preaching by religious groups was restricted by governments in 38% of countries in 2012, up from 31% in 2011 and 28% as of mid-2007. In Tunisia, for instance, authorities made efforts to remove imams suspected of preaching what were seen as divisive theologies, including Salafism.20 Governments used force against religious groups or individuals in nearly half (48%) of the world’s countries in 2012, up from 41% in 2011 and 31% as of mid-2007. In April 2012 in Mauritania, for instance, “the government arrested 12 anti-slavery activists and charged them with sacrilege and blasphemy, along with other civil charges, for publicly burning religious texts to denounce what the activists viewed as support for slavery in Islamic commentary and jurisprudence,” according to the U.S. Department of State.21

Countries With Very High Social Hostilities Involving Religion

In the latest year studied, the number of countries with very high religious hostilities rose from 14 to 20, an increase of more than 40%. Six countries had very high social hostilities in 2012 but not in 2011: Syria, Lebanon, Sri Lanka, Bangladesh, Thailand and Burma (Myanmar). And every country that had very high social hostilities in 2011 continued to have very high hostilities in 2012. (See table below.) Meanwhile, 76 countries (38%) had low levels of religious hostilities in 2012, down from 87 (44%) in 2011. (For a complete list of all countries in each category, see the Social Hostilities Index table.)

restrict-5-9

Countries With Very High Government Restrictions on Religion

The number of countries with very high government restrictions rose from 20 in 2011 to 24 in 2012, an increase of 20%. Five countries had very high government restrictions in 2012 but not in 2011: Azerbaijan, Tajikistan, Morocco, Iraq and Kazakhstan. Just one country that had very high government restrictions in 2011 – Yemen – did not have very high restrictions in 2012. (See table below.) Meanwhile, 97 countries (49%) had low levels of government restrictions in 2012, down from 100 (51%) in 2011. (For a complete list of all countries in each category, see the Government Restrictions Index table.)

restrict-5-10

Changes in Social Hostilities

restrict-5-11

In addition to scoring countries on both indexes, the study looks at the extent and direction of change in the level of social hostilities involving religion within each country between 2011 and 2012. Eleven countries (6%) had large changes (2.0 points or more) in their scores on the 10-point Social Hostilities Index, and all 11 (Mali, Libya, Mexico, Tunisia, Syria, Guinea, Netherlands, Madagascar, Lebanon, Afghanistan and Malawi) were in the direction of increased hostilities. In northern Mali, for example, Islamist extremists implemented harsh penalties under sharia law, including executions, amputations and flogging. They also destroyed churches and banned baptisms and circumcisions. Hundreds of Christians fled to the southern part of the country during the year.22 In Afghanistan, violent protests broke out at Kabul University after Sunni Muslim students attempted to prevent Shia Muslim students from performing Ashura holiday rituals in November 2012, resulting in two deaths and several injuries.23 Among countries with modest changes (1.0 to 1.9 points), 28 had increases (14%).24 In some cases, changes of less than 2.0 points are notable. For example, Somalia’s score on the SHI increased from 7.8 in 2011 to 9.5 in 2012. This means that each of the 13 types of social hostilities involving religion was present in Somalia in 2012, including religion-related war and terrorism, mob violence, hostility over religious conversion, harassment of women for violating religious dress codes, and all six types of malicious acts and crimes inspired by religious bias: harassment and intimidation, displacement from homes, destruction of religious property, abductions, physical abuse and killings. In the seven countries with decreases of 1.0 to 1.9 points (Timor-Leste, Ivory Coast, Serbia, Ethiopia, Cyprus, Romania and Cambodia), some hostilities that occurred in 2011 did not reoccur in 2012. In Cambodia, for instance, violent conflict over land surrounding the ancient Hindu temple of Preah Vihear occurred during the first half of 2011, but no violence was reported in 2012.25 And in Ethiopia, there were no reported outbreaks of mob violence similar to the one that took place in March 2011, when hundreds of Muslim extremists destroyed more than 60 evangelical Protestant homes and churches in the Oromia region.26 Among countries with small changes on the Social Hostilities Index (less than 1.0 point), 58 had increases (29%) and 45 had decreases (23%). Considering changes of one point or more in social hostilities from 2011 to 2012, 20% of countries had increases and 4% of countries had decreases. In 2011, by comparison, 14% of countries had increases of one point or more and 2% had decreases of one point or more.

Changes in Government Restrictions

restrict-5-12

This study also looks at the extent and direction of change in government restrictions on religion within each country between 2011 and 2012. Just two countries (1%) had large changes (2.0 points or more) in their scores on the 10-point Government Restrictions Index, one toward higher restrictions (Rwanda) and the other toward lower restrictions (Ivory Coast). In Rwanda, a new law regulating religious organizations went into effect during the year, introducing burdensome registration requirements and other restrictions.27 And in the Ivory Coast, as post-election violence subsided, there was a drop in religion-related assaults because the election violence fell largely along ethnic and religious lines.28 Among countries with modest changes (1.0 to 1.9 points), 13 had increases (7%) and six had decreases (3%).29 And among countries with small changes (less than 1.0 point), 80 had increases (40%) and 56 had decreases (28%). Considering changes of one point or more in government restrictions from 2011 to 2012, 8% of countries had increases and 4% of countries had decreases. The level of increase in government restrictions during the latest year studied was about the same as the increase in the previous year, when 6% of countries had increases and 2% had decreases of one point or more.

Changes in Overall Restrictions

restrict-5-13

Considering government restrictions and social hostilities together, increases outnumbered decreases in each point range during the latest year studied. Among countries whose scores went up or down by 2.0 points or more on either of the indexes after taking into account any offsetting change on the other index, 11 increased and none decreased.30 Overall, restrictions increased at least somewhat in 61% of countries and decreased in 29% between 2011 and 2012. This is a slightly larger margin of difference than during the preceding year, when 60% of countries had increases and 35% had decreases.

Harassment of Specific Groups

restrict-5-14

The Government Restrictions Index and Social Hostilities Index each include a measure of the harassment of specific religious groups (GRI.Q.11 and SHI.Q.1.a). Harassment and intimidation by governments or social groups take many forms, including physical assaults; arrests and detentions; desecration of holy sites; and discrimination against religious groups in employment, education and housing. Harassment and intimidation also include things such as verbal assaults on members of one religious group by other groups or individuals. Harassment or intimidation of specific religious groups occurred in 166 countries in 2012, a six-year high. In 2012, government or social harassment of Muslims was reported in 109 countries; the previous high was 101 countries in the previous year of the study. Jews were harassed in 71 countries in 2012, slightly higher than the year before (69 countries, which was the previous high). Harassment of Christians continued to be reported in the largest number of countries (110), an increase from the previous year (105) but not a six-year high. There also was an increase in the number of countries in which Hindus, Buddhists and members of folk or traditional religions were harassed.

restrict-5-15

Overall, across the six years of this study, religious groups were harassed in a total of 185 countries at one time or another. Members of the world’s two largest religious groups – Christians and Muslims, who together comprise more than half of the global population – were harassed in the largest number of countries, 151 and 135, respectively.31 Jews, who comprise less than 1% of the world’s population, experienced harassment in a total of 95 countries, while members of other world faiths were harassed in a total of 77 countries. In 2012, some religious groups were more likely to be harassed by governments, while others were more likely to be harassed by individuals or groups in society. Jews, for instance, experienced social harassment in many more countries (66) than they faced government harassment (28). By contrast, members of other world faiths, such as Sikhs and Baha’is, were harassed by some level of government in more countries (35) than they were by groups or individuals in society (21).

restrict-5-16

Regions and Countries

Looking at the extent and direction of change on the Government Restrictions Index and the Social Hostilities Index together, increases of one point or more outnumbered decreases of that magnitude in all five regions. The Middle East-North Africa region and Europe had the largest share of countries with increases of one point or more (35% and 31%, respectively). The Americas had the lowest proportion of countries where overall restrictions increased by one point or more (3%). Asia and the Pacific and sub-Saharan Africa were the only regions where decreases of one point or more occurred.

restrict-5-17

Social Hostilities by Region

restrict-5-18

The median level of social hostilities involving religion increased in four of the five regions (the Middle East and North Africa, Asia and the Pacific, Europe and sub-Saharan Africa). It stayed roughly the same in the Americas. As in the previous years of the study, social hostilities involving religion were highest in 2012 across the Middle East and North Africa. The region’s median score on the Social Hostilities Index rose from 5.4 in 2011 to 6.4 in 2012, three times the global median (2.0). Religious hostilities increased in 15 of the 20 countries in the region and declined in only four. (One country, Qatar, had no change.) Four countries in the Middle East-North Africa region had scores that rose by two or more points: Libya (whose score rose from 1.9 in 2011 to 5.4 in 2012), Tunisia (3.5 to 6.8), Syria (5.8 to 8.8) and Lebanon (5.6 to 7.9). Among the social hostilities that went up in the region in the latest year studied were mob attacks, violent attacks on members of minority religious groups and efforts to prevent other religious groups from operating.32 In the Asia-Pacific region, the median score on the Social Hostilities Index rose from 2.2 in 2011 to 2.9 in 2012, rising further above the global median. Factors contributing to the increase included an uptick in sectarian violence, which was reported in 11 of the 50 countries in the region in 2012, up from seven countries in 2011. There also was an increase in the number of countries in the region reporting attempts by organized groups to dominate public life at the national level with their perspective on religion, violence to enforce religious norms and violence toward members of minority religious groups. China’s score rose to the “high” level of social hostilities for the first time in the study, moving from 2.2 in 2011 to 3.6 in 2012. Multiple types of social hostilities were present in China in 2012, including religion-related terrorism, harassment of women for religious dress, and mob violence and sectarian conflict. Europe’s median score on the Social Hostilities Index rose from 2.3 in 2011 to 2.7 in 2012, remaining above the global median. There was an increase in the number of European countries where harassment of women due to religious dress and violent attacks on members of minority religious groups were reported. Sub-Saharan Africa’s median score on the Social Hostilities Index rose from 1.5 in 2011 to 2.1 in 2012, slightly above the global median. Among the religious hostilities that were reported in a higher number of countries in the region were mob violence, enforcement of religious norms, violence against members of minority religious groups and harassment of women due to religious dress. The median level of social hostilities in the Americas remained low, 0.4 in 2012 and 0.6 in 2011, significantly lower than the global median (2.0). There was one country in the region with a noticeable increase in religious hostilities – Mexico – where the level of social hostilities went from “moderate” (3.2) to “high” (6.7).

restrict-5-19

Government Restrictions by Region

restrict-5-20

The median level of government restrictions on religion increased in two of the five regions (Middle East-North Africa and Europe) and decreased in two regions (Asia-Pacific and sub-Saharan Africa). It stayed the same in the Americas. In the latest year studied, the Middle East and North Africa continued to have the highest median level of government restrictions. The median score on the Government Restrictions Index for the 20 countries in the region rose from 5.9 in 2011 to 6.2 in 2012, much higher than the global median (2.4). Government restrictions increased in half of the countries in the region. For example, widespread government intimidation of religious groups was reported in 16 of the 20 countries, up from 13 countries in 2011.33 In the Asia-Pacific region, the median Government Restrictions Index score decreased from 4.2 in 2011 to 3.5 in 2012, though it remained above the global median. Among the government restrictions that decreased in the region were restrictions on foreign missionaries and government violence toward minority or unapproved religious groups. In Europe, the median score on the Government Restrictions Index rose from 2.2 in 2011 to 2.6 in 2012, rising just above the global median. Increases in government restrictions within the region included more reported limits on worship or religious practices, widespread harassment or intimidation of religious groups, violence against members of minority religious groups and restrictions on religious literature. Sub-Saharan Africa’s median score on the Government Restrictions Index declined slightly, from 1.9 in 2011 to 1.7 in 2012, remaining below the global median. Decreases in government restrictions included fewer limits on proselytizing and fewer restrictions on the work of foreign missionaries. There also were fewer reports that governments did not intervene in cases of religious discrimination. The Americas’ median score on the Government Restrictions Index stayed the same in 2012 (at 1.5), considerably below the global median. Government harassment or intimidation of religious groups was reported in 16 of the 35 countries in the Americas in 2012, down from 18 in 2011.

restrict-5-21

Restrictions and Hostilities in the Most Populous Countries: 2012

Among the world’s 25 most populous countries, Egypt, Indonesia, Russia, Pakistan and Burma (Myanmar) stand out as having the most restrictions on religion (as of the end of 2012) when both government restrictions and religious hostilities are taken into account. Brazil, the Philippines, Japan, South Africa and the Democratic Republic of the Congo have the least restrictions and hostilities. None of the 25 most populous countries had low social hostilities involving religion in 2012, while five had low government restrictions on religion: Brazil, South Africa, the Philippines, Japan and the Democratic Republic of the Congo. As discussed in a previous report, the United States moved from the low category of government restrictions as of mid-2009 to the moderate category in 2010, where it remained in 2012.34 Among the 25 most populous countries, Turkey was the only one in which the level of government restrictions increased by one full point or more, and Japan and Nigeria were the only two in which the level of government restrictions decreased by one point or more. The level of religious hostilities increased by one point or more in nine countries: Mexico, Turkey, China, Burma (Myanmar), Thailand, France, Vietnam, Bangladesh and Italy. Ethiopia was the only country among the 25 most populous where the level of religious hostilities decreased by one or more points during the same time period. (See Government Restrictions Index table and Social Hostilities Index table.)

Among the world’s 25 most populous countries, Egypt, Indonesia, Russia, Pakistan and Burma (Myanmar) stand out as having the most restrictions on religion when both government restrictions and social hostilities are taken into account. (Countries in the upper right of the chart have the most restrictions and hostilities.) Brazil, the Philippines, Japan, South Africa and the Democratic Republic of the Congo have the least restrictions and hostilities. (Countries in the lower left have the least restrictions and hostilities.)

[Note: this scatterplot has been updated to reflect scores from 2013, our latest report.]

About the Study

[PDF]

Preface

This is the fifth in a series of reports by the Pew Research Center analyzing the extent to which governments and societies around the world impinge on religious beliefs and practices. As part of the original study, published in 2009, Pew Research developed two indexes – a Government Restrictions Index and a Social Hostilities Index – that were used to gauge government restrictions on religion and social hostilities involving religion in nearly 200 countries and territories.

The initial report established a baseline for each country and five major geographic regions. Three follow-up reports looked at changes in the level of restrictions and hostilities in these countries and regions.

This new report looks at the extent and direction of change in government restrictions on religion and religious hostilities during calendar year 2012. Where appropriate, it also compares the situation in 2012 with the situation in the baseline year of the study (mid-2006 to mid-2007).

This is the second time Pew Research has analyzed restrictions on religion in a calendar year. Previous reports analyzed 12-month periods from July 1-June 30 (e.g., July 1, 2009-June 30, 2010). The shift to calendar years was made, in part, because most of the primary sources used in this study now are based on calendar years.

As we have noted in previous reports, it is important to keep in mind some limitations of this study. The indexes of government restrictions and social hostilities that serve as the basis of the study are designed to measure obstacles to religious expression and practice. As a result, the report focuses on the constraints on religion in each country and does not look at the other side of the coin: the amount of free or unhindered religious activity that takes place in particular countries. The study also does not attempt to determine whether restrictions are justified or unjustified, nor does it attempt to analyze the many factors – historical, demographic, cultural, religious, economic and political – that might explain why restrictions have arisen. It simply seeks to measure the restrictions that exist in a quantifiable, transparent and reproducible way, based on published reports from numerous governmental and nongovernmental organizations.

As was the case in the four previous reports, North Korea is not included in this study. The primary sources used in this study indicate that North Korea’s government is among the most repressive in the world, including toward religion. But because independent observers lack regular access to the country, the sources are unable to provide the kind of specific, timely information that formed the basis of this analysis.

The Pew Research Center’s work on global restrictions on religion is part of the Pew-Templeton Global Religious Futures project, which analyzes religious change and its impact on societies around the world. In addition to the four previous religious restrictions reports, other reports produced under this initiative, funded by The Pew Charitable Trusts and the John Templeton Foundation, include “The World’s Muslims: Religion, Politics and Society” (April 2013), “The Global Religious Landscape: A Report on the Size and Distribution of the World’s Major Religious Groups as of 2010” (December 2012), “The World’s Muslims: Unity and Diversity” (August 2012), “Faith on the Move: The Religious Affiliation of International Migrants” (March 2012), “Global Christianity: A Report on the Size and Distribution of the World’s Christian Population” (December 2011), “The Future of the Global Muslim Population: Projections for 2010-2030” (January 2011), “Tolerance and Tension: Islam and Christianity in Sub-Saharan Africa” (April 2010), and “Mapping the Global Muslim Population: A Report on the Size and Distribution of the World’s Muslim Population” (October 2009).

The principal researcher for this report was Brian J. Grim, a senior researcher and director of cross-national data at the Pew Research Center’s Religion & Public Life Project. He was assisted by associate director for editorial Sandra Stencel, research assistant Angelina Theodorou and data manager Juan Carlos Esparza Ochoa, as well as by several Georgetown University graduate and undergraduate students. For helping to recruit these very capable students, we are grateful to Georgetown’s Berkley Center for Religion, Peace, and World Affairs and its director, Professor Thomas Banchoff.

Alan Cooperman, Director of Religion Research

Appendix 1: Methodology

This is the fifth time the Pew Research Center has measured restrictions on religion around the globe.39 This report, which includes data for the year ending Dec. 31, 2012, follows the same methodology as previous reports.

Pew Research uses two 10-point indexes – the Government Restrictions Index (GRI) and the Social Hostilities Index (SHI) – to rate 198 countries and self-governing territories on their levels of restrictions.40 This report analyzes changes in restrictions on an annual basis, looking at six years ending mid-2007, mid-2008, mid-2009, mid-2010, Dec. 31, 2011, and Dec. 31, 2012. It categorizes the amount of change in each country’s scores in two ways, numerically and by percentile.

restrict5-app-1

First, countries are grouped into categories depending on the size of the numeric change in their scores from year to year on the two indexes: changes of two points or more in either direction; changes of at least one point but less than two points; changes of less than one point; or no change at all. (See chart at right and charts in Changes in Social Hostilities, Changes in Government Restrictions and Changes in Overall Restrictions sections of the report.)

Changes in overall levels of restrictions are calculated for each country by comparing its scores on both indexes (the GRI and the SHI) from year to year. When a country’s scores on the GRI and the SHI changed in the same direction (both increased or both decreased), the greater amount of change determined the category. For instance, if the country’s GRI score increased by 0.8 and its SHI score increased by 1.5, the country was put into the overall “1.0-1.9 increase” category. When a country’s score increased on one index but decreased on the other, the difference between the amounts of change determined the grouping. For example, if the country’s GRI score increased by 2.0 and its SHI score decreased by 1.5, the country went into the overall “0.1-0.9 increase” category. When a country’s score on one index stayed the same, the amount of change on the other index was used to assign the category.

restrict5-app-2

Second, this report categorizes the levels of government restrictions and social hostilities in each country by percentiles. As the benchmark, it uses the results from the baseline year (the year ending in mid-2007). Scores in the top 5% on each index in mid-2007 were categorized as “very high.” The next highest 15% of scores were categorized as “high,” and the following 20% were categorized as “moderate.” The bottom 60% of scores were categorized as “low.” See the table to the right for the index score thresholds as determined from the mid-2007 data. These thresholds are applied to all subsequent years of data.

Overview of Procedures

The methodology used by Pew Research to assess and compare restrictions on religion was developed by senior researcher and director of cross-national data Brian J. Grim in consultation with other members of the Pew Research Center staff, building on a methodology that Grim and Professor Roger Finke developed while at Penn State University’s Association of Religion Data Archives.41 The goal was to devise quantifiable, objective and transparent measures of the extent to which governments and societal groups impinge on the practice of religion. The findings were used to rate countries and self-governing territories on two indexes that are reproducible and can be periodically updated.

This research goes beyond previous efforts to assess restrictions on religion in several ways. First, Pew Research coded (categorized and counted) data from 18 published cross-national sources, providing a high degree of confidence in the findings. The Pew Research coders looked to the sources for only specific, well-documented facts, not opinions or commentary.

Second, Pew Research staff used extensive data-verification checks that reflect generally accepted best practices for such studies, such as double-blind coding (coders do not see each other’s ratings), inter-rater reliability assessments (checking for consistency among coders) and carefully monitored protocols to reconcile discrepancies among coders.

Third, the Pew Research coding took into account whether the perpetrators of religion-related violence were government or private actors. The coding also identified how widespread and intensive the restrictions were in each country.

Fourth, one of the most valuable contributions of the indexes and the questions used to construct them (see the section on “The Coding Instrument”) is their ability to chart change over time.

Countries and Territories

The 198 countries and self-administering territories covered by the study contain more than 99.5% of the world’s population. They include 192 of the 193 member states of the United Nations as of 2012 plus six self-administering territories – Kosovo, Hong Kong, Macau, the Palestinian territories, Taiwan and Western Sahara.42 Reporting on these territories does not imply any position on what their international political status should be, only recognition that the de facto situations in these territories require separate analysis.

Although the 198 countries and territories vary widely in size, population, wealth, ethnic diversity, religious makeup and form of government, the study does not attempt to adjust for such differences. Poor countries are not scored differently on the indexes than wealthy ones. Countries with diverse ethnic and religious populations are not “expected” to have more social hostilities than countries with more homogeneous populations. And democracies are not assessed more leniently or harshly than authoritarian regimes.

Information Sources

Pew Research identified 18 widely available, frequently cited sources of information on government restrictions and social hostilities involving religion around the world. This study includes three sources that were not used in the baseline report on religious restrictions. (See the “Primary Sources” section for more details on the new information sources.)

The primary sources, which are listed below, include reports from U.S. government agencies, several independent, nongovernmental organizations and a variety of European and United Nations bodies. Although most of these organizations are based in Western countries, many of them depend on local staff to collect information across the globe. As previously noted, Pew Research did not use the commentaries, opinions or normative judgments of the sources; the sources were combed only for factual information on specific policies and actions.

Primary Sources

1. Country constitutions

2. U.S. State Department annual reports on International Religious Freedom

3. U.S. Commission on International Religious Freedom annual reports

4. U.N. Special Rapporteur on Freedom of Religion or Belief reports

5. Human Rights First reports in first and second years of coding; Freedom House reports in third, fourth and fifth years of coding

6. Hudson Institute publication: “Religious Freedom in the World” (Paul Marshall)

7. Human Rights Watch topical reports

8. International Crisis Group country reports

9. United Kingdom Foreign & Commonwealth Office annual report on human rights

10. Council of the European Union annual report on human rights

11. Amnesty International reports

12. European Network Against Racism Shadow Reports

13. United Nations High Commissioner for Refugees reports

14. U.S. State Department annual Country Reports on Terrorism

15. Anti-Defamation League reports

16. U.S. State Department Country Reports on Human Rights Practices

17. Uppsala University’s Uppsala Conflict Data Program, Armed Conflict Database

18. Human Rights Without Frontiers “Freedom of Religion or Belief” newsletters

U.S. government reports with information on the situation in the United States

  • U.S. Department of Justice “Religious Freedom in Focus” newsletters and reports
  • FBI Hate Crime Reports

As noted, this study includes three sources that were not included in the Pew Research Center’s first report on global restrictions on religion: Freedom House reports; Uppsala University’s Armed Conflict Database; and the “Freedom of Religion or Belief” newsletters of Human Rights Without Frontiers.

The Freedom House reports have replaced Human Rights First reports, which have not been updated since mid-2008. The Uppsala Armed Conflict Database provides information on the number of people affected by religion-related armed conflicts, supplementing other sources. The Human Rights Without Frontiers “Freedom of Religion or Belief” newsletters have partially replaced the Hudson Institute publication, “Religious Freedom in the World” (by Paul Marshall), which has not been updated since its release in 2008. Human Rights Without Frontiers is a nongovernmental organization based in Brussels, with affiliated offices throughout the world. The Hudson Institute publication still offers useful background on certain standing laws but no longer provides information on new or changing restrictions.

In previous years, there were 19 sources used in the coding. However, in the most recent year of the study, the U.S. government’s Worldwide Incident Tracking System (WITS) became unavailable online. Despite the absence of the source, three of the remaining 18 sources have given a comprehensive account of the presence of religion-related terrorism: the International Crisis Group’s country reports, Uppsala University’s Uppsala Conflict Data Program Armed Conflict Database and the State Department’s annual Country Reports on Terrorism.

While some of the increases in religious restrictions noted in this study could reflect the use of more up-to-date and/or better information sources, Pew Research staff monitor the impact of source information variability each year and have found no evidence of overall informational bias. (For additional discussion, see the “Potential Biases.”)

The Coding Instrument

As explained in more detail below, Pew Research staff developed a battery of questions similar to a survey questionnaire. Coders consulted the primary sources in order to answer the questions separately for each country. While the State Department’s annual reports on International Religious Freedom generally contained the most comprehensive information, the other sources provided additional factual detail that was used to settle ambiguities, resolve contradictions and help in the proper scoring of each question.

The questionnaire, or coding instrument, generated a set of numerical measures on restrictions in each country. It also made it possible to see how government restrictions intersect with broader social tensions and incidents of violence or intimidation by private actors. The coding instrument with the list of questions used for this report is shown in the Summary of Results (PDF).

The coding process required the coders to check all the sources for each country. Coders determined whether each source provided information critical to assigning a score; had supporting information but did not result in new facts; or had no available information on that particular country. Multiple sources of information were available for all countries and self-administering territories with populations greater than 1 million. More than three-in-four of the countries and territories analyzed by the Pew Research Center were multi-sourced; only small, predominantly island, countries had a single source, namely, the State Department reports.

Coding the United States presented a special problem since it is not included in the State Department’s annual reports on International Religious Freedom. Accordingly, Pew Research coders also looked at reports from the U.S. Department of Justice and the FBI on violations of religious freedom in the United States, in addition to consulting all the primary sources, including reports by the United Nations, Human Rights Watch, Freedom House, the International Crisis Group and the U.K. Foreign & Commonwealth Office, many of which contain data on the United States.

The Coding Process

The Pew Research Center employed strict training and rigorous coding protocols to make its coding as objective and reproducible as possible. Coders worked directly under a senior researcher’s supervision, with additional direction and support provided by other Pew Research Center researchers. The coders underwent an intensive training period that included a thorough overview of the research objectives, information sources and methodology.

Countries were double-blind coded by two coders (coders did not see each other’s ratings), and the initial ratings were entered into an electronic document (coding instrument) including details on each incident. The coders began by filling out the coding instrument for each country using the information source that had the most comprehensive information, typically the State Department reports. The protocol for each coder was to answer every question on which information was available in the initial source. Once a coder had completed that process, he or she then turned to the other sources. As new information was found, this was also coded and the source duly noted. Whenever ambiguities or contradictions arose, the source providing the most detailed, clearly documented evidence was used.

After two coders had separately completed the coding instrument for a particular country, their scores were compared by a senior researcher. Areas of discrepancy were discussed at length with the coders and were reconciled in order to arrive at a single score on each question for each country. The data for each country were then combined into a master file, and the answers and substantiating evidence were entered into a database.

Throughout this process, the coding instrument itself was continually monitored for possible defects. The questions were designed to be precise, comprehensive and objective so that, based on the same data and definitions, the coding could be reliably reproduced by others with the same results.

Pew Research staff generally found few cases in which one source contradicted another. When contradictions did arise – such as when sources provided differing estimates of the number of people displaced due to religion-related violence – the source that cited the most specific documentation was used. The coders were instructed to disregard broad, unsubstantiated generalizations regarding abuses and to focus on reports that contained clear, precise documentation and factual details, such as names, dates and places where incidents occurred.

The data-verification procedures went beyond the inter-rater reliability statistics. They also involved comparing the answers on the main measures for each country with other closely related questions in the data set. This provided a practical way to test the internal reliability of the data.

Pew Research staff also checked the reliability of the coded data by comparing them with similar, though more limited, religious restrictions data sets. In particular, published government and social regulation of religion index scores are available from the Association of Religion Data Archives (for three years of data) and the Hudson Institute (for one year of data), which makes them ideal measures for cross-validation. The review process found very few significant discrepancies in the coded data; changes were made only if warranted by a further review of the primary sources.

Restriction of Religion Indexes

The Government Restrictions Index is based on 20 indicators of ways that national and local governments restrict religion, including through coercion and force. The Social Hostilities Index is based on 13 indicators of ways in which private individuals and social groups infringe on religious beliefs and practices, including religiously biased crimes, mob violence and efforts to stop particular religious groups from growing or operating. The study also counted the number and types of documented incidents of religion-related violence, including terrorism and armed conflict.

Government Restrictions Index

Coding multiple indicators makes it possible to construct a Government Restrictions Index of sufficient gradation to allow for meaningful cross-national comparisons. An additional advantage of using multiple indicators is that it helps mitigate the effects of measurement error in any one variable, providing greater confidence in the overall measure.

[PDF]

The GRI is a fine-grained measure created by adding the 20 items on a 0-to-10 metric, with zero indicating very low levels of government restrictions on religion and 10 indicating extremely high levels of restrictions. The 20 questions that form the GRI are coded in a standard scale from zero to one point, while gradations among the answers allowed for partial points to be given for lesser degrees of the particular government restriction being measured. The overall value of the index was calculated and proportionally adjusted – so that it had a maximum value of 10 and a possible range of zero to 10 – by dividing the sum of the variables by two.

Social Hostilities Index

In addition to government restrictions, violence and intimidation in societies also can limit religious beliefs and practices. Accordingly, Pew Research staff tracked more than a dozen indicators of social impediments on religion. Once again, coding multiple indicators made it possible to construct an index that shows gradations of severity or intensity and allows for comparisons among countries. The Summary of Results (PDF) contains the 13 items used by Pew Research staff to create the Social Hostilities Index.

The SHI was constructed by adding together the 13 indicators based on a 0-to-10 metric, with zero indicating very low impediments to religious beliefs and practices and 10 indicating extremely high impediments. The various questions that form the index are coded in a standard scale from zero to one point, while gradations among the answers allow for partial points to be given for lesser degrees of the particular hostilities being measured. The indicators were added together and set to have a possible range of zero to 10 by dividing the sum of the variables by 1.3.

Note on How Examples Are Coded

[PDF]

Note on the Effects of Consolidating to a New Database

For all six years of this study, information on the number, types and locations of incidents of government force and social violence toward religious groups as well as deference to religious authorities in matters of law were coded at the province level. (See “Example of Data Coding: India” (PDF) section of the December 2009 baseline report.) Each year, the province numbers were summed and put into separate country-level files. Since the publication of the August 2011 report, Pew Research staff have created a database that integrates all six years of province- and country-level data on religious restrictions. During this process, Pew Research staff reviewed any discrepancies between province files and the sums that had been transferred to the country files and made appropriate corrections. The adjustments made were relatively minor and had small effects on index scores for countries, on average less than 0.005 points on the 10-point indexes. Consolidating the six years of data into a database also entailed a review of the data on harassment of religious groups. In particular, instances of harassment from the year ending in mid-2007 were stored as open-ended questions, and in a few cases they were recoded to match the categories used in the subsequent years.

Note on Changing Time Period of Analysis

This new report looks at the extent and direction of change in government restrictions on religion and social hostilities involving religion during calendar year 2012. Where appropriate, it also compares the situation in 2012 with the situation in the baseline year of the study (mid-2006 to mid-2007).

This is the second time Pew Research has analyzed restrictions on religion in a calendar year. Previous reports analyzed 12-month periods from July 1-June 30 (e.g., July 1, 2009-June 30, 2010). The shift to calendar years was made, in part, because most of the primary sources used in this study are based on calendar years.

Because of the shift in time frame, this study does not report directly on incidents that occurred during the period from July 1-Dec. 31, 2010. While this misses some incidents that occurred during the second half of 2010, events that had an ongoing impact – such as a change to a country’s constitution or the outbreak of a religion-related war – were captured by the coding. Researchers for the study carefully reviewed the situation in each country and territory during this six-month period and made sure that restrictions with an ongoing impact were not overlooked.

Additional Analyses in the Study

As in the 2012 and 2013 reports, this study provides a summary of the number of countries where specific religious groups faced government or social harassment. This is essentially a cross-tabulation of GRI Q.11 (“Was there harassment or intimidation of religious groups by any level of government?”) and the first type of religious hatred or bias measured in SHI.Q.1.a. (“Did individuals face harassment or intimidation motivated by religious hatred or bias?”). For purposes of this study, the definition of harassment includes any mention in the primary sources of an offense against an individual or group based on religious identity. Such offenses may range from physical attacks and direct coercion to more subtle forms of discrimination. But prejudicial opinions or attitudes, in and of themselves, do not constitute harassment unless they are acted upon in a palpable way.

As noted above, this study provides data on the number of countries in which different religious groups are harassed or intimidated. But the study does not assess either the severity or the frequency of the harassment in each country. Therefore, the results should not be interpreted as gauging which religious group faces the most harassment or persecution around the world.

Religion-Related Terrorism and Armed Conflict

Terrorism and war can have huge direct and indirect effects on religious groups, including destroying religious sites, displacing whole communities and inflaming sectarian passions. Accordingly, Pew Research tallied the number, location and consequences of religion-related terrorism and armed conflict around the world, as reported in the same primary sources used to document other forms of intimidation and violence. However, war and terrorism are sufficiently complex that it is not always possible to determine the degree to which they are religiously motivated or state sponsored. Out of an abundance of caution, this study does not include them in the Government Restrictions Index. They are factored instead into the index of social hostilities involving religion, which includes one question specifically about religion-related terrorism and one question specifically about religion-related war or armed conflict. In addition, other measures in both indexes are likely to pick up spillover effects of war and terrorism on the level of religious tensions in society. For example, hate crimes, mob violence and sectarian fighting that occur in the aftermath of a terrorist attack or in the context of a religion-related war would be counted in the Social Hostilities Index, and laws or policies that clearly discriminate against a particular religious group would be registered on the Government Restrictions Index.

For the purposes of this study, the term “religion-related terrorism” is defined as premeditated, politically motivated violence perpetrated against noncombatant targets by subnational groups or clandestine agents that have some identifiable religious ideology or religious motivation. It also includes acts carried out by groups that have a nonreligious identity but target religious personnel, such as clergy. Readers should note that it is the political character and motivation of the groups, not the type of violence, that is at issue here. For instance, a bombing would not be classified as religion-related terrorism if there was no clearly discernible religious ideology or bias behind it unless it was directed at religious personnel. Religion-related war or armed conflict is defined as armed conflict (a conflict that involves sustained casualties over time or more than 1,000 battle deaths) in which religious rhetoric is commonly used to justify the use of force, or in which one or more of the combatants primarily identifies itself or the opposing side by religion.

Potential Biases

As noted earlier, the primary sources indicate that the North Korean government is among the most repressive in the world, including toward religion. But because independent observers lack regular access to North Korea, the sources are unable to provide the kind of specific, timely information that forms the basis of this report. Therefore, North Korea is not included on either index.

This raises two important issues concerning potential information bias in the sources. The first is whether other countries that limit outsiders’ access and that may seek to obscure or distort their record on religious restrictions were adequately covered by the sources. Countries with relatively limited access have multiple primary sources of information that the Pew Research Center used for its coding. Each is also covered by other secondary quantitative data sets on religious restrictions that have used a similar coding scheme, including earlier years of coded State Department report data produced by Grim at Penn State’s Association of Religion Data Archives (ARDA) project (four data sets); independent coding by experts at the Hudson Institute’s Center for Religious Liberty using indexes also available from ARDA (one data set); and content analysis of country constitutions conducted by the Becket Fund for Religious Liberty (one data set). Pew Research staff used these for cross-validation. Thus, contrary to what one might expect, even most countries that limit access to information tend to receive fairly extensive coverage by groups that monitor religious restrictions.

The second key question – the flipside of the first – is whether countries that provide freer access to information receive worse scores simply because more information is available on them. As described more fully in the methodology in the baseline report, Pew Research staff compared the length of State Department reports on freer-access countries with those of less-free-access countries. The comparison found that the median number of words was approximately three times as large for the limited-access countries as for the open-access countries. This suggests that problems in freer-access countries are generally not overreported in the State Department reports.

Only when it comes to religion-related violence and intimidation in society do the sources report more problems in the freer-access countries than in the limited-access ones. However, the Social Hostilities Index includes several measures – such as SHI.Q.8 (“Did religious groups themselves attempt to prevent other religious groups from being able to operate?”) and SHI.Q.11 (“Were women harassed for violating religious dress codes?”) – that are less susceptible to such reporting bias because they capture general social trends or attitudes as well as specific incidents. With these limitations in mind, it appears that the coded information on social hostilities is a fair gauge of the situation in the vast majority of countries and a valuable complement to the information on government restrictions.

Data on social impediments to religious practice can more confidently be used to make comparisons among countries with sufficient openness, which includes more than nine-in-ten countries covered in the coding. An analysis by Grim and Richard Wike, the Pew Research Center’s director of global attitudes research, tested the reliability of the State Department reports on social impediments to religious practice by comparing public opinion data with data coded from the reports in previous years by Grim and experts at Penn State. They concluded that “the understanding of social religious intolerance embodied in the State Department reports is comparable with the results of population surveys and individual expert opinion.”43

New Checks on Potential Biases

Information contained in the sources used in this study varies from year to year. Sometimes this variation is systematic. For instance, as described on page 39, some organizations do not continue to update their reports.

It is also possible that the information sources used in this study are getting better or worse at reporting government restrictions on religion and social hostilities involving religion, potentially biasing index scores over time. Pew Research staff tracked this potential problem in two ways. First, they assessed the amount of detail contained in the sources, and second, they tracked the global coverage of the sources.

Assessing the Amount of Detail Contained in the Sources

The amount of detail in reports – as judged by overall word count – varies from year to year in some reports. For instance, the amount of coverage in an International Crisis Group report can change depending on the severity of the conflict or crisis in a given country.

Pew Research staff have been particularly concerned, however, with the possibility of underreporting. Specifically, the length of the U.S. State Department’s annual reports on international religious freedom – the most comprehensive source used in this study – has been substantially reduced. As shown in the table on page 48, word counts for the State Department’s International Religious Freedom (IRF) reports decreased substantially between this study’s baseline year (July 1, 2006, to June 30, 2007) and the most recent year of this study (calendar year 2012).44

restrict5-app-3

The IRF report’s government sections were 24% shorter for the most recent year (254,016 words) than in the baseline year (332,517 words). In every region, the length of the government sections also has decreased since 2007, although the length increased in a few regions between 2011 and 2012.

The IRF report’s social sections were 16% shorter for the most recent year (60,081 words) than in the baseline year (71,682 words). Between 2011 and 2012, there was a slight decrease in the total amount of information available within the social sections, although the word count increased for three of the five regions (the Americas, Middle East-North Africa and sub-Saharan Africa).

The streamlined IRF reports tend to summarize incidents and trends rather than providing detailed lists of government restrictions and social hostilities, as they did in earlier reports. This introduces potential bias in the coding because coders record only concrete reports about specific government laws, policies and actions, as well as specific incidents of religious violence or intolerance by social groups; they do not rely on the commentaries or opinions of the sources.

Tracking the Global Coverage of the Sources

Beginning in the year ending in mid-2010, Pew Research staff have tracked the number of countries for which each source provided information on government restrictions on religion or social hostilities involving religion, as shown in the table on page 50. For instance, Human Rights Without Frontiers newsletters (source 19) provided pertinent information in fewer countries (67) in 2012 than in 2011 (70).

One possible sign of systematic bias would be if each source also declined in the number of countries where restrictions or hostilities were reported. But this was not the case. Seven of the sources provided information for a larger number of countries in the most recent year of the study than in the previous year, while 10 provided less coverage.

restrict5-app-4

Mexico Case Study

As part of a previous study, Pew Research staff also examined whether the primary sources portrayed an inaccurate picture of religious restrictions and hostilities in a country. To assess this – albeit in a limited fashion – Pew Research staff compared the results of coding government restrictions on religion and social hostilities involving religion in Mexico using (a) the 19 primary sources for that study with (b) content analysis of Spanish language news reports about religious restrictions and hostilities.

To make this comparison, Spanish-speaking Pew Research staff analyzed the content of articles with reports of government restrictions on religion and social hostilities involving religion from the Mexican daily newspaper La Jornada.45 The analysis covered time periods identical to two covered by the Pew Research study: the baseline year (July 1, 2006, to June 30, 2007) and the fourth year of this study (July 1, 2009, to June 30, 2010).

restrict5-app-5

La Jornada articles were selected for analysis if a headline made some reference to religion, in which case the article was coded using the same Government Restrictions Index (GRI) and Social Hostilities Index (SHI) questions used in this study. Specifically, the content analysis of La Jornada articles examined 18 of the 20 questions of the Government Restrictions Index and all 13 questions of the Social Hostilities Index. The two GRI questions excluded from the analysis were GRI.1 and GRI.2 because both related only to the constitution rather than to actions of the government or members and groups in society.

For instance, for the year ending in mid-2007, 10 La Jornada articles referred to some level of government using force toward religious groups (question GRI.Q.19), as shown in the table above. Content analysis of these 10 articles showed that the incidents affected 21 people or properties.46 For the year ending in mid-2010, five La Jornada articles referred to the use of government force toward religious groups, affecting a total of 112 people or properties. The information from the newspaper coincided with the coded scores from the sources used that year: that is, each had results within the range of 10-200 cases of government force.

The expectation at the start of this analysis was that a Mexican newspaper would have more reports of religious restrictions and hostilities than the study’s primary sources because a local source would be more aware of local incidents than the broader cross-national sources used by this study. Instead, the analysis found that the coded news from La Jornada was largely consistent with coding using this study’s primary sources.

While a similar comparison for other countries might not yield the same results – especially in countries where press freedom is more limited – this analysis provides some confirmation of the reliability of the Pew Research Center’s coding across years. This comparison also provides some evidence that the sources used by Pew Research in its coding neither over-estimated nor under-estimated the level of religious restrictions and hostilities in Mexico in the study’s baseline year and its fourth year. (More details on the comparison are available upon request.)

Appendix 2: Government Restrictions Index

–> The following table shows all 198 countries and territories in descending order of their scores on the Pew Research Center’s index of government restrictions on religion as of the end of 2012. Pew Research has not attached numerical rankings to the countries because there are numerous tie scores and the differences between the scores of countries that are close to each other on this table are not necessarily meaningful. This is particularly the case at the low end of the scale: The range of scores among the 57 countries in the Very High and High categories is greater than the range of scores among the 97 countries in the Low category. You can download the index as a PDF on the right under “Report Materials.”

Denotes an increase of one point or more from 2011 to 2012.

Denotes a decrease of one point or more from 2011 to 2012.

Very High
Scores 6.6 and Higher
  • Egypt
  • China
  • Iran
  • Saudi Arabia
  • Indonesia
  • Maldives
  • Afghanistan
  • Syria
  • Eritrea
  • Somalia*
  • Russia
  • Burma (Myanmar)
  • Uzbekistan
  • Malaysia
  • Azerbaijan
  • Tajikistan
  • Pakistan
  • Brunei
  • Morocco
  • Sudan
  • Algeria
  • Iraq
  • Kazakhstan
  • Vietnam
High
Scores 4.5 to 6.5
  • Mauritania
  • Kyrgyzstan
  • Bahrain
  • Israel
  • Turkey
  • Belarus
  • Yemen
  • Western Sahara
  • Qatar
  • Oman
  • Armenia
  • United Arab Emirates
  • Sri Lanka
  • Turkmenistan
  • Jordan
  • Laos
  • Libya
  • India
  • Ethiopia
  • Bangladesh
  • Singapore
  • Bulgaria
  • Rwanda
  • Tunisia
  • Kuwait
  • Bhutan
  • Greece
  • Cuba
  • Central African Republic
  • Belgium
  • Chad
  • Moldova
  • Nigeria
Moderate
Scores 4.5 to 6.5
  • Ukraine
  • Kenya
  • France
  • Djibouti
  • Angola
  • Romania
  • Venezuela
  • Mexico
  • Austria
  • Germany
  • United States
  • Serbia
  • Palestinian territories**
  • Thailand
  • Nepal
  • Tanzania
  • Mongolia
  • Slovakia
  • Madagascar
  • Bahamas
  • Tuvalu
  • Comoros
  • Iceland
  • Lebanon
  • Costa Rica
  • Denmark
  • Republic of Macedonia
  • United Kingdom
  • Zambia
  • Croatia
  • Guinea
  • Spain
  • Georgia
  • Nicaragua
  • Latvia
  • Italy
  • Equatorial Guinea
  • Hong Kong
  • Lithuania
  • Uganda
  • Zimbabwe
  • Cambodia
  • Hungary
  • Montenegro
Low
Scores 0.0 to 2.3
  • Antigua and Barbuda
  • Bosnia-Herzegovina
  • Norway
  • Fiji
  • Honduras
  • Seychelles
  • Poland
  • Jamaica
  • Swaziland
  • Peru
  • Cyprus
  • Switzerland
  • Liechtenstein
  • Monaco
  • Niger
  • Argentina
  • Sweden
  • Haiti
  • Canada
  • Netherlands
  • Malawi
  • South Korea
  • Czech Republic
  • Mozambique
  • Togo
  • Mali
  • Gambia
  • Finland
  • Tonga
  • Australia
  • Barbados
  • Luxembourg
  • Kosovo
  • St. Lucia
  • Papua New Guinea
  • Albania
  • El Salvador
  • Colombia
  • South Sudan
  • Liberia
  • Bolivia
  • Senegal
  • Estonia
  • Belize
  • Cameroon
  • Chile
  • Malta
  • Portugal
  • St. Kitts and Nevis
  • Guatemala
  • Trinidad and Tobago
  • Paraguay
  • Vanuatu
  • Gabon
  • Mauritius
  • Taiwan
  • Andorra
  • Democratic Republic of the Congo
  • Dominican Republic
  • Dominica
  • Guyana
  • Ireland
  • Panama
  • Timor-Leste
  • Ivory Coast
  • Nauru
  • Philippines
  • Slovenia
  • St. Vincent and the Grenadines
  • Solomon Islands
  • Burkina Faso
  • Samoa
  • Ecuador
  • Ghana
  • Macau
  • Grenada
  • Uruguay
  • Namibia
  • Japan
  • Palau
  • Republic of the Congo
  • Brazil
  • Botswana
  • South Africa
  • Suriname
  • Kiribati
  • Lesotho
  • Benin
  • Guinea Bissau
  • San Marino
  • Sierra Leone
  • Cape Verde
  • Federated States of Micronesia
  • New Zealand
  • Burundi
  • Marshall Islands
  • Sao Tome and Principe
  • North Korea: The sources used for this study clearly indicate that the government of North Korea is among the most repressive in the world with respect to religion as well as other civil liberties. But because North Korean society is effectively closed to outsiders, the sources are unable to provide the kind of specific and timely information that Pew Research coded in this quantitative study. Therefore, the report does not include a score for North Korea on either index.
  • * Somalia: The level of government restrictions in Somalia is difficult to assess due to the lack of a functioning national government; the social hostilities index may be a more reliable indicator of the situation in Somalia.
  • ** Palestinian territories: The Palestinian territories’ score on government restrictions reflects the policies of the Palestinian Authority government (headed by Mahmoud Abbas and headquartered in the West Bank) rather than the actions of Hamas in Gaza (which is not recognized by most of the sources for this report as a legitimate government).

Appendix 3: Social Hostilities Index

The following table shows all 198 countries and territories in descending order of their scores on the Pew Research Center’s index of social hostilities involving religion as of the end of 2012. Pew Research has not attached numerical rankings to the countries because there are numerous tie scores and the differences between the scores of countries that are close to each other on this table are not necessarily meaningful. This is particularly the case at the low end of the scale: The range of scores among the 65 countries in the Very High and High categories is greater than the range of scores among the 76 countries in the Low category. You can download the index as a PDF on the right under “Report Materials.”

Denotes an increase of one point or more from 2011 to 2012.

Denotes a decrease of one point or more from 2011 to 2012.

Very High
Scores 7.2 and Higher
  • Pakistan
  • Afghanistan
  • India
  • Somalia
  • Israel
  • Iraq
  • Palestinian territories
  • Syria
  • Russia
  • Indonesia
  • Nigeria
  • Yemen
  • Kenya
  • Egypt
  • Sudan
  • Lebanon
  • Sri Lanka
  • Bangladesh
  • Thailand
  • Burma (Myanmar)
High
Scores 3.6 to 7.1
  • Mali
  • Tunisia
  • Kosovo
  • Mexico
  • Greece
  • Algeria
  • France
  • Saudi Arabia
  • Uganda
  • Georgia
  • United Kingdom
  • Nepal
  • Tanzania
  • Italy
  • Vietnam
  • Germany
  • Maldives
  • Turkey
  • Iran
  • Libya
  • Bahrain
  • Ethiopia
  • Jordan
  • Kyrgyzstan
  • Armenia
  • Azerbaijan
  • Central African Republic
  • Guinea
  • Bulgaria
  • Kuwait
  • Bosnia-Herzegovina
  • Sweden
  • Ukraine
  • Moldova
  • Cyprus
  • Malaysia
  • Colombia
  • Ghana
  • Papua New Guinea
  • Romania
  • Tuvalu
  • Montenegro
  • Netherlands
  • China
  • Angola
Moderate
Scores 1.5 to 3.5
  • Norway
  • Poland
  • Ivory Coast
  • Serbia
  • Belgium
  • South Africa
  • Democratic Republic of the Congo
  • Philippines
  • Brunei
  • Zambia
  • Samoa
  • South Sudan
  • Austria
  • Swaziland
  • Comoros
  • Australia
  • Mauritius
  • Japan
  • Brazil
  • Hungary
  • Switzerland
  • Madagascar
  • Republic of Macedonia
  • Liberia
  • Senegal
  • Spain
  • Tajikistan
  • Laos
  • Malawi
  • Chile
  • Slovenia
  • Chad
  • Croatia
  • Burkina Faso
  • Benin
  • Uzbekistan
  • Denmark
  • Kazakhstan
  • United States
  • Argentina
  • Finland
  • Ireland
  • Venezuela
  • Haiti
  • Timor-Leste
  • Niger
  • Bhutan
  • Mozambique
  • United Arab Emirates
  • Fiji
  • Lithuania
  • Zimbabwe
  • Czech Republic
  • Guinea Bissau
  • Sierra Leone
  • Paraguay
  • Morocco
Low
Scores 0.0 to 1.4
  • Canada
  • Cameroon
  • Belarus
  • Iceland
  • Hong Kong
  • Peru
  • Slovakia
  • Latvia
  • Gabon
  • New Zealand
  • Mauritania
  • Malta
  • Portugal
  • Burundi
  • Botswana
  • Oman
  • Cuba
  • Mongolia
  • Uruguay
  • Kiribati
  • Liechtenstein
  • Solomon Islands
  • Turkmenistan
  • Suriname
  • Cambodia
  • Guatemala
  • Singapore
  • Qatar
  • Djibouti
  • Antigua and Barbuda
  • Jamaica
  • Barbados
  • St. Lucia
  • St. Kitts and Nevis
  • St. Vincent and the Grenadines
  • Ecuador
  • Republic of the Congo
  • Costa Rica
  • Nicaragua
  • Honduras
  • South Korea
  • Togo
  • Estonia
  • Nauru
  • Eritrea
  • Rwanda
  • Dominica
  • Western Sahara
  • Bahamas
  • Equatorial Guinea
  • Seychelles
  • Monaco
  • Gambia
  • Tonga
  • Luxembourg
  • Albania
  • El Salvador
  • Bolivia
  • Belize
  • Trinidad and Tobago
  • Vanuatu
  • Taiwan
  • Andorra
  • Dominican Republic
  • Guyana
  • Panama
  • Macau
  • Grenada
  • Namibia
  • Palau
  • Lesotho
  • San Marino
  • Cape Verde
  • Federated States of Micronesia
  • Marshall Islands
  • Sao Tome and Principe
  • North Korea: The sources used for this study clearly indicate that the government of North Korea is among the most repressive in the world with respect to religion as well as other civil liberties. But because North Korean society is effectively closed to outsiders, the sources are unable to provide the kind of specific and timely information that Pew Research coded in this quantitative study. Therefore, the report does not include a score for North Korea on either index.