Pew Research Center

FOR RELEASE JANUARY 27, 2011

The Future of the Global Muslim Population

A new Pew Forum report on the size, distribution and growth of the global Muslim population finds that the world’s Muslim population is expected to increase by about 35% in the next 20 years, but it is expected to grow at a slower pace in the next two decades than it did in the previous two decades.

FOR MEDIA OR OTHER INQUIRIES:

Communications Department
202.419.4372
www.pewresearch.org

RECOMMENDED CITATION

Pew Research Center, January 2011, "The Future of the Global Muslim Population"

About Pew Research Center

Pew Research Center is a nonpartisan, nonadvocacy fact tank that informs the public about the issues, attitudes and trends shaping the world. It does not take policy positions. The Center conducts public opinion polling, demographic research, computational social science research and other data-driven research. It studies politics and policy; news habits and media; the internet and technology; religion; race and ethnicity; international affairs; social, demographic and economic trends; science; research methodology and data science; and immigration and migration. Pew Research Center is a subsidiary of The Pew Charitable Trusts, its primary funder.

© Pew Research Center 2026

Table of contents

  • About Pew Research Center
  • The Future of the Global Muslim Population
  • Preface
  • Main Factors Driving Population Growth
  • Related Factors
  • Regional Distribution of Muslims
  • Region: Asia-Pacific
  • Region: Middle East-North Africa
  • Region: Sub-Saharan Africa
  • Region: Europe
  • Region: Americas
  • Sunni and Shia Muslims
  • Muslim-Majority Countries
  • About the Project
  • Appendix A: Methodology
  • Appendix B: Data Sources by Country
  • Appendix C: Advisers and Consultants

The Future of the Global Muslim Population

A new Pew Forum report on the size, distribution and growth of the global Muslim population finds that the world’s Muslim population is expected to increase by about 35% in the next 20 years, but it is expected to grow at a slower pace in the next two decades than it did in the previous two decades.

lede_globalmuslimpop-II

Note (June 2025): Religious composition estimates in this report are based on 2010 baseline numbers that have since been updated. Please refer to our 2025 report “How the Global Religious Landscape Changed from 2010 to 2020” for the latest 2010 and 2020 religious composition estimates. New projections past 2020 are not yet available. Refer to the 2025 report, methodology and interactive table for more detail.

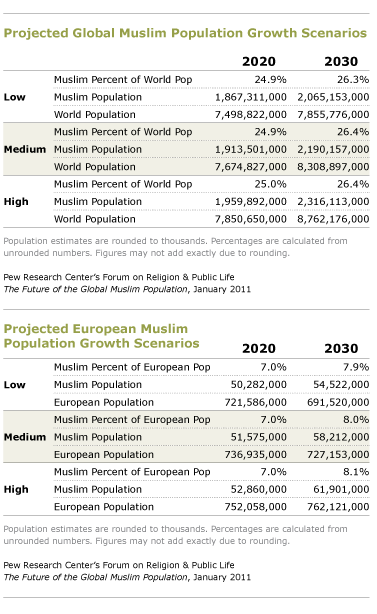
The world’s Muslim population is expected to increase by about 35% in the next 20 years, rising from 1.6 billion in 2010 to 2.2 billion by 2030, according to new population projections by the Pew Research Center’s Forum on Religion & Public Life.

Globally, the Muslim population is forecast to grow at about twice the rate of the non-Muslim population over the next two decades – an average annual growth rate of 1.5% for Muslims, compared with 0.7% for non-Muslims. If current trends continue, Muslims will make up 26.4% of the world’s total projected population of 8.3 billion in 2030, up from 23.4% of the estimated 2010 world population of 6.9 billion.

While the global Muslim population is expected to grow at a faster rate than the non-Muslim population, the Muslim population nevertheless is expected to grow at a slower pace in the next two decades than it did in the previous two decades. From 1990 to 2010, the global Muslim population increased at an average annual rate of 2.2%, compared with the projected rate of 1.5% for the period from 2010 to 2030.

md2-1

These are among the key findings of a comprehensive report on the size, distribution and growth of the global Muslim population. The report by the Pew Forum on Religion & Public Life seeks to provide up-to-date estimates of the number of Muslims around the world in 2010 and to project the growth of the Muslim population from 2010 to 2030. The projections are based both on past demographic trends and on assumptions about how these trends will play out in future years. Making these projections inevitably entails a host of uncertainties, including political ones. Changes in the political climate in the United States or European nations, for example, could dramatically affect the patterns of Muslim migration.

md2-2

If current trends continue, however, 79 countries will have a million or more Muslim inhabitants in 2030, up from 72 countries today.1 A majority of the world’s Muslims (about 60%) will continue to live in the Asia-Pacific region, while about 20% will live in the Middle East and North Africa, as is the case today. But Pakistan is expected to surpass Indonesia as the country with the single largest Muslim population. The portion of the world’s Muslims living in sub-Saharan Africa is projected to rise; in 20 years, for example, more Muslims are likely to live in Nigeria than in Egypt. Muslims will remain relatively small minorities in Europe and the Americas, but they are expected to constitute a growing share of the total population in these regions.

md2-0

In the United States, for example, the population projections show the number of Muslims more than doubling over the next two decades, rising from 2.6 million in 2010 to 6.2 million in 2030, in large part because of immigration and higher-than-average fertility among Muslims. The Muslim share of the U.S. population (adults and children) is projected to grow from 0.8% in 2010 to 1.7% in 2030, making Muslims roughly as numerous as Jews or Episcopalians are in the United States today. Although several European countries will have substantially higher percentages of Muslims, the United States is projected to have a larger number of Muslims by 2030 than any European countries other than Russia and France. (See the Americas section for more details.)

In Europe as a whole, the Muslim share of the population is expected to grow by nearly one-third over the next 20 years, rising from 6% of the region’s inhabitants in 2010 to 8% in 2030. In absolute numbers, Europe’s Muslim population is projected to grow from 44.1 million in 2010 to 58.2 million in 2030. The greatest increases – driven primarily by continued migration – are likely to occur in Western and Northern Europe, where Muslims will be approaching double-digit percentages of the population in several countries. In the United Kingdom, for example, Muslims are expected to comprise 8.2% of the population in 2030, up from an estimated 4.6% today. In Austria, Muslims are projected to reach 9.3% of the population in 2030, up from 5.7% today; in Sweden, 9.9% (up from 4.9% today); in Belgium, 10.2% (up from 6% today); and in France, 10.3% (up from 7.5% today). (See the Europe section.)

Several factors account for the faster projected growth among Muslims than non-Muslims worldwide. Generally, Muslim populations tend to have higher fertility rates (more children per woman) than non-Muslim populations. In addition, a larger share of the Muslim population is in, or soon will enter, the prime reproductive years (ages 15-29). Also, improved health and economic conditions in Muslim-majority countries have led to greater-than-average declines in infant and child mortality rates, and life expectancy is rising even faster in Muslim-majority countries than in other less-developed countries. (See the section on Main Factors Driving Population Growth for more details. For a list of Muslim-majority countries and definitions for the terms less- and more-developed, see the section on Muslim- Majority Countries.)

Growing, But at a Slower Rate

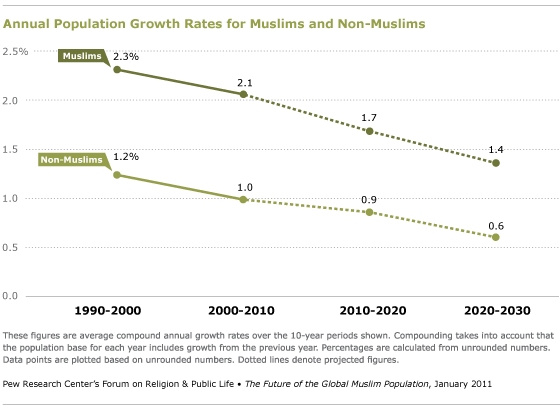
The growth of the global Muslim population, however, should not obscure another important demographic trend: the rate of growth among Muslims has been slowing in recent decades and is likely to continue to decline over the next 20 years, as the graph below shows. From 1990 to 2000, the Muslim population grew at an average annual rate of 2.3%. The growth rate dipped to 2.1% from 2000 to 2010, and it is projected to drop to 1.7% from 2010 to 2020 and 1.4% from 2020 to 2030 (or 1.5% annually over the 20-year period from 2010 to 2030, as previously noted).

md2-3

The declining growth rate is due primarily to falling fertility rates in many Muslim-majority countries, including such populous nations as Indonesia and Bangladesh. Fertility is dropping as more women in these countries obtain a secondary education, living standards rise and people move from rural areas to cities and towns. (See the Related Factors section for more details.)

md2-4

The slowdown in Muslim population growth is most pronounced in the Asia- Pacific region, the Middle East-North Africa and Europe, and less sharp in sub-Saharan Africa. The only region where Muslim population growth is accelerating through 2020 is the Americas, largely because of immigration. (For details, see the charts on population growth in the sections of this report on Asia-Pacific, Middle-East-North Africa, Sub-Saharan Africa, Europe and the Americas.)

Falling birth rates eventually will lead to significant shifts in the age structure of Muslim populations. While the worldwide Muslim population today is relatively young, the so-called Muslim “youth bulge” – the high percentage of Muslims in their teens and 20s – peaked around the year 2000 and is now declining. (See the Age Structure section for more details.)

In 1990, more than two-thirds of the total population of Muslim-majority countries was under age 30. Today, people under 30 make up about 60% of the population of these countries, and by 2030 they are projected to fall to about 50%.

At the same time, many Muslim-majority countries will have aging populations; between 2010 and 2030, the share of people age 30 and older in these countries is expected to rise from 40% to 50%, and the share of people age 60 and older is expected nearly to double, from 7% to 12%.

Muslim-majority countries, however, are not the only ones with aging populations. As birth rates drop and people live longer all around the globe, the population of the entire world is aging. As a result, the global Muslim population will remain comparatively youthful for decades to come. The median age in Muslim-majority countries, for example, rose from 19 in 1990 to 24 in 2010 and is expected to climb to 30 by 2030. But it will still be lower than the median age in North America, Europe and other more-developed regions, which rose from 34 to 40 between 1990 and 2010 and is projected to be 44 in 2030. By that year, nearly three-in-ten of the world’s youth and young adults – 29.1% of people ages 15-29 – are projected to be Muslims, up from 25.8% in 2010 and 20.0% in 1990.

Other key findings of the study include:

Worldwide

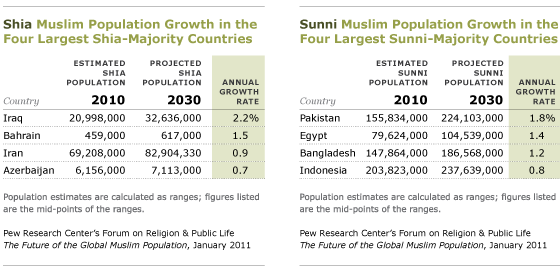
  • Sunni Muslims will continue to make up an overwhelming majority of Muslims in 2030 (87- 90%). The portion of the world’s Muslims who are Shia may decline slightly, largely because of relatively low fertility in Iran, where more than a third of the world’s Shia Muslims live.
  • As of 2010, about three-quarters of the world’s Muslims (74.1%) live in the 49 countries in which Muslims make up a majority of the population. More than a fifth of all Muslims (23.3%) live in non-Muslim-majority countries in the developing world. About 3% of the world’s Muslims live in more-developed regions, such as Europe, North America, Australia, New Zealand and Japan.
  • Fertility rates in Muslim-majority countries are closely related to women’s education levels. In the eight Muslim-majority countries where girls generally receive the fewest years of schooling, the average fertility rate (5.0 children per woman) is more than double the average rate (2.3 children per woman) in the nine Muslim-majority countries where girls generally receive the most years of schooling. One exception is the Palestinian territories, where the average fertility rate (4.5 children per woman) is relatively high even though a girl born there today can expect to receive 14 years of formal education.
  • Fewer than half (47.8%) of married women ages 15-49 in Muslim-majority countries use some form of birth control. By comparison, in non-Muslim-majority, less-developed countries nearly two-thirds (63.3%) of all married women in that age group use some form of birth control.

Asia-Pacific

md2-asia(2)

  • Nearly three-in-ten people living in the Asia-Pacific region in 2030 (27.3%) will be Muslim, up from about a quarter in 2010 (24.8%) and roughly a fifth in 1990 (21.6%).
  • Muslims make up only about 2% of the population in China, but because the country is so populous, its Muslim population is expected to be the 19th largest in the world in 2030.

Middle East-North Africa

md2-middle

  • The Middle East-North Africa will continue to have the highest percentage of Muslim-majority countries. Of the 20 countries and territories in this region, all but Israel are projected to be at least 50% Muslim in 2030, and 17 are expected to have a population that is more than 75% Muslim in 2030, with Israel, Lebanon and Sudan (as currently demarcated) being the only exceptions.
  • Nearly a quarter (23.2%) of Israel’s population is expected to be Muslim in 2030, up from 17.7% in 2010 and 14.1% in 1990. During the past 20 years, the Muslim population in Israel has more than doubled, growing from 0.6 million in 1990 to 1.3 million in 2010. The Muslim population in Israel (including Jerusalem but not the West Bank and Gaza) is expected to reach 2.1 million by 2030.
  • Egypt, Algeria and Morocco currently have the largest Muslim populations in the Middle East-North Africa. By 2030, however, Iraq is expected to have the second-largest Muslim population in the region – exceeded only by Egypt – largely because Iraq has a higher fertility rate than Algeria or Morocco.

Sub-Saharan Africa


md2-africa-(2)
  • The Muslim population in sub-Saharan Africa is projected to grow by nearly 60% in the next 20 years, from 242.5 million in 2010 to 385.9 million in 2030. Because the region’s non- Muslim population also is growing at a rapid pace, Muslims are expected to make up only a slightly larger share of the region’s population in 2030 (31.0%) than they do in 2010 (29.6%).
  • Various surveys give differing figures for the size of religious groups in Nigeria, which appears to have roughly equal numbers of Muslims and Christians in 2010. By 2030, Nigeria is expected to have a slight Muslim majority (51.5%).

Europe

md2-europe(2)

  • In 2030, Muslims are projected to make up more than 10% of the total population in 10 European countries: Kosovo (93.5%), Albania (83.2%), Bosnia-Herzegovina (42.7%), Republic of Macedonia (40.3%), Montenegro (21.5%), Bulgaria (15.7%), Russia (14.4%), Georgia (11.5%), France (10.3%) and Belgium (10.2%).
  • Russia will continue to have the largest Muslim population (in absolute numbers) in Europe in 2030. Its Muslim population is expected to rise from 16.4 million in 2010 to 18.6 million in 2030. The growth rate for the Muslim population in Russia is projected to be 0.6% annually over the next two decades. By contrast, Russia’s non-Muslim population is expected to shrink by an average of 0.6% annually over the same period.
  • France had an expected net influx of 66,000 Muslim immigrants in 2010, primarily from North Africa. Muslims comprised an estimated two-thirds (68.5%) of all new immigrants to France in the past year. Spain was expected to see a net gain of 70,000 Muslim immigrants in 2010, but they account for a much smaller portion of all new immigrants to Spain (13.1%). The U.K.’s net inflow of Muslim immigrants in the past year (nearly 64,000) was forecast to be nearly as large as France’s. More than a quarter (28.1%) of all new immigrants to the U.K. in 2010 are estimated to be Muslim.

The Americas

md2-amer(2)

  • The number of Muslims in Canada is expected to nearly triple in the next 20 years, from about 940,000 in 2010 to nearly 2.7 million in 2030. Muslims are expected to make up 6.6% of Canada’s total population in 2030, up from 2.8% today. Argentina is expected to have the third-largest Muslim population in the Americas, after the U.S. and Canada. Argentina, with about 1 million Muslims in 2010, is now in second place, behind the U.S.
  • Children under age 15 make up a relatively small portion of the U.S. Muslim population today. Only 13.1% of Muslims are in the 0-14 age group. This reflects the fact that a large proportion of Muslims in the U.S. are newer immigrants who arrived as adults. But by 2030, many of these immigrants are expected to start families. If current trends continue, the number of U.S. Muslims under age 15 will more than triple, from fewer than 500,000 in 2010 to 1.8 million in2030. The number of Muslim children ages 0-4 living in the U.S. is expected to increase from fewer than 200,000 in 2010 to more than 650,000 in 2030.
  • About two-thirds of the Muslims in the U.S. today (64.5%) are first-generation immigrants (foreign-born), while slightly more than a third (35.5%) were born in the U.S. By 2030, however, more than four-in-ten of the Muslims in the U.S. (44.9%) are expected to be native-born.
  • The top countries of origin for Muslim immigrants to the U.S. in 2009 were Pakistan and Bangladesh. They are expected to remain the top countries of origin for Muslim immigrants to the U.S. in 2030.

About the Report

This report makes demographic projections. Projections are not the same as predictions. Rather, they are estimates built on current population data and assumptions about demographic trends; they are what will happen if the current data are accurate and the trends play out as expected. But many things – immigration laws, economic conditions, natural disasters, armed conflicts, scientific discoveries, social movements and political upheavals, to name just a few – can shift demographic trends in unforeseen ways, which is why this report adheres to a modest time frame, looking just 20 years down the road. Even so, there is no guarantee that Muslim populations will grow at precisely the rates anticipated in this report and not be affected by unforeseen events, such as political decisions on immigration quotas or national campaigns to encourage larger or smaller families.

The projections presented in this report are the medium figures in a range of three scenarios – high, medium and low – generated from models commonly used by demographers around the world to forecast changes in population size and composition. The models follow what is known as the cohort-component method, which starts with a baseline population (in this case, the current number of Muslims in each country) divided into groups, or cohorts, by age and sex. Each cohort is projected into the future by adding likely gains – new births and immigrants – and subtracting likely losses – deaths and emigrants. These calculations were made by the Pew Forum’s demographers, who collaborated with researchers at the International Institute for Applied Systems Analysis (IIASA) in Austria on the projections for the United States and European countries. (For more details, see Appendix A: Methodology.)

The current population data that underpin this report were culled from the best sources available on Muslims in each of the 232 countries and territories for which the U.N. Population Division provides general population estimates. Many of these baseline statistics were published in the Pew Forum’s 2009 report, Mapping the Global Muslim Population, which acquired and analyzed about 1,500 sources of data – including census reports, large-scale demographic studies and general population surveys – to estimate the number of Muslims in every country and territory. (For a list of sources, see Appendix B: Data Sources by Country.) All of those estimates have been updated for 2010, and some have been substantially revised. (To find the current estimate and projections for a particular region or country, see Muslim Population by  Country, 1990-2030.) Since many countries are conducting national censuses in 2010-11, more data is likely to emerge over the next few years, but a cut-off must be made at some point; this report is based on information available as of mid-2010. To the extent possible, the report provides data for decennial years – 1990, 2000, 2010, 2020 and 2030. In some cases, however, the time periods vary because data is available only for certain years or in five-year increments (e.g., 2010-15 or 2030-35).

The definition of Muslim in this report is very broad. The goal is to count all groups and individuals who self-identify as Muslims. This includes Muslims who may be secular or nonobservant. No attempt is made in this report to measure how religious Muslims are or to forecast levels of religiosity (or secularism) in the decades ahead.2

The main factors, or inputs, in the population projections are:

  • Births (fertility rates)
  • Deaths (mortality rates)
  • Migration (emigration and immigration), and
  • The age structure of the population (the number of people in various age groups)

Related factors – which are not direct inputs into the projections but which underlie vital assumptions about the way Muslim fertility rates are changing and Muslim populations are shifting – include:

  • Education (particularly of women)
  • Economic well-being (standards of living)
  • Contraception and family planning
  • Urbanization (movement from rural areas into cities and towns), and
  • Religious conversion

To fully understand the projections, one must understand these factors, which the next section of the report will discuss in more detail.

Readers can also explore an online, interactive feature that allows them to select a region or one of the 232 countries and territories – as well as a decade from 1990-2030 – and see the size of the Muslim population in that place and time.


Footnotes

1 The seven countries projected to rise above 1 million Muslims by 2030 are: Belgium, Canada, Congo, Djibouti, Guinea Bissau,Netherlands and Togo. (return to text)

2 In other reports, the Pew Forum and the Pew Research Center have used large-scale public opinion surveys to measure the beliefs and practices of many religious groups, including Muslims in several countries. See, for example,Tolerance and Tension: Islam and Christianity in Sub-Saharan Africa, 2010, and Muslim Americans: Middle Class and Mostly Mainstream, 2007. (return to text)

Photo Credits:

Asia-Pacific: Lindsay Hebberd/CORBIS Middle East-North Africa: Alaa Al-Shemaree/epa/Corbis Sub-Saharan Africa: Paul Almasy/CORBIS Europe: Pascal Le Segretain/CORBIS SYGMA Americas: John Van Hasselt/Sygma/Corbis


Preface

A little more than a year ago, the Pew Research Center’s Forum on Religion & Public Life published Mapping the Global Muslim Population, which estimated that there were 1.57 billion Muslims of all ages around the world in 2009. Now, with this report on The Future of the Global Muslim Population, we are taking the next step: using standard demographic methods to project – despite many uncertainties – how many Muslims there are likely to be in each of the world’s 232 countries and territories by 2030.

The Muslim population projections presented in this report are based on the best data we could find on fertility, mortality and migration rates, as well as related factors such as education, economic well-being and use of birth control. Our data sources, methodology and assumptions are laid out in the following pages so that readers can see how the Pew Forum’s demographers arrived at various estimates and can draw their own conclusions about the reliability of the projections. This report not only attempts to look 20 years into the future but also describes measurable trends since 1990 and provides a rich demographic portrait of Muslims around the world today.

After learning in this report that the global Muslim population has been growing in absolute numbers and in percentage terms (as a share of all the world’s people), a reader may ask: Is Islam the world’s fastest-growing religion? If Islam is growing in percentage terms, does that mean some of the world’s other major faiths are shrinking? Is secularism becoming more prevalent, or less? We do not have the answers – yet. But these are the kinds of questions that animate our research, and we are already compiling figures on other religious groups to fill in the bigger picture.

Since mid-2010, Pew Forum staff have been collecting data on the size and distribution of the global Christian population. We hope to publish estimates of the current number of Christians later in 2011, followed in 2012 by projections for the future growth of Christianity and other major world faiths, such as Hinduism, Buddhism, Sikhism and Judaism. We will also look at the size and growth of the population that is not affiliated with any religious tradition.

GRFP_small

This effort is part of the Pew-Templeton Global Religious Futures project, which analyzes religious change and its impact on societies around the world. Previous reports produced under this initiative, funded by The Pew Charitable Trusts and the John Templeton Foundation, include Tolerance and Tension: Islam and Christianity in Sub-Saharan Africa (April 2010), which was based on a major public opinion survey in 19 African countries, and Global Restrictions on Religion (December 2009), which gauged the level of social and government restrictions on religion in nearly 200 countries.

The primary researchers for The Future of the Global Muslim Population report are Brian J. Grim, Ph.D., a senior researcher in religion and world affairs and director of cross-national data at the Pew Forum, and Mehtab S. Karim, Ph.D., a visiting senior research fellow in 2008-2010 who came to the Pew Forum from the Aga Khan University in Karachi, Pakistan, where he was a professor of demography. Dr. Karim is now a distinguished senior fellow and affiliated professor in the School of Public Policy at George Mason University.

In preparing this report, the Pew Forum consulted with numerous experts on Muslims in particular countries. Their names and countries of expertise are listed in Appendix C, and we are grateful for their help in ferreting out the best population data. In addition, we are deeply indebted to researchers at the Age and Cohort Change project of the International Institute for Applied Systems Analysis (IIASA) in Laxenburg, Austria, who collaborated with the Pew Forum on some of the most complex population projections: Vegard Skirbekk, Samir KC, Anne Goujon and Marcin Stonawski.

We also received invaluable assistance and feedback on drafts of this report from Carl Haub, senior demographer and Conrad Taeuber Chair of Public Information at the Population Reference Bureau; Amaney Jamal, associate professor of politics at Princeton University and a Pew Forum consultant on global Islam; John Casterline, professor of sociology and director of the Initiative in Population Research at the Ohio State University; Charles F. Westoff, professor of demographic studies and sociology, emeritus, at Princeton University; Mohamed Ayad, regional coordinator of Demographic & Health Surveys and technical director of ICF Macro; and our colleagues in the Pew Research Center’s Social & Demographic Trends project, D’Vera Cohn and Jeffrey S. Passel.

While the data collection and projection methodology were guided by our consultants and advisers, the Pew Forum is solely responsible for the interpretation and reporting of the data.

— Luis Lugo, Director, and Alan Cooperman, Associate Director for Research, Pew Research Center’s Forum on Religion & Public Life

Main Factors Driving Population Growth

Fertility

Fertility rates have fallen in most Muslim-majority countries in recent decades. Yet they remain, on average, higher than in the rest of the developing world and considerably higher than in more-developed countries. This is one of the main reasons that the global Muslim population is projected to rise both in absolute numbers and in relative terms, as a share of all the people in the world.

md2-5

Categories of Countries

For comparison purposes, this report provides demographic data on three types of countries:

Muslim-majority countries.

As of 2010, there are 49 countries in which Muslims comprise more than 50% of the population. All Muslim majority countries are in less-developed regions of the world, with the exception of Albania and Kosovo, which are in Europe.

Read more…

Non-Muslim-majority countries in less developed regions.

These countries make up the rest of the “developing world”; they include all the developing, non-Muslim majority countries in Africa, Asia-Pacific and Central and South America (including the Caribbean).

Non-Muslim-majority countries in more developed regions.

This category is often described as the “developed world”; it includes all countries in Europe and North America, plus Australia, New Zealand and Japan.

Taken as a whole, the world’s more-developed regions – including Europe, North America, Japan and Australia – have Total Fertility Rates (TFRs)3 below their replacement levels of about 2.1 children per woman, the minimum necessary to keep the population stable (absent other factors, such as immigration).4 Fertility rates in these more-developed nations are projected to rise slightly over the next 20 years but to remain, on average, well below replacement levels.

In non-Muslim-majority countries in less-developed regions – including all of Latin America, much of sub-Saharan Africa and parts of Asia – fertility rates have dropped in recent decades. They are projected to continue to drop, reaching or even falling below replacement levels in these developing countries as a whole in 2030-35.

In many Muslim-majority countries – including Indonesia, Iran, United Arab Emirates, Lebanon, Turkey and Tunisia – fertility rates also have dropped substantially. The average Total Fertility Rate for all 49 Muslim-majority countries has fallen from 4.3 children per woman in 1990-95 to an estimated 2.9 children in 2010-15. Over the next 20 years, fertility rates in these Muslim-majority countries as a whole are expected to continue to decline, though not quite as steeply, dropping to 2.6 children per woman in 2020-25 and 2.3 children in 2030-35 – approaching and possibly reaching replacement levels.

If current trends continue, fertility rates in Muslim-majority countries eventually may converge with fertility rates in other developing countries and in the world’s more-developed regions. But complete convergence is not projected to occur in the next two decades, as the trend lines in the above graph shows.

Moreover, high fertility rates in the past create a certain demographic momentum. Due to previously high fertility, large numbers of Muslim youth and young adults are now in (or entering) their prime childbearing years, all but ensuring that relatively rapid population growth will continue in the next two decades, even if the number of births per woman goes down. (For details, see the Age Structure section.)

Among the reasons for declining fertility rates in both Muslim-majority and non-Muslim-majority countries are economic development and improved living standards, higher levels of education, people waiting until they are older to get married, growing urbanization and more extensive use of birth control. (See the Related Factors section for a discussion of how these factors affect the global Muslim population.)

md2-6

The overall trends in fertility, however, mask a considerable amount of variation from country to country. Among Muslim-majority countries, the highest Total Fertility Rates currently are found in Niger, Afghanistan and Somalia, where the average woman has more than six children during her lifetime. The lowest TFRs are in Iran (1.7) and Tunisia (1.8), which are well below replacement levels.

A final, cautionary note: The impact of religion on fertility rates is difficult to assess and remains a subject of debate. One should not assume, just because fertility tends to be higher in Muslim-majority countries than in other developing countries, that Islamic teachings are the reason. Cultural, social, economic, political, historical and other factors may play equal or greater roles.5 For example, many Muslims live in countries with higher-than-average rates of poverty, less-adequate health care, fewer educational opportunities and more-rural populations. All of these conditions are associated with higher fertility rates.

Islamic authorities in some countries, such as Afghanistan and Saudi Arabia, reinforce cultural norms that limit women’s autonomy by, for example, restricting their educational and career options or making it difficult for women to initiate a divorce. These restrictions may contribute to higher fertility because there is strong evidence that Muslim women, like other women around the world, tend to delay marriage – and consequently childbirth – as they attain higher levels of education. (See the discussion of education.) In Nigeria, for example, Muslim women generally have lower literacy levels and marry at younger ages; not surprisingly, Muslims also have higher fertility rates than non-Muslims in Nigeria. (For more details, see the Spotlight on Nigeria). However, recent studies suggest that in a number of other countries, including India and Malaysia, measures of women’s status cannot explain differences in fertility between Muslims and non-Muslims.6

Women in Muslim-majority countries tend to marry at much younger ages than women in more-developed countries, but there is little difference between the average age of marriage in Muslim-majority countries and in other less-developed countries. According to a Pew Forum analysis of U.N. data, women in Muslim-majority countries marry, on average, at 21.6 years, compared with 22.0 years in non-Muslim-majority, less-developed countries and 26.2 years in more-developed countries.7

Family planning is another arena in which the role of religion is not as simple as it might seem. Islamic edicts generally have supported the use of birth control, and a number of Muslim-majority countries (including Pakistan, Bangladesh, Indonesia, Iran, Turkey and Tunisia) have encouraged family planning programs. But many Muslims are either uneasy about contraceptives or do not have access to them, and women in Muslim-majority countries report using birth control at lower rates than women in other developing countries. In addition, many Muslim-majority countries forbid or strictly limit abortions. (See the discussion of contraception and family planning .)

There is also some evidence that across a variety of religious traditions, women who are more religious have higher fertility rates than less-religious women. This suggests that religiosity in general, rather than Islam in particular, may boost the number of children per woman.8 In short, Islamic beliefs may directly or indirectly influence the size of Muslim families, but religion does not operate in isolation from other forces; fertility rates appear to be driven by a complex mixture of cultural, social, economic, religious and other factors.

Life Expectancy at Birth

Muslims are living much longer than they did just a generation ago. The average life expectancy at birth in Muslim-majority countries, which was 62 years in the five-year period 1990-95, is estimated to be 68 years in 2010-15.9 By 2030-35, life expectancy at birth in Muslim-majority countries is projected to reach 73 years, slightly surpassing life expectancy in other (non-Muslim-majority) developing countries. This is another reason for the growth of the global Muslim population in both absolute and relative terms.

md2-7

md2-8

In more-developed countries, people tend to live considerably longer than in less-developed countries. In 2010-15, the average life expectancy in the world’s more-developed countries is estimated by the United Nations Population Division to be a full decade longer than in developing countries (78 years vs. 68 years). But life expectancy is rising in the developing world – including in countries with Muslim majorities – albeit from a lower base.

Between 1990-95 and 2010-15, the average gain in life expectancy in more-developed countries is estimated at four years (from 74 to 78). In less-developed countries where Muslims are in the minority, the gain is estimated to be five years (from 63 to 68). In Muslim-majority countries, it is estimated at seven years (from 62 to 68), when calculated from unrounded numbers.

A similar pattern is projected in the decades to come. Life expectancy is projected to rise by three years in more-developed countries (from 78 to 81), by four years in less-developed countries that do not have Muslim majorities (from 68 to 72) and by four years (when calculated from unrounded numbers) in Muslim-majority countries (from 68 to 73). The differences in the rate of improvement are small; the key point is that life expectancy at birth is rising across the board.

Behind the gains in longevity are numerous factors, including better health care, improved nutrition, rising incomes and infrastructure development. One measure of health care quality, for example, is the percentage of births attended by skilled health professionals. This indicator has improved dramatically in Muslim-majority countries, rising from an average of about 47% of all births in the 1990s to roughly 63% of all births in 2000 to 2008, a 16-percentage-point gain, according to the Pew Forum’s analysis of data from the World Health Organization. In developing countries where Muslims are in the minority, by contrast, the percentage of births attended by skilled health professionals rose by just five percentage points during this period, from about 68% in the 1990s to almost 73% in 2000-08. And, statistically speaking, virtually no improvement was possible in more-developed nations, where 99% of births already were attended by skilled health professionals in the 1990s.

To see how infrastructure development contributes to rising life expectancy in Muslim-majority countries, one might look, for example, at access to clean drinking water, which is less likely to carry diseases. Muslim-majority countries with better access to improved (i.e., clean) drinking water have longer life expectancies. For instance, the average life expectancy in the six countries whose residents have the most access to improved drinking water is more than 70 years, compared with less than 55 years in the five Muslim-majority countries where access to clean drinking water is least common.

md2-9

md2-10(2)

Improved health care, better access to clean drinking water and many other gains in infrastructure development, living standards and nutrition have resulted in sharp declines in infant mortality rates in developing countries in general and Muslim-majority countries in particular. The decline in infant mortality, in turn, is one of the main factors driving up life expectancy at birth.

Between 1990-95 and 2010-15, the number of infant deaths per 1,000 live births is projected to drop by about 31 in Muslim-majority countries, by almost 17 in other less-developed countries and by almost five in more-developed countries. By 2020-25, Muslim-majority countries are expected to close the remaining gap and have infant mortality rates no higher than in non- Muslim-majority developing countries.

Yet, despite such dramatic improvements, there is enormous variation among Muslim-majority countries in both infant mortality rates and life expectancy at birth. In Afghanistan, for example, the infant mortality rate is 147 deaths per 1,000 live births – the highest in the world and nearly four times the global average of 33 per 1,000, according to U.N. figures – while average life expectancy at birth is just 45 years. By contrast, infant mortality rates in Brunei, Mayotte, Bahrain, Malaysia, Qatar, Bahrain, Kuwait and the United Arab Emirates are about the same as those found in more-developed nations, and average life expectancy at birth is 75 years or more.

Declining infant mortality rates and increased life expectancies mean that Muslim-majority countries will have more children surviving into adulthood as well as growing numbers of elderly people in the next two decades, as discussed in the Age Structure section.

md2-11

Migration

On average, more people are leaving Muslim-majority countries than migrating to them. Although the rate of people leaving has declined significantly since 1990-95, Muslim-majority countries are still losing part of their populations to emigration, and that trend is projected to continue over the next 20 years, as the chart below shows.

md2-12

The migration of people from Muslim-majority countries to more-developed countries is one of the main reasons that both the number and the percentage of Muslims are projected to rise in Europe, North America, New Zealand and Australia. (The regional impacts are discussed in greater detail in the regional sections.)

md2-13

By 2030-35, Muslim-majority countries as a whole are projected to have average annual losses of 47 people per 100,000 population, down from net losses of 81 people annually in 2010-15. As recently as 1990-95, Muslim-majority countries were losing many more people – an average of 160 a year per 100,000.

More-developed nations in Europe, North America and elsewhere are likely to remain important destinations for immigrants from Muslim-majority countries (as well as from other less-developed countries) in the next 20 years. Annual net migration to more-developed nations is expected to be fairly stable over the next two decades. By 2030-35, more developed countries are projected to have annual average gains of 182 people per 100,000 population, down from 200 per 100,000 in 2010-15.

If economic conditions in developing countries – including Muslim-majority countries – continue to improve, there will be less motivation, or “push” factors, encouraging emigration. Likewise, if economic conditions in more-developed countries worsen, there will be fewer “pull” factors attracting new immigrants, including temporary workers.

Of course, not all people who immigrate to the more-developed world from Muslim-majority countries are Muslims. Studies show that religious minorities – such as Christians living in majority-Muslim countries in the Middle East – sometimes emigrate in larger proportions than religious majorities.10 In addition, there is movement from one Muslim-majority country to another. Many immigrants to the Gulf region, for example, are from other Muslim-majority countries, and a substantial amount of internal migration occurs within the Middle East, as people move in search of employment and to escape conflicts.

In short, there is a net flow of migrants from Muslim-majority countries to countries in more developed regions, such as Europe and North America, but Muslims also are moving in other directions, including into the Gulf states, which now have net inflows of migrants.

Age Structure

Generally speaking, Muslim-majority countries have very youthful populations. As of 2010, people under age 30 make up about 60% of the total population of Muslim-majority countries. By contrast, only about a third of all people living in the world’s more-developed regions, such as Europe and North America, are under 30. The comparatively large number of Muslims who are in or entering their prime childbearing years is another reason for the projected growth of the world’s Muslim population.

PR_11.01.27_muslimPopulation-09
PR_11.01.27_muslimPopulation-08

When a country has a large percentage of people in their prime reproductive years, it gathers a kind of demographic momentum: Because many women are having babies, the population may grow rapidly even if the number of babies per woman (the fertility rate) is not especially high. Moreover, this momentum can last for generations, as the children born in one generation reach adulthood and begin having families of their own. Even when fertility rates are falling – as is the case in many Muslim-majority countries – the momentum may take more than one generation to dissipate.

As a result of high fertility in the past, Muslim-majority countries clearly have such demographic momentum today. Women between ages 15 and 29 – those who are in or soon will enter their prime childbearing years – make up 14% of the total population in Muslim-majority countries, compared with 13% in non-Muslim-majority developing countries and 10% in more-developed countries.

More generally, people under age 30 of both sexes comprise about 60% of the population in Muslim-majority countries, compared with about 54% in non-Muslim-majority developing countries and almost 35% in more-developed countries. And Muslim-majority countries are projected to remain relatively youthful during the coming two decades. In 2030, more than 50% of the population in Muslim-majority countries is expected to be under 30, compared with almost 46% in non-Muslim-majority developing countries and almost 31% in countries in more-developed regions.

Indeed, by 2030, there will be more than 540 million Muslim youth and young adults (ages 15-29) around the world, representing nearly three-in-ten (29.1%) of the projected total of 1.9 billion people in that age group, up from 25.8% in 2010 and 20.0% in 1990.

Yet, notwithstanding the high percentage of youth and young adults in Muslim-majority countries, the global Muslim population as a whole is aging as fertility rates drop (meaning that fewer babies are born per woman) and as life expectancy rises (meaning that more people are living into old age). This is reflected in the median age in Muslim-majority countries, which has climbed from 19 to 24 over the past two decades and is projected to reach 30 in 2030.

PR_11.01.27_muslimPopulation-07

The graph above captures the fact that the world population, as a whole, is aging. The median age – the point at which half the people in a given population are older and half are younger – is rising in Muslim-majority countries, but so are the median ages in non-Muslim-majority, less-developed countries and in more-developed countries. This explains how it is possible for the world’s Muslims to be aging and yet to remain very youthful compared with non-Muslims.

The so-called Muslim youth bulge – the high proportion of youth and young adults in many heavily Muslim societies – has attracted considerable attention from political scientists.11 Less notice has been paid to the fact that the Muslim youth bulge peaked around the start of the 21st century and is now gradually declining as the Muslim population ages. The percentage of 15- to 29-year-olds in Muslim-majority countries rose slightly between 1990 and 2000 (from 27.5% to 28.8%) but has since dipped slightly to 28.5% and is projected to continue to decline to 24.4% in 2030. While this is not a large drop, it means that the proportion of youth and young adults in many Muslim-majority countries has reached a plateau or begun to fall.

PR_11.01.27_muslimPopulation-06

As the youth bulge moves along, the portion of the population in Muslim-majority countries between ages 30 and 44 is projected to remain fairly stable or rise slightly, from 20.2% in 2010 to 21.4% in 2030. In Muslim-majority countries, people ages 45-59 are expected to rise from 12.1% today to 16.3% in 2030.

The fastest growth of all, in percentage terms, will be among people age 60 and older, who are expected to make up 11.9% of the population in Muslim-majority countries as a whole in 2030, up from 7.3% in 2010.

PR_11.01.27_muslimPopulation-05


PR_11.01.27_muslimPopulation-04

Yet the percentage of the population age 60 and older will remain somewhat higher in non-Muslim-majority, less-developed countries and dramatically higher in more-developed countries, where a third of the population will be 60 and older in 2030.

Some Muslim-majority countries already have considerably older populations than others. The highest median ages at present are found in the United Arab Emirates, Kuwait, Qatar and Albania. The lowest are in Niger, Burkina Faso, Afghanistan and Chad.

PR_11.01.27_muslimPopulation-03

In 2010, the Muslim-majority countries with the highest portion of people age 60 and older are Albania, Lebanon, Kazakhstan and Tunisia. Albania will still be at the top of the list in 2030. By that year, nearly a quarter of Albania’s population (24.0%) is expected to be age 60 or older, mirroring trends in Europe as a whole.

In 2030, the Muslim-majority countries with the highest proportion of youth and young adults (ages 15-29) will be Burkina Faso, Senegal, Sierra Leone and Mali, where about three-in-ten will be in that age group.

PR_11.01.27_muslimPopulation-10

Footnotes

3 The standard measure of fertility in this report is the Total Fertility Rate, defined as the total number of children an average woman would have in her lifetime if fertility patterns did not change. The TFR is calculated by adding the birth rates among women in each age group in a particular country during a given period; in other words, it is a kind of snapshot of fertility patterns at one place and time. (return to text)

4 The replacement level varies depending on mortality rates and sex ratios at birth. In countries with a normal sex ratio at birth and relatively low infant and child mortality, a fertility rate of about 2.1 children per woman is sufficient to replenish the population. In some developing countries with high infant and child mortality, the replacement fertility rate is substantially greater than than 2.1 children per woman. Based on 2001 U.N. data, one study estimated the average replacement rate in Africa at 2.7 and the worldwide average at 2.3. See Thomas J. Espenshade, Juan Carlos Guzman and Charles F. Westoff, “The Surprising Global Variation in Replacement Fertility,” Population Research and Policy Review, Volume 22, Numbers 5-6, pages 575-583, December 2003. (return to text)

5 One study in West Africa, for example, found that in countries where Muslims are in the minority, they tend to have higher fertility than non-Muslims, while in countries in which Muslims are in the majority, they tend to have lower fertility than non- Muslims. “There is no single, coherent Muslim reproductive pattern: the real story is local,” the author asserts. See Jennifer Johnson-Hanks, “On the Politics and Practice of Muslim Fertility: Comparative Evidence from West Africa,” Medical Anthropology Quarterly, Volume 20, Number 1, pages 12-30, 2006. (return to text)

6 For instance, a study of Muslim and non-Muslim communities in India, Malaysia, Thailand and the Philippines found that the Muslim communities had more children per woman even though they did not score any lower on measures of women’s power or autonomy. See S. Philip Morgan, Sharon Stash, Herbert L. Smith and Karen Oppenheim Mason, “Muslim and Non-Muslim Differences in Female Autonomy and Fertility: Evidence from Four Asian Countries,” Population and Development Review, Volume 28, Number 3, pages 515-537, 2002. (return to text)

7 These figures are the average (mean) age of first marriage. They have been weighted by country populations so that more populous countries affect the average more than smaller countries. (return to text)

8 A 2007 study, for example, found that Muslim women in Europe who are highly religious are significantly more likely than less-religious Muslim women to have at least two children. See Charles F. Westoff and Tomas Frejka, “Religiousness and Fertility Among European Muslims,” Population and Development Review, Volume 33, Number 4, pages 785-809, December 2007. Other researchers have demonstrated the connection between fertility and religiosity in a variety of religious traditions. See, for example, Conrad Hackett, “Religion and Fertility in the United States: The Influence of Affiliation, Region, and Congregation,” Ph.D. dissertation, Department of Sociology and Office of Population Research, Princeton University, 2008; Sarah R. Hayford and S. Philip Morgan, “Religiosity and Fertility in the United States: The Role of Fertility Intentions,” Social Forces, Volume 86, Number 3, pages 1163-1188, March 2008; Evelyn Lehrer, “Religion as a Determinant of Marital Fertility,” Journal of Population Economics, Volume 9, Number 2, pages 173-196, 1996; and William D. Mosher, Linda B. Williams and David P. Johnson, “Religion and Fertility in the United States: New Patterns,” Demography, Volume 29, Number 2, pages 199-214, May 1992. (return to text)

9 Life expectancy at birth is the average number of years a newborn would be expected to live if health and living conditions at the time of his/her birth remained the same throughout his/her life. (return to text)

10 For example, the 2008 World Refugee Survey, conducted by the U.S. Committee for Refugees and Immigrants, found that of the approximately 1.3 million refugees from the Iraq War living in Syria, fewer than 75% were Muslim, although Iraq is nearly 99% Muslim. In addition, data from the 2003 New Immigrant Survey indicate that the proportion of Muslim immigrants to the United States from many Muslim-majority countries is lower than the proportion of Muslims in those countries. Immigrants to the U.S. from Iran, for example, were about 50% Muslim, while Iran’s population as a whole is more than 99% Muslim. (return to text)

11 See, for example, Graham E. Fuller, “The Youth Factor: The New Demographics of the Middle East and the Implications for U.S. Policy,” The Brookings Institution, 2003; and Jack A. Goldstone, “The New Population Bomb,” Foreign Affairs, January/February 2010. (return to text)

Related Factors

The following factors are not direct inputs into the projections, but they underlie vital assumptions about the way Muslim fertility rates are changing and Muslim populations are shifting.

Education

As in the rest of the world, fertility rates in countries with Muslim-majority populations are directly related to educational attainment. Women tend to delay childbearing when they attain higher levels of education. As Muslim women continue to receive more education, their fertility rates are projected to decline.

md2-most and fewer education

The relationship between educational attainment and fertility rates is shown in the scatter plot below. Niger, for example, has an extremely high Total Fertility Rate (an average of 6.9 children per woman), and a girl born there today can expect to receive an average of just four years of schooling in her lifetime. In Libya, by contrast, a girl born today can expect to receive an average of 17 years of education, and the country’s fertility rate is 2.5 children per woman.

md2-eduandfertility

The eight Muslim-majority countries where girls can expect to receive the fewest years of schooling have an average Total Fertility Rate of 5.0 children per woman. That is more than double the average rate (2.3 children per woman) in the nine Muslim-majority countries where girls can expect to receive the most years of schooling.

One exception is the Palestinian territories, which has a relatively high fertility rate (4.5 children per woman) although a girl born there today can expect to receive 14 years of education, on average.12

Economic Well-Being

In Muslim-majority countries, as in many other countries, low economic standards of living are associated with rapid population growth.

In general, among the 24 Muslim-majority countries for which data are available from the U.N., the more people who live in poverty, the higher the national fertility rate, as the scatter plot below illustrates. The reverse is also true: As living standards rise, fertility rates tend to drop.

md2-22

There are a number of reasons why fertility tends to be higher in poor countries. In agricultural societies, high fertility may be related to the desire of families to have more workers. In countries with poor health care infrastructures, families need to have more children to offset high child mortality rates. And in less-developed countries, parents may be more likely to see additional children as wealth-producing resources rather than as wealth-draining obligations.

The 10 Muslim-majority countries with the highest percentages of people living below the poverty line (as defined by each country) are projected to have an average Total Fertility Rate of 4.5 children per woman. That is nearly double the average projected rate (2.4 children per woman) in the 10 Muslim-majority countries with the lowest percentages of people living below the poverty line.

md2-23

At present, Muslim-majority countries overall are among the poorest in the world, as measured by gross domestic product (GDP) per capita in U.S. dollars adjusted for purchasing power parity (PPP).13 Their median GDP per capita of $4,000 is substantially lower than the median for more-developed countries ($33,700) and just slightly higher than the median for less-developed countries where Muslims are in the minority ($3,300).

However, the median GDP per capita figure for all Muslim-majority countries masks an enormous amount of variation from country to country and region to region. For instance, the median GDP per capita in Muslim-majority countries in Middle East-North Africa is $6,000, compared with roughly $1,200 in Muslim-majority countries in sub-Saharan Africa.14 And some oil-rich countries with Muslim majorities, particularly the Gulf states, have median GDPs per capita that are higher than that of the United States.

md2-24

Three of the 10 nations with the world’s highest GDPs per capita are Muslim-majority countries (Qatar, Kuwait and Brunei), but three of the 10 countries with the world’s lowest GDPs per capita also are Muslim-majority countries (Afghanistan, Niger and Somalia).

Although fertility rates in the wealthiest Muslim-majority countries tend to be lower than in other Muslim-majority countries, they still are higher than in many of the world’s wealthiest non-Muslim-majority countries.

Contraception and Family Planning

Use of birth control is significantly lower in Muslim-majority countries than in many other countries, due to more recent adoption of family planning practices, among other factors. This directly contributes to higher fertility in Muslim-majority countries.

Fewer than half of married women ages 15-49 in Muslim-majority countries (47.8%) use any method of birth control. By comparison, 63.3% of married women in the same age group who live in non-Muslim-majority, less-developed countries and 68.5% of those living in moredeveloped countries use some form of birth control. Moreover, the proportion of married women ages 15-49 who use modern methods of contraception (devices or procedures such as condoms, birth control pills, spermicidal foams, intrauterine devices and tubal ligations) is much lower in Muslim-majority countries (39.4%) than in non-Muslim-majority countries (about 58%).

md2-25

Notwithstanding these differences, use of birth control has become a more accepted practice in Muslim-majority countries since the 1990s, contributing to the decline in fertility rates in many of these countries.15

In the 44 Muslim-majority countries for which data on use of birth control are available, 20 report that half or more of married women ages 15-49 practice some form of birth control.

Ten of the 44 countries – Albania, Algeria, Bahrain, Egypt, Indonesia, Iran, Tunisia, Turkey, Turkmenistan and Uzbekistan – report a rate of birth control usage of 60% or more. Topping the list is Iran, where 73% of married women ages 15-49 say they use some form of birth control, the same as in the United States (73%) and substantially higher than the world average for use of birth control among married women ages 15-49 (61%), according to analysis of a 2009 report by the United Nations Population Fund.16

md2-26

In addition to the 20 countries that report a 50% or higher rate of birth control use, 11 other Muslim-majority countries report moderate rates of use among married women (between 20% and 49%). Thirteen countries, mostly in sub-Saharan Africa, report fairly low rates of birth control use among married women (less than 20%).

As the scatter plot on the opposite page shows, use of birth control is strongly correlated with the fertility rate in each country. At one extreme, Muslim-majority countries in sub-Saharan Africa have lower rates of birth control and higher fertility rates. At the other extreme, most Muslim-majority countries in Asia-Pacific and the Middle East-North Africa, as well as Albania in Europe, have higher rates of birth control and lower fertility.

Some Muslim-majority countries, such as Pakistan, Bangladesh, Indonesia, Iran, Turkey and Tunisia, have had family planning programs for several decades, but use of modern forms of birth control did not proliferate until the 1990s. Today, birth control is legal and available in most Muslim-majority countries, and many have government-supported family planning programs.

While some Muslims oppose family planning for political and social reasons, religious authorities generally have held that Islam does not prohibit the use of birth control. Indeed, a number of Islamic jurists have endorsed birth control for the health of the mother and the economic well-being of the family, often citing a verse from the Koran that states: “Allah desires for you ease; He desires no hardship for you.”17

A Note on Abortion

Many Muslim-majority countries do not collect or do not publish data on the frequency of abortions. The partial data that are available do not allow for reliable comparisons of abortion rates in Muslim-majority countries with abortion rates in other countries. However, many Muslim-majority countries either forbid abortions or allow them only under tight restrictions.

md2-27

Urbanization

Slightly more than half of residents of Muslim-majority countries live in rural communities, but they are moving to cities and towns at a faster rate than the populations in other countries of the world, many of which are already heavily urbanized. Because urban dwellers generally have fewer children than people in rural areas, this trend is a contributing factor in the overall decline in fertility rates among Muslims.

md2-28

In general among Muslim-majority countries, there is an association between urbanization and fertility: the higher the portion of the population living in cities and towns, the lower the national fertility rate.

This pattern may be seen even more clearly by comparing fertility rates in the countries with the highest and lowest percentages of people living in urban areas. In the 10 least-urbanized Muslim-majority countries, the average Total Fertility Rate is twice as high (4.8 children per woman) as the average in the 10 most-urbanized Muslim-majority countries (2.4 children per woman).

md2-29

The relationship between urban populations and fertility rates, however, is complex. It can be thought of as a two-stage process (though, in reality, the stages may overlap). First, high fertility rates lead to rapid urban growth as children from large families in rural communities tend to move to cities and towns in search of better economic opportunities. Then, the new urban dwellers gradually adopt the lower fertility patterns characteristic of urban centers, thereby reducing the future number of children.

md2-30

Many Muslim-majority countries are still in the first stage of this process. They have largely rural populations but very rapidly growing cities and towns. About 48% of the total population in Muslim-majority countries lived in urban areas in 2009, and the average annual urban growth rate in 2005-10 in these countries was 3.1%.18 By comparison, in non-Muslim-majority, less-developed countries, 44% of people lived in cities and towns, and the urban growth rate was 2.7%. In more-developed countries, 75% of the population lived in cities and towns, and the urban growth rate was 0.6%.

One reason for a higher rate of urban growth in Muslim-majority countries is the relatively high fertility rate among rural Muslims. Muslim-majority countries in sub-Saharan Africa, which tend to have very high fertility rates, currently have the highest rates of urban growth, an average of 4.2% annually. By contrast, Muslim-majority countries in the Middle East-North Africa and in Asia-Pacific, which tend to have lower fertility rates, also have lower urban growth rates (2.9% and 3.0%, respectively). (For details on fertility see sub-Saharan Africa, Middle East-North Africa and Asia-Pacific.)

The 12 Muslim-majority countries with the highest annual urban growth rates have much higher fertility rates, on average, than the 12 Muslim-majority countries with the lowest annual urban growth rates (4.6 vs. 2.3 children per woman). Qatar is an exception. Being a relatively small and wealthy country, it has a substantial number of immigrants moving to urban areas in search of employment.

md2-31

Conversion

Statistical data on conversion to and from Islam are scarce. What little information is available suggests that there is no substantial net gain or loss in the number of Muslims through conversion globally; the number of people who become Muslims through conversion seems to be roughly equal to the number of Muslims who leave the faith. As a result, this report does not include any estimated future rate of conversions as a direct factor in the projections of Muslim population growth.

Indirectly, however, conversions may affect the projections because people who have converted to or from Islam are included – even if they are not counted separately – in numerous censuses and surveys used to estimate the size of the global Muslim population in 1990, 2000 and 2010.

There are a number of reasons why reliable data on conversions are hard to come by. Some national censuses ask people about their religion, but they do not directly ask whether people have converted to their present faith. A few cross-national surveys do contain questions about religious switching, but even in those surveys, it is difficult to assess whether more people leave Islam than enter the faith. In some countries, legal and social consequences make conversion difficult, and survey respondents may be reluctant to speak honestly about the topic. Additionally, for many Muslims, Islam is not just a religion but an ethnic or cultural identity that does not depend on whether a person actively practices the faith. This means that even nonpracticing or secular Muslims may still consider themselves, and be viewed by their neighbors, as Muslims.

The limited information on conversion indicates that there is some movement both into and out of Islam but that there is no major net gain or loss. For instance, the Pew Forum’s survey of 19 nations in sub-Saharan Africa, conducted in 2009, found that neither Christianity nor Islam is growing significantly at the expense of the other through religious conversion in those countries.19 Uganda was the only country surveyed where the number of people who identified themselves as Muslim was significantly different than the number of people who said they were raised Muslim: 18% of Ugandans surveyed said they were raised Muslim, while 13% now describe themselves as Muslim, a net loss of five percentage points. In every other sub-Saharan Africa country surveyed, the number of people who are currently Muslim is roughly equivalent to the number saying they were raised as Muslims. This does not mean that there is no religious switching taking place. Rather, it indicates that the number of people becoming Muslim is roughly offset by the number of people leaving Islam.

The Pew Forum’s U.S. Religious Landscape Survey, conducted in 2007, found a similar pattern in the United States. In that survey, the number of respondents who described themselves as Muslim was roughly the same as the number who said they were raised as Muslims, and the portion of all U.S. adults who have converted either to or from Islam was less than three-tenths of 1 percent (>0.3%). Due to the relatively small number of Muslims in the nationally representative survey sample, however, it was not possible to calculate a precise retention rate for the Islamic faith in the U.S.20

An independent study published in 2010 that examined patterns of religious conversion among various faiths in 40 countries, mainly in Europe, also found that the number of people who were raised Muslim in those countries, as a whole, roughly equaled the number who currently are Muslim. But the sample sizes for Muslims were so small that the results cannot reliably predict Muslim conversion trends.21


Footnotes

12 The continuation of high fertility despite high education levels among Palestinians has been described as a demographic puzzle. The reasons for it are not entirely clear. Partly, it may reflect the persistence of traditional attitudes in Gaza; studies suggest that fertility has started to drop in the West Bank but not in Gaza. Some studies also find that highly educated Palestinian women are more likely than those who are less-educated to remain single but that married Palestinians tend to have similar numbers of children regardless of their educational level. Some commentators have suggested that high Palestinian birth rates may have a political basis as “weapons against occupation.” But a study of fertility patterns among Palestinians in different political settings does not support this “political fertility” hypothesis. See Marwan Khawaja, “The Fertility of Palestinian Women in Gaza, the West Bank, Jordan and Lebanon,” Population-E, Volume 58, Number 3, pages 273-302, 2003. (return to text)

13 After per capita GDP figures are adjusted for purchasing power parity (PPP), they reflect the value of goods and services produced by each country in one year at a comparable rate in the United States so that comparisons from country to country are more accurate. (return to text)

14 Median GDP per capita is weighted by country populations so that more populous countries affect the average more than smaller countries. (return to text)

15 Studies have found that access to television and other forms of mass media plays a role in social change, including the acceptance of contraception. See, for example, Charles F. Westoff and Akinrinola Bankole, “Mass Media and Reproductive Behavior in Africa,” DHS Analytical Report No. 2, 1997, and Charles F. Westoff and Akinrinola Bankole, “Mass Media and Reproductive Behavior in Pakistan, India, and Bangladesh,” DHS Analytical Report No. 10, 1999. There also is a strong correlation between use of birth control and access to the internet. For example, in the 10 Muslim-majority countries whose populations have the most access to the internet, more than half of married women of reproductive age, on average, use birth control, and the average Total Fertility Rate is 2.1 children per woman. By comparison, in the 10 Muslim-majority countries whose populations have the least access to the internet, only about one-in-five married women of reproductive age use birth control, and the average Total Fertility Rate is more than twice as high (five children per woman). (return to text)

16 United Nations, Department of Economic and Social Affairs, Population Division, 2009, World Contraceptive Use 2009. (return to text)

17 Sura 2:185. See Population Reference Bureau, Islam and Family Planning, MEN A Policy Brief, 2004. For a discussion of the Islamic scholarly consensus in favor of allowing birth control, see Gavin W. Jones and Mehtab S. Karim, Islam, the State and Population, Hearst & Co., 2005. (return to text)

18 For the purposes of this report, a country’s level of urbanization is defined as the percentage of its total population that lives in cities and towns. The urban growth rate is a different measure; it is the average annual increase in the number of urban residents. Thus, a country that is largely rural but with fast-growing cities and towns may be described as having a low degree of urbanization but a high rate of urban growth. (return to text)

19 Results from the survey are published in the Pew Forum’s April 2010 report Tolerance and Tension: Islam and Christianity in Sub-Saharan Africa. (return to text)

20 Because Muslims currently constitute less than 1% of the U.S. adult population, even such large studies as the U.S. Religious Landscape Survey include relatively few Muslim respondents in their representative national samples. Of the more than 35,000 respondents in the Landscape Survey, only 90 said they were raised as Muslims. That number is too small to allow reliable conclusions about the percentage of Americans who leave Islam after being raised in the faith. (return to text)

21 See Robert Barro, Jason Hwang and Rachel McCleary, “Religious Conversion in 40 Countries,” Journal for the Scientific Study of Religion, Volume 49, Number 1, pages 15-36, March 2010. This analysis of patterns of religious conversion among people age 30 and older found little evidence of a significant pattern of conversion to Islam in 40 countries where Islam is a minority religion. However, the country surveys were not designed specifically to study Muslim conversion and had too small a sample of Muslims in each country to draw firm conclusions. The most noticeable pattern of conversion across the 40 countries is movement from having some religious affiliation to having no reported religious affiliation. The cross-national surveys analyzed were conducted in 1991, 1998 and 2001. Overall, less than 1% of all the people surveyed identified as Muslim, according to the authors. (return to text)

Regional Distribution of Muslims

This section of the report looks at the future of the Muslim population in five regions of the world – Asia-Pacific, the Middle East-North Africa, sub-Saharan Africa, Europe and the Americas. Each chapter begins with an overview of the growth patterns among Muslims in the region as a whole. The chapters then present population projections for Muslims at the sub-regional- and country-level.22 The chapters also examine the factors that are influencing the growth of the Muslim population in the various regions, including trends in fertility, life expectancy, migration and age structure. When appropriate, the chapters highlight the situation in countries of special interest.

The five regions are presented in descending order of Muslim population, with the region with the highest number of Muslims (Asia-Pacific) appearing first and the region with the lowest number of Muslims (the Americas) appearing last.

Over the next 20 years, the portion of the world’s Muslims living in the Asia-Pacific region is expected to decline, from 62.1% in 2010 to 59.2% in 2030. The portion of the world’s Muslims living in sub-Saharan Africa will rise, from 15% in 2010 to 17.6% in 2030. The share of the world’s Muslims living in the Middle East-North Africa, Europe and the Americas is expected to remain roughly the same. (See the Executive Summary.)

Asia-Pacific

The number of Muslims in the Asia-Pacific region – which, for purposes of this report, includes not only East Asian countries such as China but also countries as far west as Turkey – is projected to increase from about 1 billion in 2010 to about 1.3 billion in 2030. Read More…

Middle East-North Africa

The Muslim population in the Middle East-North Africa region is expected to grow by more than a third (37%) in the next 20 years. Read More…

Sub-Saharan Africa

The Muslim population in sub-Saharan Africa is projected to grow by nearly 60% in the next 20 years, from 242.5 million in 2010 to 385.9 million in 2030. Read More…

Europe

The number of Muslims in Europe has grown from 29.6 million in 1990 to 44.1 million in 2010.34 Europe’s Muslim population is projected to exceed 58 million by 2030. Read More…

Americas

The number of Muslims in the 51 countries in the Americas is projected to more than double in the next 20 years, from 5.3 million in 2010 to 10.9 million in 2030. Nevertheless, Muslims will remain a small minority in the region, accounting for an estimated 1.0% of the population in 2030, compared with 0.6% in 2010. Read More…


Footnotes

22 In charts and tables throughout this report, “countries” is used loosely to refer both to sovereign nations and to a variety of territories and protectorates. No judgment on their legal status is intended. (return to text)


Region: Asia-Pacific

The number of Muslims in the Asia-Pacific region – which, for purposes of this report, includes not only East Asian countries such as China but also countries as far west as Turkey – is projected to increase from about 1 billion in 2010 to about 1.3 billion in 2030. Nearly three in- ten people living in the Asia-Pacific region in 2030 (27.3%) will be Muslim, up from about a quarter in 2010 (24.8%) and roughly a fifth in 1990 (21.6%).

More than half of the world’s Muslims live in the Asia-Pacific region. However, the region’s share of the global Muslim population is projected to decline somewhat in the next 20 years, from 62.1% in 2010 to 59.2% in 2030. This is because the Muslim population in Asia-Pacific is not growing as fast as the Muslim population in some other regions, such as sub-Saharan Africa and the Middle East-North Africa.

md2-33(2)

The number of Muslims in the Asia-Pacific region is expected to grow at a slower pace in the next two decades than it did in the previous two decades. From 1990 to 2010, the number of Muslims in the region increased by 332.2 million. The number is projected to increase by 290.1 million in the next 20 years.

md2-35(2)

Although Muslim population growth in the region is slowing, it is expected to remain significantly higher than the annual rate of growth of the non-Muslim population in the region. Thus, the Muslim population in the Asia-Pacific region is projected to rise both in absolute numbers and in relative terms, as a share of the region’s total population.

Sub-Regions and Countries in the Asia-Pacific Region

Sub-Regions in Asia-Pacific

More than half of the Muslims in the Asia-Pacific region live in South Asia, which includes three of the five countries in the world with the largest Muslim populations: Pakistan, India and Bangladesh. The rest of the Muslim population in the region is largely divided between Southeast-East Asia, which includes Indonesia, Malaysia and China, and Central-Western Asia, which includes Afghanistan, Iran and Turkey. Far fewer Muslims live in Australia, New Zealand and other parts of the Pacific, which includes many small, island nations.23

md2-36(2)

The Muslim population in South Asia is projected to increase by 176.5 million, from 507.3 million in 2010 to 683.8 million in 2030. Muslims are expected to make up a third of the population of South Asia in 2030 (33.9%), up from 31.4% in 2010 and 28.1% in 1990.

Southeast-East Asia has about half as many Muslims as South Asia. The number of Muslims in Southeast-East Asia is projected to increase by about 49.5 million, from 257.7 million in 2010 to 307.3 million in 2030. Muslims are expected to make up a slightly larger share of the population of the Southeast-East Asia sub-region as a whole in 2030 (12.9%) than in 2010 (12%) or 1990 (10.6%).23

The Muslim population in Central-Western Asia is expected to grow by 63.7 million, from 240 million in 2010 to 303.7 million in 2030. While this sub-region has fewer Muslims than South Asia or Southeast-East Asia, Muslims make up a much larger share of the population. Indeed, more than nine-in-ten people living in Central-Western Asia are Muslim; this percentage is projected to increase slightly over the next 20 years, to 95.2% in 2030 compared with 94.4% in 2010.

Relatively few Muslims live in Australia, New Zealand and other countries in the Pacific sub-region. But the combined number of Muslims in these 24 countries is expected to increase by about 76% in the next 20 years, from 503,000 to 885,000.

Countries in Asia-Pacific

Six of the 10 countries in the world that have the largest number of Muslims in 2010 are in the Asia-Pacific region: Indonesia, Pakistan, India, Bangladesh, Iran and Turkey. All six are expected to remain in the top 10 in 2030.

Spotlight on China Expected Growth of China’s Muslim Population

md2-china

Muslims make up about 2% of the population in China, but because the country is so populous, its Muslim population is expected to be the 19th largest in the world in 2030. The Muslim population in China is projected to increase from 23.3 million in 2010 to nearly 30 million in 2030. Of all the countries in the world where Muslims live as religious minorities, only three others – India, Nigeria and Ethiopia – have more than 20 million Muslims. 1

The number of Muslims in China is expected to grow at a slower rate in the next 20 years than it did in the past two decades. From 1990 to 2010, the number of Muslims in China increased by 6.5 million, a 38.4% increase. The country is expected to add a similar number of Muslims from 2010 to 2030, but because the base number in 2010 is larger than it was in 1990, the projected percentage increase is smaller (28.5%).

md2-china(2)

The fertility rate for Muslims in China is higher than the fertility rate for non-Muslims. Muslim women in China have an average of 1.7 children, compared with a national average of 1.4 children.2 This is one reason the Muslim share of China’s total population is expected to increase slightly in the next 20 years, from 1.8% in 2010 to 2.1% in 2030. Muslims in China are somewhat less urbanized and less educated than the general population. These characteristics are often associated with higher fertility rates. At the time of the 2000 census, 31.2% of Chinese Muslims lived in urban areas, compared with 36.9% of the country’s population as a whole. In the same year, Muslims in China attended school an average of 6.8 years, compared with a national average of 7.6 years.

Muslims are not a new presence in China. Most of China’s Muslim communities, including the Hui, Uygurs and Kazakhs, have lived in China for more than 1,000 years. The largest concentrations of Muslims today are in the Western provinces of Xinjiang, Ningxia, Qinghai and Gansu. A substantial number of Muslims live in the cities of Beijing, Tianjin and Shanghai.


Footnotes

1 As discussed elsewhere in this report, Nigeria will become a Muslim-majority country by 2030. (return to text)

2 There is some debate about the total fertility rate for China as a whole. The United Nations estimates that the rate is 1.8 children per woman. Others, however, including the Pew Forum’s demographic consultants in China, put the figure between 1.4 and 1.5 children per woman. The Pew Forum’s consultants also estimated that Muslim women in China have an average of 0.3 more children than the general population. For more information, see “Fertility Estimates for the Provinces of China, 1975-2000,” National Bureau of Statistics of China and the East-West Center, July 2007, and Baochang Gu and Yong Cai, “Fertility Prospects in China,” United Nations Expert Group Meeting on Recent and Future Trends in Fertility, Population Division, United Nations Department of Social and Economic Affairs, Nov. 17, 2009. (return to text)

By 2030, however, Pakistan is expected to surpass Indonesia as the country with the single largest Muslim population in the world.24 Pakistan’s Muslim population is projected to increase by 78.0 million, from 178.1 million in 2010 to 256.1 million in 2030. Indonesia’s Muslim population is forecast to grow by 34.0 million, from 204.8 million to 238.8 million. Like Pakistan, India and Bangladesh are also each projected to have larger increases in the number of Muslims than Indonesia from 2010 to 2030.

Indonesia’s projected drop from the No. 1 spot is due in part to its declining fertility rate, which is expected to be 2.0 in 2010-15. In Pakistan, by contrast, the fertility rate among Muslim women remains relatively high (an estimated average of 3.6 children per woman in 2010-15), which is one factor driving the expected surge in its Muslim population.

md2-38(2)

India is expected to have nearly as many Muslims as Indonesia by 2030. India’s Muslim population is projected to grow by nearly 60 million, from 177.3 million in 2010 to 236.2 million in 2030. This would be the second-largest projected increase in the number of Muslims in the Asia-Pacific region; Pakistan is the only country in the region expected to have a larger increase. (For more information on India, see sidebar.)

In Bangladesh, the Muslim population is expected to grow by nearly 39 million, from 148.6 million to 187.5 million. Bangladesh now has the fourth-largest Muslim population in the world and in the Asia-Pacific region; it is expected to remain in the fourth spot in 2030.

Iran and Turkey are each expected to add roughly 15 million Muslims to their populations in the next 20 years. Iran’s Muslim population is forecast to grow from 74.8 million in 2010 to 89.6 million in 2030. Turkey’s Muslim population is expected to increase from 74.7 million to 89.1 million.

Afghanistan has a much smaller Muslim population than either Iran or Turkey, but the number of Muslims in Afghanistan is expected to increase by almost 74% in the next 20 years, from 29 million in 2010 to 50.5 million in 2030.

While most people living in Afghanistan are Muslim, Muslims live as minorities in some of the Asia-Pacific countries that are projected to have the greatest proportional increases in the size of their Muslim populations, including New Zealand, Australia and the Philippines. The Muslim population in New Zealand is expected to grow by nearly 150%, from about 41,000 in 2010 to about 101,000 in 2030. By contrast, the country’s non-Muslim population is expected to increase by about 14% during this period.

Spotlight on India Expected Growth of India’s Muslim Population

md2-india

India is projected to have the third-largest Muslim population (in absolute numbers) in the world by 2030, following Pakistan and Indonesia. The Muslim population in India is projected to increase from 177.3 million in 2010 to 236.2 million in 2030. The Muslim share of India’s population is expected to increase from 14.6% in 2010 to 15.9% in 2030. More than one-in-ten of the world’s Muslims (10.8%) will live in India in 2030, about the same as in 2010.

India’s Muslim population is expected to grow at a slower rate in the next 20 years than it did in the previous two decades. The Muslim population in India increased by 76.4 million from 1990 to 2010; it is expected to grow by 58.9 million between 2010 and 2030.1

md2-india3

Fertility rates for all populations in India have been declining in recent years, in part because of increasing use of birth control. However, Muslims in India continue to have more children on average than non-Muslims, mainly because Muslims’ use of birth control still falls below the national average. In 2005-2006, for example, 45.7% of Muslim couples used some form of birth control, compared with 56.3% of couples in the general population, according to an analysis of the National Family Health Survey.

Muslims in India are poorer and less educated than other religious groups. These characteristics are often associated with higher fertility rates. For instance, according to the 2001 census, only 3.6% of Muslims in India age 20 and older are college or university graduates, compared with 6.7% of all Indians in this age group. The literacy rate among Muslim women (50.1%) is lower than the rate among other women in India, including Hindus (53.2%) and Christians (76.2%).

md2-india2

Muslim women also are less likely to work outside the home than non-Muslim women, and employment is associated with lower fertility.

Muslims have lived in India since the advent of Islam. The country’s first mosque is said to have been established around 630 A.D., even before the death of the Prophet Muhammad. 2 The number of Muslims in India declined in 1947 when India gained its independence and an estimated 7 million people migrated from India to Pakistan, but India’s Muslim population has been rising steadily since.

Muslims live throughout India. According to the 2001 census, a large concentration of Muslims lives in two of the largest and poorest states, Uttar Pradesh and Bihar; 35.6% of all the Muslims in India live in these two states. An additional 14.6% of the country’s Muslims live in West Bengal, which adjoins Bihar and borders Bangladesh. The remainder of the country’s Muslim population is scattered in more than 20 other states.

Although Muslims constitute a small minority in most Indian states, they make up roughly a third of the population in Assam (30.9%) and about a quarter of the population in both West Bengal and Kerala. Muslims constitute a majority of the population in the northernmost state of Jammu and Kashmir, where they make up 67.0% of the population.


Footnotes

1 In the Pew Forum’s 2009 report Mapping the Global Muslim Population, India’s population figures were calculated assuming the percentage of Muslims was the same in 2009 as it was in 2001, when the national census was taken. However, the new estimate for 2010 takes into account differential fertility rates between Muslims and non-Muslims in India and arrives at a higher estimate than in the previous report. (return to text)

2 See Aziz Ahmad, An Intellectual History of Islam in India, Edinburgh University Press, 1969. (return to text)

In Australia, the Muslim population is forecast to grow by nearly 80%, from approximately 399,000 to 714,000, while the non-Muslim population is projected to increase by roughly 18%. The Muslim population of the Philippines is projected to increase by about 50%, from 4.7 million in 2010 to about 7.1 million in 2030, while the non-Muslim population is expected to grow by roughly 32%, from 88.9 million to 117.3 million.

With few exceptions, there is not expected to be much change among the Asia-Pacific countries in the percentage of their populations that is Muslim. Kyrgyzstan, in Central- Western Asia, is projected to have the biggest increase. Nearly 94% of its population is expected to be Muslim in 2030, up from about 89% in 2010. As noted in the sidebar on page 76, the percentage of India’s population that is Muslim is expected to increase from 14.6% in 2010 to 15.9% in 2030.

md2-41(2)

Fertility

Fertility rates have fallen in most of the Muslim-majority countries in the Asia-Pacific region in recent decades. Yet they remain, on average, somewhat higher than in other less-developed countries in the region and considerably higher than in more-developed Asia-Pacific countries. This is one of the main reasons that the Muslim population is projected to rise both in absolute numbers and as a share of the region’s population.

md2-41.5

The Asia-Pacific countries classified as more-developed – including Japan, Australia and New Zealand – already have fertility rates significantly below the replacement level of 2.1 children per woman, the minimum necessary to keep the population stable (absent other factors, such as immigration).25 In the Asia-Pacific countries with Muslim majorities – including Indonesia, Iran, Turkey and Malaysia – the average Total Fertility Rate (the total number of children an average woman would have in her lifetime if fertility patterns did not change) has dropped substantially, as shown in the graph on page 79. By 2030, it is projected to reach 2.1 children per woman, which is at or below replacement levels in those countries. However, the rate for Muslim-majority countries in the region is still expected to be somewhat higher than the rate for other developing countries in the region (1.9 children per woman in 2030-35).

md2-42(2)

Among the Muslim-majority countries in the Asia-Pacific region, the highest total fertility rate is in Afghanistan, where the average woman has more than six children during her lifetime. The lowest rate among Muslim-majority countries in the region is in Iran, where the Total Fertility Rate is 1.7 children per woman.

Life Expectancy at Birth

Life expectancy at birth for Muslims in the Asia-Pacific region has been steadily increasing.26 From 1990-95 to 2010-15, average life expectancy at birth in the Muslim-majority countries in the region is expected to rise from 62 to 69; by 2030-35, it is projected to be 74 – the same as for other less-developed countries in the region. However, average life expectancy at birth in the more-developed countries in the region is expected to be 85 – more than a decade longer than in Muslim-majority and other less-developed countries in the region.

md2-43

Brunei has the highest life expectancy at birth (78) among Muslim-majority countries in the region today, and Afghanistan has the lowest (45). Life expectancy in Afghanistan is projected to rise to 53 by 2030-35.

md2-44(2)

Migration

On average, more people are leaving Muslim-majority countries in the Asia-Pacific region than migrating to them. Although the rate of people leaving has declined significantly since 1990-95, Muslim-majority countries in the region are still losing part of their populations to emigration, a trend that is projected to continue over the next 20 years. By 2030-35, Muslim-majority countries in the region are expected to have average annual net losses of 52 people per 100,000 in the general population, down from net losses of 60 people per 100,000 annually in 2010-15. As recently as 1990-95, Muslim-majority countries in the region were losing 142 people per 100,000 annually.

md2-45

Of course, not all people who move from Muslim-majority countries are Muslims. Studies have shown that religious minorities sometimes migrate in larger proportions than religious majorities. (See migration section on page 38.) This is the case for several Muslim-majority countries in Central and Western Asia, including Kazakhstan, Kyrgyzstan, Uzbekistan and Azerbaijan. While some of the people leaving these countries are Muslims moving to other parts of the former Soviet Union, a significant number are ethnic Russians, Germans, Armenians and Jews.

md2-46

Of course, a country’s total gains or losses as a result of net migration rates depend on the total population of the country. In Pakistan, for example, a net loss of 100 people per 100,000 population would amount to a loss of roughly 185,000 people annually. In Azerbaijan, by contrast, this rate of loss would amount to fewer than 9,000 people annually.

A few Muslim-majority countries in the Asia-Pacific region, including Turkey, are experiencing a net inflow of migrants. Previously, Turkey lost more people than it gained, but as the economic situation in the country has improved, population losses have been balanced by population gains, including Turks returning from abroad.

Age Structure

Muslim-majority countries in the Asia-Pacific region have more-youthful populations than other countries in the region. As of 2010, people under age 30 make up about 58% of the population of the region’s 15 Muslim-majority countries. By contrast, less than 30% of people living in more-developed countries in the region are under 30.

A larger percentage of the population in Muslim-majority countries in Asia-Pacific are now in or soon will enter their prime childbearing years (ages 15-29), which is yet another reason for the continued growth of the region’s Muslim population. People ages 15-29 make up 28.5% of the total population in the region’s Muslim-majority countries, compared with 25.7% in other less-developed countries and 16.0% in more-developed countries.

At the same time, as fertility rates drop – meaning that fewer children are born per woman – and life expectancies rise, the Muslim population in the Asia-Pacific region is aging. This is reflected in the median age in Muslim-majority countries in the region, which has climbed from 20 to 25 in the past two decades and is expected to reach 32 years in 2030.

md2-47

Although median ages are rising, Muslim-majority countries in Asia-Pacific are projected to remain relatively youthful in comparison with other countries in the region. By 2030, about 47% of the population in the region’s Muslim-majority countries is expected to be under age 30, compared with about 41% of the population in other less-developed countries in the region and about 24% of the population in the region’s more-developed countries.

md2-48

During the same period, the portion of the population in the 30-44 age group in the region’s Muslim-majority countries is projected to rise only slightly, from 20.8% in 2010 to 21.9% in 2030. The portion of the population that is ages 45-59 is expected to rise more substantially, from 12.8% today to 17.5% in 2030. The fastest growth of all will likely be among those age 60 and older, who are projected to rise from 8.0% to 13.3% of the population in Muslim-majority countries in Asia-Pacific. However, the percentage of the population 60 and older will remain significantly smaller in the region’s Muslim-majority countries than in more-developed countries, where 41.6% of the population is projected to be in this age bracket in 2030.


Footnotes

23 South Asia includes seven countries and territories: Bangladesh, Bhutan, India, Maldives, Nepal, Pakistan and Sri Lanka. Southeast-East Asia includes 19 countries and territories: Brunei, Burma (Myanmar), Cambodia, China, Hong Kong, Indonesia, Japan, Laos, Macau, Malaysia, Mongolia, North Korea, Philippines, Singapore, South Korea, Taiwan, Thailand, Timor-Leste and Vietnam. Central-Western Asia includes 11 countries and territories: Afghanistan, Armenia, Azerbaijan, Cyprus, Iran, Kazakhstan, Kyrgyzstan, Tajikistan, Turkey, Turkmenistan and Uzbekistan. The Pacific includes 24 countries and territories: American Samoa, Australia, Cook Islands, Federated States of Micronesia, Fiji, French Polynesia, Guam, Kiribati, Marshall Islands, Nauru, New Caledonia, New Zealand, Niue, Northern Mariana Islands, Palau, Papua New Guinea, Pitcairn Islands, Samoa, Solomon Islands, Tokelau, Tonga, Tuvalu, Vanuatu, and Wallis and Futuna. The 15 Muslim-majority countries and territories in the Asia- Pacific region are in green. (return to text)

24 Preliminary results from Indonesia’s recent census indicate that the country’s 2010 total population could be as high as 237.6 million, 5 million higher than the U.N.’s 2010 estimate of 232.5 million. If the higher 2010 population estimate were projected forward to 2030 using the methodologies employed in this report, Indonesia’s Muslim population would be 244 million, which still is smaller than Pakistan’s projected Muslim population in 2030 (256.1 million). (return to text)

25 As noted earlier in the report, the replacement level varies depending on mortality rates. In countries with relatively low infant and child mortality, a fertility rate of 2.1 children per woman is sufficient to replenish the population. In countries with high infant and child mortality, the replacement rate may be much higher than 2.1. (return to text)

26 As noted earlier in the report, life expectancy at birth is the average number of years a newborn would be expected to live if health and living conditions at the time of his/her birth remained the same throughout his/her life. (return to text)


Region: Middle East-North Africa

The Muslim population in the Middle East-North Africa region is expected to grow by more than a third (37%) in the next 20 years. It is projected to grow from 321.9 million in 2010 to 439.5 million in 2030, which is more than double the number of Muslims in the region in 1990 (205.9 million). Roughly nine-in-ten people living in the region today are Muslim (91.2% in 2010). This proportion has held fairly steady for the past 20 years and is not projected to change very much in the next 20 years.

md2-49

A fifth of the world’s Muslims (19.9%) now live in the Middle East-North Africa. The region’s share of the global Muslim population is expected to be roughly the same in 2030 (20.1%). The number of Muslims in the Middle East-North Africa is expected to increase by about the same amount in the next 20 years (117.6 million) as it did in the previous 20 years (116 million). However, because the beginning population base in 1990 (205.9 million) was smaller than the beginning base in 2010 (321.9 million), the projected addition of 117.6 million Muslims from 2010 to 2030 would amount to a slowing rate of growth.

The annual growth of the Muslim population in the region is projected to be 1.4% between 2020 and 2030, down from 1.8% between 2010 and 2020 and 2.1% between 2000 and 2010.

Although Muslim population growth in the region is projected to slow over the next 20 years, it is expected to be slightly higher than the projected rate of growth for non-Muslim populations in the region. However, the gap between the growth rates could be wider than currently projected if non-Muslims leave the region in greater proportion than Muslims. For instance, the future growth rate for non-Muslims might be lower than projected if non-Muslim refugees from Iraq now living in Syria and Jordan do not return to their home country and instead permanently migrate out of the region.27

md2-51

Sub-Regions and Countries in the Middle East-North Africa

Sub-Regions in the Middle East-North Africa

The Muslim population in the Middle East has been growing at a faster rate than the Muslim population in North Africa.28 From 1990 to 2010, the Muslim population in the Middle East increased by roughly 80%, from about 70 million to 127 million. During the same period, the Muslim population in North Africa increased by about 44%, from 135 million in 1990 to 195 million in 2010.

The number of Muslims in the Middle East will continue to grow at a faster rate than the number of Muslims in North Africa, largely because Muslims in the Middle East have a higher fertility rate than those in North Africa. But neither sub-region is expected to grow as fast in the next 20 years as it did in the previous two decades. Between 2010 and 2030, the Muslim population in the Middle East is projected to increase by about 47%, from 126.6 million to 186.5 million, while the Muslim population in North Africa is projected to grow by about 30%, from 195.2 million to nearly 253 million.

md2-52

Countries in the Middle East-North Africa

The size of the Muslim population in North Africa reflects the large number of Muslims living in Egypt, which is home to roughly one-in-four Muslims in the region. Egypt’s Muslim population is projected to increase by 25 million in the next 20 years, from 80 million in 2010 to 105 million in 2030 – by far the largest numerical increase of any country in the region.

md2-53

Although Egypt’s Muslim population is expected to grow significantly in absolute numbers in the next 20 years, Egypt is expected to drop from having the fifth-largest Muslim population in the world to having the sixth-largest by 2030, behind Pakistan, Indonesia, India, Bangladesh and Nigeria. This is largely because Egypt is expected to have much lower fertility rates than Nigeria over the next two decades.

Algeria and Morocco currently have the second- and third-largest Muslim populations, respectively, in the Middle East-North Africa region. By 2030, however, Iraq is expected to move into the second spot, largely because it has a substantially higher fertility rate than Algeria and Morocco (see section on fertility in the Middle East-North Africa section.) Iraq’s Muslim population is projected to increase from 31.1 million in 2010 to 48.4 million in 2030. Algeria’s Muslim population is expected to reach 43.9 million in 2030, up from 34.8 million in 2010, giving it the third-largest Muslim population in the region in 2030. Morocco will fall from third place to fifth; its Muslim population is projected to grow from 32.4 million in 2010 to 39.3 million in 2030. Sudan (as currently demarcated) is expected to have the fourth-largest Muslim population in the region in 20 years.

In percentage terms (rather than in absolute numbers), Muslim population growth in the Middle East-North Africa is expected to be most pronounced in the Palestinian territories and Israel, which are each forecast to have about a 66% increase in the size of their Muslim populations by 2030. The Muslim population in the Palestinian territories is projected to increase from 4.3 million in 2010 to 7.1 million in 2030, and the Muslim population in Israel is projected to grow from 1.3 million to 2.1 million during that period. (Israeli population numbers include Muslims living in Jerusalem but not Muslims living in the West Bank and Gaza.)

Yemen’s Muslim population is projected to increase by 62%, from 24 million in 2010 to 39 million by 2030. The Muslim populations in Iraq and Western Sahara are projected to increase by 55%.

Of the five regions covered in this report, the Middle East-North Africa will continue to have the highest percentage of Muslim-majority countries. Of the 20 countries and territories in the region, all but Israel are projected to be at least 50% Muslim in 2030, as is the case today.

Spotlight on Israel

Expected Growth of Israel’s Muslim Population

md2-israel

During the past 20 years, the Muslim population in Israel has more than doubled, growing from 0.6 million in 1990 to 1.3 million in 2010, a 103% increase. In the next 20 years, Israel’s Muslim population is projected to increase by 66%, from 1.3 million in 2010 to 2.1 million in 2030. (Israeli population numbers include Muslims living in Jerusalem but not Muslims living in the West Bank and Gaza.)Israel is the only country in the region where Muslims are currently in the minority. The Muslim share of Israel’s population is projected to increase from 17.7% in 2010 to 23.2% in 2030, a 5.5-point increase. This compares with a 3.6-point increase between 1990 and 2010, when the Muslim share of the population rose from 14.1% to 17.7%.One reason the Muslim population in Israel is increasing so rapidly is because Muslim women in the country are relatively young and many are in or about to enter their prime childbearing years. In 2008, the median age of Muslim women in Israel was 19, compared with 32 for Jewish women, which reflects the overall youthfulness of Israel’s Muslim population.

md2-israel3

Two-thirds of Israeli Muslims are under age 30, according to an analysis of 2009 data from Israel’s Central Bureau of Statistics. Slightly less than half of Jews and other religious groups are in this age category. The youthfulness of Israel’s Muslim population is evident in the graph at right, which shows that about 40% of Israeli Muslims are under age 15. By comparison, about a quarter of Jews and others (which includes Christians, Druze and those not reporting a religious identity) are in this age group.

On the older end of the age spectrum, 15% of Muslims are age 45 and older, compared with about 33% of Jews and 27% of others. Nearly a fifth of Jews in Israel (16%) are age 60 and older, compared with only 5% of Muslims.

md2-israel2

Some segments of the Muslim population in Israel continue to have extremely high fertility rates. For example, Muslim Bedouins from the Southern District, which extends to the Gulf of Aqaba, have about eight children per woman on average. Nevertheless, the average fertility rate among Muslim women in Israel has declined significantly, from a high of about nine children per woman in 1960 to about 3.8 children per woman in 2010. But it is still significantly higher than the average fertility rates for Jewish and Christian women in Israel (2.9 and 2.1 children per woman, respectively). This is the case even though some non-Muslim groups within Israel, including certain groups of Orthodox Jews, also have relatively high fertility rates.

There are six administrative districts within Israel. More than a third of Muslims in Israel (37%) live in the Northern District. A fifth (21%) live in the Jerusalem District, which includes both East and West Jerusalem. Most of the remainder of Israel’s Muslim population live in the Southern District (15%), the Haifa District (14%) and the Central District (11%). Only 1 percent of Israel’s Muslims live in the Tel Aviv District.

Seventeen of the 20 are expected to have a population that is more than 75% Muslim in 2030, with Israel, Lebanon and Sudan (as currently demarcated) being the only exceptions. (See Muslim Population by Country, 1990-2030.)

The only country in the region expected to have a substantial increase in the portion of the population that is Muslim is Israel. Based on this study’s analysis of estimates published by Israel’s Central Bureau of Statistics, the Muslim share of Israel’s population is expected to increase from 17.7% in 2010 to 23.2% in 2030, a 5.5-point increase. (For more information on Israel’s Muslim population, see sidebar.)

Fertility

As recently as 1990-95, women in Muslim-majority countries in North Africa had far fewer children on average (4.2 children) than women in Muslim-majority countries in the Middle East (5.6 children). There is now much less of a difference. In 2010-15, a woman in Muslim-majority countries in the Middle East is expected to have an average of 3.3 children in her lifetime while a woman in Muslim-majority countries in North Africa is expected to have an average of 2.7 children. By 2030-35, fertility rates in the two sub-regions are expected to be essentially the same.

md2-56

Most of the countries in the region with the highest fertility rates are in the Middle East. Yemen tops the list, with an estimated 2010-15 fertility rate of 4.7 children per woman.

md2-57

Life Expectancy at Birth

Average life expectancy at birth has been rising in this region in recent decades, from approximately 65 years in 1990-95 to about 71 years in 2010-15. Life expectancy at birth remains slightly higher in the Muslim-majority countries in the Middle East than in the Muslim-majority countries in North Africa. This is another reason the Middle East’s Muslim population has been growing at a faster pace than the Muslim population in North Africa. The life expectancy gap between the two sub-regions is projected to narrow to 1.6 years by 2030-35.

Of the Muslim-majority countries in the region, Kuwait and the United Arab Emirates are expected to have the highest life expectancies at birth in 2010-15 (78 years), while Yemen and Western Sahara are projected to have the lowest (65 and 68, respectively). However, Yemen and Western Sahara are expected to have the largest gains in longevity in the region by 2030-35.

md2-58

md2-59(2)

Migration

On average, more people are leaving countries in the Middle East-North Africa region than migrating to them. From 2010 to 2015, these countries collectively are expected to lose an annual average of 66 people per 100,000 in the general population.

md2-60

During the same period, Muslim-majority countries in North Africa are expected to have an annual net loss of 67 people per 100,000, which works out to be more than 142,000 people per year. The sub-region is projected to lose 56 people per 100,000 annually in 2030-35, or more than 156,000 people per year.

md2-61

In contrast with North Africa, Muslim-majority countries in the Middle East gained population in the 1990s and early 2000s. Many of the immigrants coming to the Middle East during this period went to the oil-rich Gulf states in search of economic opportunities; other immigrants included people returning to Iraq following the first Gulf War.

However, the Middle East is projected to have an annual net loss of 80 people per 100,000 in 2010-15, or more than 80,000 people per year. This loss reflects the impact of the recent world economic downturn, which has reduced immigration to the Gulf states, and the continuing conflict in Iraq, which has increased migration in the region as a whole. However, Iraq is excluded from the migration trend projections after 2005 because the ongoing conflict there makes projections regarding migration from the country unreliable.

The course of the conflict in Iraq also has implications for migration from neighboring countries such as Syria and Jordan. The U.N. estimates shown in the table on page 101 are based on the assumption that, by 2015, substantial numbers of refugees will be returning from Syria and Jordan to their homes in Iraq or going elsewhere.

md2-62

Projecting the impact of migration on the religious composition of the Middle East is complicated. For example, increased emigration could add to the overall share of Muslims in the region if religious minorities leave in greater proportion than Muslims do, as is now the case in Iraq.29 Conversely, if immigration to the Gulf states were to decrease, this could have the effect of reducing the non-Muslim share of the population, since substantial numbers of immigrants to this part of the Middle East are non-Muslims from countries in South Asia and Southeast Asia, such as the Philippines and India.

Age Structure

As fertility rates in the Middle East-North Africa drop and life expectancies rise, the Muslim population in the region is aging. The median age in the region has risen by five years in recent decades, to 24 years. It is expected to rise by about another five years in the next two decades, to 29 years.

md2-63

Muslim-majority countries in North Africa have somewhat older populations than Muslim-majority countries in the Middle East. By 2030, the median age of the Muslim population in North Africa is projected to be 30 years, compared with 27 years for Muslims in the Middle East. The fact that Muslim-majority countries in the Middle East have a more youthful population than those in North Africa – and therefore more women in or about to enter their prime childbearing years – helps explain why the Middle East is expected to have a faster rate of population growth than North Africa.

Although the population in Muslim-majority countries in the Middle East-North Africa is aging, it is expected to remain relatively youthful. In the Middle East, about 54% of the population in Muslim-majority countries is expected to be under age 30 in 2030; in North Africa, about 49% of the population in Muslim-majority countries is expected to be in this age bracket in 20 years. In Israel, by comparison, the U.N. estimates that about 43% of the general population, which includes a growing share of Muslims, is expected to be younger than 30 in 2030.

md2-64


Footnotes

27 For background information on Iraq’s religious minorities, see “The Plight of Iraq’s Religious Minorities,” Pew Research Center’s Forum on Religion & Public Life, 2008. (return to text)

28 The Middle East includes 13 countries and territories: Bahrain, Iraq, Israel, Jordan, Kuwait, Lebanon, Oman, Qatar, Palestinian territories, Saudi Arabia, Syria, United Arab Emirates and Yemen. North Africa includes seven countries and territories: Algeria, Egypt, Libya, Morocco, Sudan, Tunisia, and Western Sahara. The 19 Muslim-majority countries and territories in the Middle East-North Africa region are in green. (return to text)

29 The 2008 World Refugee Survey by the U.S. Committee for Refugees and Immigrants found that of the approximately 1.3 million refugees from the Iraq War living in Syria, fewer than 75% were Muslim, although Iraq is nearly 99% Muslim. (return to text)


Region: Sub-Saharan Africa

The Muslim population in sub-Saharan Africa is projected to grow by nearly 60% in the next 20 years, from 242.5 million in 2010 to 385.9 million in 2030. Because the region’s non- Muslim population also is growing at a rapid pace, Muslims are expected to make up only a slightly larger share of the region’s population in 2030 (31.0%) than they do in 2010 (29.6%).30 However, Muslims in sub-Saharan Africa will account for a growing share of the global Muslim population. By 2030, 17.6% of the world’s Muslims are expected to be living in sub-Saharan Africa, up from 15% in 2010.

md2-65

The increase in the number of Muslims in sub-Saharan Africa is projected to be greater in the next 20 years than it was in the previous two decades. From 1990 to 2010, the number of Muslims in the region increased by about 103 million. In the next 20 years, the number of Muslims in sub-Saharan Africa is projected to increase by about 143 million.

During the 1990s, sub-Saharan Africa’s non-Muslim population grew at a slightly faster rate than the Muslim population. From 2000 to 2010, however, Muslim population growth in the region surpassed the growth of the non-Muslim population, largely because of Muslims’ higher fertility rates (see page 112). From 2010 to 2030, the growth rate of sub-Saharan Africa’s Muslim population is expected to more closely mirror the growth rate for non-Muslims in the region.

md2-67

Sub-Regions and Countries in Sub-Saharan Africa

Sub-Regions in Sub-Saharan Africa

West Africa is the only sub-region in sub-Saharan Africa with a Muslim majority. In contrast, the southern part of Africa has the smallest Muslim population.31 The number of Muslims in West Africa is projected to increase by more than 60% in the next 20 years, from nearly 160 million in 2010 to about 257 million in 2030. Muslims are projected to make up 55.6% of the population in West Africa in 2030, up from 52.2% in 2010. The most populous country in West Africa is Nigeria, which has the largest Muslim population in all of sub-Saharan Africa. (For more information on Nigeria)

md2-68

md2-69

The Muslim population of East Africa, which includes Ethiopia, Kenya, Tanzania and Uganda, is projected to increase from 70.3 million in 2010 to 109.5 million in 2030. Over the same period, however, the share of East Africa’s population that is Muslim is expected to decline slightly, from 21.5% to 21.1% in 2030.

Muslims account for less than 10% of the population in Middle Africa, which includes Cameroon, Congo and the Republic of Congo. The Muslim population in this part of Africa is expected to increase from 11.8 million in 2010 to 18.4 million by 2030. The Muslim share of the population is expected to remain at roughly 9%.

Southern Africa is forecast to have roughly the same number and share of Muslims in 2030 as in 2010. The Muslim population is expected to increase slightly, from 757,000 in 2010 to 824,000 in 2030. The Muslim share of Southern Africa’s population is projected to remain at 1.3%.

Countries in Sub-Saharan Africa

Nigeria’s Muslim population is expected to increase by more than 41.1 million from 2010 to 2030, rising from 75.7 million in 2010 to 116.8 million in 2030.32 This is by far the largest projected increase in sub- Saharan Africa. As noted earlier in this report, Nigeria is projected to become a Muslim-majority country by 2030. Of the nine other countries in the region that are expected to have the biggest increases in the number of Muslims, six are Muslim-majority – Niger, Burkina Faso, Mali, Senegal, Somalia and Guinea.

Niger, which is expected to have the second-largest numerical increase in the size of its Muslim population, will also have the largest percentage increase in the number of Muslims. Its Muslim population is expected to increase by more than 100%, from 15.6 million in 2010 to 32 million in 2030. Two countries with relatively small Muslim populations – Rwanda and Gabon – are among those expected to have the greatest proportional increases in the size of their Muslim populations over the next 20 years. Rwanda’s Muslim population is expected to increase by 92.8%, from 188,000 in 2010 to 363,000 in 2030, while Gabon’s Muslim population is expected to increase by 68.2%, from 145,000 to 244,000. In addition to Nigeria, Ivory Coast, Gabon and Ghana are expected to have the largest increases in the share of their population that is Muslim.

Spotlight on Nigeria Expected Growth of Nigeria’s Muslim Population

md2-70.5

The Muslim population in Nigeria is projected to increase by more than 50% in the next 20 years, from about 76 million in 2010 to about 117 million in 2030. If current trends continue, Nigeria will have a slight Muslim majority by 2030. According to the projections in this report, Muslims are expected to make up 51.5% of the population in 2030, up from 47.9% in 2010.1

The projected increase in Nigeria’s Muslim population is primarily due to high fertility rates. Although the rates vary considerably throughout the country, the average fertility rate for Muslim women in Nigeria is between six and seven children per woman, compared with an average of five children per woman for non-Muslims.

md2-nigeria2

High fertility rates among Nigeria’s Muslims are related to factors such as lower levels of education and lower use of birth control. According to a Pew Forum analysis of the 2008 Nigerian Demographic and Health Survey, the percentage of women of childbearing age who cannot read is three times as high among Muslims (71.9%) as among non-Muslim Nigerians (23.9%). Muslim women of childbearing age are also much less likely to have received a formal education than are other women in the country; 66.0% of Muslim women have no formal education, compared with 11.2% of non-Muslims. Only about 3% of Muslim women in Nigeria have attended college or university, compared with roughly 14% of non-Muslim women.

According to the 2008 Nigerian Demographic and Health Survey, Muslim women in Nigeria marry more than three years earlier on average than non-Muslim women (15.9 years for Muslims, compared with 19.5 years for non-Muslims). Also, 81.3% of Muslim women say they do not intend to use birth control, compared with 51.2% of non-Muslim women.

Geographically, Muslims are more concentrated in the northern part of Nigeria and Christians in the southern part, while the mid-section of the country is more religiously mixed.


Footnotes

1 This sidebar updates information on Nigeria contained in the Pew Forum’s 2009 report, Mapping the Global Muslim Population. That report, which was based on the 2003 Nigerian Demographic and Health Survey (NDHS), estimated that Muslims made up 50.4% of Nigeria’s population. But the results of the 2008 Nigerian Demographic and Health Survey, which were made public after the release of the Pew Forum’s 2009 report, contradicted the 2003 NDHS, saying Muslims accounted for 45% of the population. Given the conflicting findings, this report averaged the two NDHS estimates and then projected the average forward to 2010, based on the most recent demographic growth rates for religious groups in the country. The report takes this approach because it is highly unlikely that the Muslim population in Nigeria declined by five percentage points between 2003 and 2008, given past census and NDHS trends that put the Muslim proportion of Nigeria’s population at between 47% and 48%. (return to text)

md2-70

Fertility

md2-71

Fertility rates in sub-Saharan Africa – both in Muslim-majority countries and non-Muslim-majority countries – are among the highest in the world. Women in Muslim-majority countries in the region have, on average, more than twice as many children as women in Muslim-majority countries in the rest of the world.33 They also have about one child more on average than women living in non- Muslim-majority countries in sub-Saharan Africa.

Fertility rates in Muslim-majority countries in sub-Saharan Africa are expected to decline in the next 20 years. But the declines will likely not be as large as the declines in Muslim-majority countries in other regions of the world. As a result, Muslim-majority countries in sub-Saharan Africa are still expected to have some of the highest fertility rates in the world in 2030 (an average of 3.8 children per woman in 2030).

Among the 13 Muslim-majority countries in sub-Saharan Africa, Chad, Somalia and Burkina Faso are expected to have the greatest declines in fertility in the next 20 years.

md2-72

Life Expectancy at Birth

In the next 20 years, Muslim-majority countries in sub-Saharan Africa collectively are projected to have bigger increases in life expectancy at birth than Muslim-majority countries in any other region, primarily because of advances in health care and living standards.

md2-73

As recently as 1990-95, average life expectancy at birth in the region’s Muslim-majority countries was only 47 years. Today, average life expectancy at birth in these countries is 54 years. By 2030-35, it is expected to be 62 years, a 15-year increase from 1990.

md2-74

If current trends continue, life expectancy at birth in the region’s Muslim-majority countries will narrowly surpass that in non-Muslim-majority countries within 20 years. Among the possible reasons for this is that Muslim-majority countries in sub-Saharan Africa have a lower prevalence of HIV than non-Muslim-majority countries in the region. Although HIV may be underreported in some Muslim societies, this study’s analysis of 2009 data from the U.N. finds that less than 2% of people ages 15-49 in Muslim-majority countries in sub-Saharan Africa are HIV positive, compared with nearly 6% of the population in non-Muslim-majority countries in the region. Average life expectancy at birth today varies significantly among the 13 Muslim-majority countries in the region, from a high of 76 in Mayotte, in East Africa, to a low of 49 in Sierra Leone, in West Africa. Niger, also located in West Africa, is expected to have the biggest increase in life expectancy at birth (nine years) in the next 20 years.

Life expectancy is often influenced by economic conditions, such as income levels and purchasing power. Sub-Saharan Africa is a poor region relative to the rest of the world. Both Muslim-majority and non- Muslim-majority countries in the region have considerably lower gross domestic products (at purchasing power parity) than the world median of $6,600. But Muslim-majority countries in sub-Saharan Africa have slightly lower median per capita GDPs ($1,200) than non-Muslim-majority countries in the region ($1,500).

Migration

md2-75

md2-76

Muslim-majority countries in sub-Saharan Africa are losing far fewer people today as a result of emigration than they did in the early 1990s. From 1990-95, these countries lost an annual average of nearly 500 people per 100,000 in the general population, largely as a result of conflicts in Sierra Leone and Somalia.

Muslim-majority countries in sub-Saharan Africa now lose an average of 108 people per 100,000 annually through emigration. Loss from migration is projected to decline to 56 people per 100,000 annually by 2030-35, equal to the loss from migration projected for Muslim-majority countries in North Africa.

Mali now has an annual net loss of nearly 300 people per 100,000,which works out to more than 38,000 people per year. Chad has an annual net loss of nearly 200 people per 100,000, which works out to more than 22,000 people per year.

Age Structure

The population of sub-Saharan Africa – both Muslim and non-Muslim – is much younger, on average, than the population in other regions. The median age in Muslim-majority countries in sub-Saharan Africa in 2010 is just 17; in non-Muslim-majority countries in the region it is 19. By comparison, the median age in all Muslim-majority countries worldwide is 24, while the median age in non-Muslim-majority, less-developed countries is 27, and in more-developed countries it is 40.

md2-77

Among the Muslim-majority countries in the region, Niger has the youngest median age (15) in 2010. Mayotte (a small island territory in the Indian Ocean near Madagascar) is expected to have the largest increase in median age (eight years) over the next 20 years.

md2-78

Muslim-majority and non-Muslim-majority countries in the region have similar age structures. In the region’s Muslim-majority countries, about 45% of the population is under age 15; in non-Muslim-majority countries in the region, roughly 42% of the population is in this age group. These percentages will drop somewhat by 2030, to about 39% in Muslim-majority countries and to approximately 36% in non-Muslim-majority countries.

md2-79


Footnotes

30 As recently as a century ago, both Muslims and Christians accounted for small minorities in sub-Saharan Africa, as discussed in the preface to the Pew Forum’s 2010 report Tolerance and Tension: Islam and Christianity in Sub-Saharan Africa. (return to text)

31 East Africa includes 19 countries and territories: Burundi, Comoros, Djibouti, Eritrea, Ethiopia, Kenya, Madagascar, Malawi, Mauritius, Mayotte, Mozambique, Reunion, Rwanda, Seychelles, Somalia, Tanzania, Uganda, Zambia and Zimbabwe. Middle Africa includes nine countries and territories: Angola, Cameroon, Central African Republic, Chad, Congo, Equatorial Guinea, Gabon, Republic of Congo, and Sao Tome and Principe. Southern Africa includes five countries and territories: Botswana, Lesotho, Namibia, South Africa and Swaziland. West Africa includes 17 countries and territories: Benin, Burkina Faso, Cape Verde, Ivory Coast, Gambia, Ghana, Guinea, Guinea Bissau, Liberia, Mali, Mauritania, Niger, Nigeria, St. Helena, Senegal, Sierra Leone and Togo. The 13 Muslim-majority countries and territories as of 2010 in sub-Saharan Africa are in green. (return to text)

32 Nigeria is projected to become a Muslim-majority country sometime between 2020 and 2030. It is not included as a Muslim-majority country in the charts and tables in this chapter to allow the comparisons among groups of countries to remain consistent across the four decades covered in this report. (return to text)

33 As noted earlier, Nigeria is counted as a non-Muslim-majority, less-developed country in the charts and tables in this chapter. (return to text)


Region: Europe

The number of Muslims in Europe has grown from 29.6 million in 1990 to 44.1 million in 2010.34 Europe’s Muslim population is projected to exceed 58 million by 2030. Muslims today account for about 6% of Europe’s total population, up from 4.1% in 1990. By 2030, Muslims are expected to make up 8% of Europe’s population. Although Europe’s Muslim population is growing, Europe’s share of the global Muslim population will remain quite small. Less than 3% of the world’s Muslims are expected to be living in Europe in 2030, about the same portion as in 2010 (2.7%).

md2-80

Most European Muslims will continue to live in Eastern Europe, but some of the biggest increases in Europe’s Muslim population in absolute numbers over the next 20 years are expected to occur in the United Kingdom, France, Italy, Germany and other countries in Western, Northern and Southern Europe.

md2-82

The number of Muslims in Europe is expected to grow by about the same amount in the next 20 years as it did in the previous two decades. From 1990 to 2010, the number of Muslims in Europe increased by about 14.5 million. In the next 20 years, the number of Muslims in the region is forecast to increase by roughly 14 million, albeit from a higher base.

In annual percentage terms, Europe’s Muslim population is projected to grow at a declining rate, in part because of falling fertility rates and in part because Muslim immigration to Europe is leveling off (see discussion of fertility on page 132 and of migration on page 133). Nevertheless, Europe’s Muslim population will continue to grow at a faster pace than its non-Muslim population, which has been decreasing. As a result, Muslims are expected to make up a growing share of Europe’s total population.

Sub-Regions and Countries in Europe

Sub-Regions in Europe

Eastern Europe will continue to have the largest number of Muslims in Europe, but Western Europe, Southern Europe and Northern Europe are expected to have bigger increases in the size of their Muslim populations – both in absolute numbers and as a share of their total populations.35

md-83

Western Europe, which includes France, Germany and the Netherlands, is expected to have the biggest numerical increase in the size of its Muslim population. The number of Muslims living in this part of Europe is projected to increase by 5.1 million, from 11.3 million in 2010 to 16.4 million in 2030. The Muslim share of Western Europe’s total population is expected to increase from 6.0% in 2010 to 8.6% in 2030.

The number of Muslims living in Northern Europe, which includes the United Kingdom, is expected to increase from 3.8 million in 2010 to 7.5 million in 2030. Muslims are expected to make up 7.0% of Northern Europe’s population, up from 3.8% in 2010.

md2-84

md2-85

The number of Muslims in Southern Europe – which includes Balkan countries such as Albania, Bosnia-Herzegovina, Croatia, Kosovo, Montenegro, Republic of Macedonia and Serbia, as well as Greece, Italy, Portugal and Spain – is projected to increase by 3.1 million, from 10.7 million in 2010 to 13.8 million in 2030. Southern Europe as a whole has a higher proportion of Muslims than Eastern Europe; 6.9% of the population in Southern Europe today is Muslim, compared with 6.2% of the population in Eastern Europe. By 2030, 8.8% of people living in Southern Europe are expected to be Muslim, compared with 7.6% of the population in Eastern Europe.

Most of the growth in Eastern Europe’s Muslim population during the decades studied occurred from 1990 to 2000, when the percentage of Muslims in the population jumped from 4.9% to 6.2%. This increase followed the collapse of communism, when religious identity and expression became more acceptable throughout Eastern Europe. The total number of Muslims in Eastern Europe is expected to increase from 18.4 million in 2010 to 20.6 million in 2030.

While many Muslims living in Western and Northern Europe are relatively recent immigrants (or the children or grandchildren of immigrants), most of those in Russia and other parts of Eastern Europe belong to populations that are centuries old. Nevertheless, immigration continues to be a factor in the growth of Eastern Europe’s Muslim population, especially as Muslims continue to move from former Soviet republics to Russia in search of economic opportunities.

Muslims in the eastern parts of Southern Europe, including Albania and Kosovo, tend to belong to long-established Muslim communities, while Muslims in the rest of Southern Europe, stretching from Italy to Portugal, tend to be more recent immigrants.

Countries in Europe

Russia will continue to be the European country with the largest Muslim population in the next 20 years. (For more information on Russia’s Muslim population, see sidebar on page 128.) The number of Muslims in Russia is expected to grow from 16.4 million in 2010 to 18.6 million in 2030. Muslims are projected to make up 14.4% of Russia’s total population in 2030, up from 11.7% in 2010.

Spotlight on Russia

Expected Growth of Russia’s Muslim Population

md2-russia

Russia has the largest Muslim population in absolute numbers in all of Europe. The number of Muslims in Russia is projected to increase from about 16.4 million in 2010 to about 18.6 million in 2030. The Muslim share of the country’s population is expected to increase from 11.7% in 2010 to 14.4% in 2030.

The growth rate for the Muslim population in the Russian Federation is projected to be 0.6% annually over the next two decades. By contrast, Russia’s non-Muslim population is expected to shrink by an average of 0.6% annually over the same 20-year period.

md2-russiamap

Several factors contribute to the projected growth of Russia’s Muslim population. For instance, Muslim women generally have more children than other women in Russia (an estimated 2.3 children per woman, compared with a national average of fewer than 1.5 children per woman).1 Higher Muslim fertility is directly related to the fact that Muslim women marry in larger numbers and divorce less often than other women in Russia. This means they spend longer periods of their lives in unions where childbearing is more likely. And although the abortion rate in Russia is still among the highest in the world, research suggests that Muslim women have fewer abortions on average than other women in Russia. 2

Another reason the Muslim population in Russia is expected to increase is that nearly half of the country’s Muslims are under age 30, according to an analysis of data from Russia’s 2002 census. By comparison, about 40% of ethnic Russians are in this age group. Nearly a quarter of Russia’sMuslims (22.8%) are under age 15, compared with roughly one-in-six ethnic Russians (15.9%). 3

md2-russia2

On the older end of the age spectrum, about 27% of Russia’s Muslims are age 45 and older, compared with about 38% of ethnic Russians. And 13.1% of Muslims in Russia are age 60 and older, compared with nearly a fifth of the ethnic Russian population (19.1%).

The Muslim population in Russia is geographically concentrated in a few regions. As of 2009, four-in-five Muslims in Russia resided in two of the seven federal districts, the Volga and Southern districts. Among the 89 sub-regions of Russia in 2009, Muslims were concentrated in five traditionally Muslim homelands: Dagestan (16.3% of all Muslims), Bashkortostan (14.6%), Tatarstan (13.5%), Chechnya (7.4%) and Kabardino- Balkaria (4.7%). Smaller numbers of Muslims lived in three other Muslim homelands: Ingushetia (3.0% of all Muslims), Karachaevo-Cherkessia (1.9%) and Adygea (0.8%). Altogether, about two-thirds of all Muslims in Russia (62.3%) resided in one of the traditionally Muslim homelands.

Moscow has become a migration magnet for people from elsewhere in Russia, as well as beyond Russia. More than 600,000 Muslims reside in Moscow (3.7% of all Muslims in Russia) and an additional 517,000 live in the oil-rich Tyumen region (3.0%), which borders Kazakhstan to the south.


Footnotes

1 The fertility rate estimate for Muslims is based on an analysis of the number of children ever born to Muslim women in Russia ages 40-49. (return to text)

2 By some estimates, 45% of all pregnancies in Russia end in abortion. Some researchers suggest that the rate among Muslims is significantly lower. See Judyth Twigg, “Differential Demographics: Russia’s Muslim and Slavic Populations,” PON ARS Policy Memo No. 388, December 2005. (return to text)

3 The Russian census did not ask about people’s religious affiliation, but it did ask about their ethnicity, which is highly correlated with religious identity in Russia. Of the 184 ethnic groups identified in the 2002 Russian census, 56 are predominantly Muslim. Two Muslim groups with homelands along the Volga River, the Tatars and Bashkirs, make up nearly half of the Muslims in Russia. The Tatars represent about a third of Russia’s Muslim population, while the Bashkirs make up about a tenth (11%). Chechens are the third-largest ethnic Muslim group, accounting for about 10% of Russia’s Muslims. Some other significant ethnic Muslim groups either have populations concentrated in the Caucasus or have homelands outside of Russia (e.g., Kazakhs, Azeris, Uzbeks, Tajiks, Turkmen and Kyrgyz). Most of the ethnic groups classified as Muslim are quite small, making up less than 1% of the total Muslim population in Russia. While ethnicity and religion are closely related in Russia, they are not identical. An analysis by Pew Forum staff of data from the 2004 Russia Generations and Gender Survey, carried out by the U.N. Economic Commission for Europe, suggests that more than 5% of people with traditionally Muslim ethnicities (or whose native language is traditionally considered a Muslim language) are Christian. Even larger percentages indicate they have no religion. At the same time, ethnicities not generally counted as Muslim also include people who identify themselves as Muslims. For instance, 0.1% of ethnic Russians, including those who list Russian as their native language, identified as Muslim in the 2004 Generations and Gender Survey. (return to text)

The United Kingdom is expected to have the largest increase in the number of Muslims in Europe in the next 20 years. The number of Muslims in the U.K. is projected to almost double from 2.9 million in 2010 to 5.6 million in 2030. By 2030, Muslims are expected to make up 8.2% of the U.K.’s population, up from 4.6% in 2010. The United Kingdom is forecast to have roughly the same number of Muslims as Germany by 2030.

md2-86

France’s Muslim population is expected to climb from 4.7 million in 2010 to 6.9 million in 2030. Germany’s Muslim population is expected to increase from 4.1 million to 5.5 million during this period. Although Italy, Sweden, Spain, Belgium and Austria have smaller numbers of Muslims than the U.K., Germany and France, their Muslim populations are forecast to grow significantly in the next 20 years. The Muslim populations in Italy and Sweden are projected to more than double in size, while those in Spain, Belgium and Austria will likely increase significantly.

Though Ireland has a relatively small Muslim population, it is expected to have the largest percentage increase in Europe in the number of Muslims. Its Muslim population is projected to increase by almost 188%. Other European countries expected to have percentage increases of more than 100% include Finland, Norway, Sweden and Italy. Countries projected to have percentage increases of 50-100% include the United Kingdom, Spain, Belgium, Austria and Switzerland. The Republic of Macedonia is projected to have the largest increase in the portion of its population that is Muslim. By 2030, Muslims are expected to make up 40.3% of Macedonia’s population, up 5.4 percentage points from 2010 (34.9% Muslim). In Sweden, the Muslim share of the population is projected to increase by five percentage points, from 4.9% in 2010 to 9.9% in 2030.

md2-89

In 2030, Muslims are projected to make up more than 10% of the total population in 10 European countries: Kosovo (93.5%), Albania (83.2%), Bosnia-Herzegovina (42.7%), Republic of Macedonia (40.3%), Montenegro (21.5%), Bulgaria (15.7%), Russia (14.4%), Georgia (11.5%), France (10.3%) and Belgium (10.2%).

Fertility

One reason the Muslim population of Europe is projected to rise, both in absolute numbers and as a percentage of the population, is because Muslims’ fertility rates are generally higher than those of non-Muslims in Europe.

md2-90

Based on an analysis of current trends in the 25 European countries for which data are available, Muslim women today will have an average of 2.2 children each, compared with an estimated average of 1.5 children each for non-Muslim women in Europe.36 However, the fertility gap between Muslims and non-Muslims in Europe is expected to narrow in the coming years. By 2025-30, the average fertility rate for Muslim women in the 25 countries for which data are available is expected to drop to 2.0 children per woman, while the average fertility rate for non- Muslim women is projected to increase slightly, to 1.6 children per woman.

md2-91

With the exception of Bosnia-Herzegovina, the fertility rate for Muslims is higher than that for non-Muslims in each of the countries in Europe for which data are available. Among the countries where the gap is particularly large is Norway, where the fertility rate for Muslims is 3.1 children per woman, compared with 1.8 children per woman for non-Muslims. Large gaps in fertility rates between Muslims and non-Muslims also exist in Austria, Finland, Ireland, Kosovo, Serbia and the United Kingdom. In countries where the gap is larger, it will likely take more time for Muslim and non-Muslim fertility rates to converge.

Sex Ratios

The ratio of men to women also will have an impact on Muslim fertility rates in coming decades. When a population has more men than women, the number of births tends to be lower than if the population is more balanced. Immigrant populations, including Muslims in Europe, generally have more men than women, as many male workers leave their families behind when they go abroad in search of better economic opportunities. For this reason, sex ratios tend to be higher in European countries where Muslim immigrants have come primarily in search of employment, such as Spain.

Spain – which has a large number of Muslim immigrants from North Africa, particularly Morocco – now has the highest ratio of Muslim men to Muslim women in Europe (about 190 Muslim men for every 100 Muslim women). That ratio is projected to narrow by 2030, to about 133 Muslim men for every 100 Muslim women, as families join Muslim men who immigrated alone in search of employment.

Italy is expected to have the highest ratio of Muslim men to Muslim women by 2030. Italy now has about 157 Muslim men for every 100 Muslim women. This ratio will drop to about 137 Muslim men for every 100 Muslim women by 2030, slightly above the projected level for Spain. Italy’s Muslim population includes a large number of immigrants from Albania and North Africa.

Not all countries with a high number of Muslim immigrants have a significant imbalance between the number of Muslim men and women, however. For example, France – currently the European country with the second-largest Muslim population, after Russia – has about 97 Muslim men for every 100 Muslim women.

Life Expectancy at Birth

Life expectancy data by religious affiliation are not available for countries in Europe. The projections in this report assume that Muslims have the same life expectancy as the general population.

Migration

A major factor in the growth of Europe’s Muslim population in recent decades has been the large influx of immigrants from South Asia, North Africa, Turkey and other parts of the developing world.37

Spain is likely to remain an important destination for Muslim immigrants to Europe in 2010-15. Spain was expected to see a net gain of 70,000 Muslim immigrants in 2010; the largest number were expected to come from Morocco.38 Muslims are estimated to make up a relatively small minority of Spain’s immigrants in 2010 (13.1% of all new immigrants), but Muslims’ proportion of new immigrants to Spain is nearly six times as large as their share of Spain’s total population (2.3% in 2010).39

md2-92

In France, as of mid-2010, Muslims were expected to account for more than two-thirds of all new immigrants (68.5%) for the year. France was expected to see a net gain of almost 66,000 Muslim immigrants in 2010, primarily from North Africa.

The United Kingdom’s net inflow of Muslim immigrants in 2010 (64,000) was forecast to be nearly as large as France’s. More than a quarter of all immigrants to the U.K. in 2010 (28.1%) were expected to be Muslim.

md2-93

This report’s projections for Muslim immigration to Europe are based on projections made by Eurostat and the United Nations. The Eurostat and U.N. projections, however, do not include data on religious groups; they project future numbers of immigrants and emigrants only by nationality. The estimated proportion of Muslims among European immigrants and emigrants was calculated using data from the World Religion Database on the religious composition of their countries of origin. For the United Kingdom, France, Italy, Ireland, Belgium, Norway and Switzerland, additional information on immigrants and emigrants was obtained from national statistical offices.

Based on current economic, political and social conditions, European countries on the whole will likely continue to be a draw for Muslim immigrants in the years ahead. But several European countries that have been a major destination for Muslims are projected to have fewer Muslim immigrants in the five-year period from 2025 to 2030 than in the period from 2010 to 2015.

Age Structure

Generally speaking, Muslim populations in Europe today are more youthful than their non- Muslim counterparts. People under age 30 comprise about 49% of the Muslim population in Europe in 2010, compared with about 34% of the non-Muslim population. Europe’s Muslim population is projected to remain relatively youthful in the coming two decades. In 2030, about 42% of Europe’s Muslim population is expected to be under age 30, compared with about 31% of the non-Muslim population.

md2-94

Over the next 20 years, however, both Muslims and non-Muslims in Europe are expected to see a decline in the portion of their populations between ages 15 and 29 (those approaching or already in their prime childbearing years). People between 15 and 29 are expected to make up about 21% of Europe’s Muslim population in 2030, down from about 26% in 2010. The portion of Europe’s non-Muslim population in this age group is expected to decline from about 19% in 2010 to roughly 16% in 2030.

At the same time, the portion of Europe’s Muslim population age 60 and older is projected to rise from almost 11% in 2010 to about 16% in 2030. While this represents a substantial increase, the portion of the non-Muslim population in the 60-and-older age group (31%) will be approximately double that of Muslims.


Footnotes

34 The 2010 population estimates for 25 of the 50 European countries and territories vary significantly from the 2009 estimates contained in the Pew Forum’s 2009 report Mapping the Global Muslim Population. The updated estimates take into account new and better sources of data that have become available since the first report was published. They also reflect differences between the methodology used in this report and the one used in the 2009 report. (See methodology.) The 2010 estimates were calculated primarily by the staff of the Age and Cohort Change project of the International Institute for Applied Systems Analysis, Laxenburg, Austria. Updated population estimates are used for the following countries: Albania, Austria, Belgium, Bosnia-Herzegovina, Bulgaria, Denmark, Finland, France, Georgia, Germany, Greece, Ireland, Italy, Kosovo, Luxembourg, Montenegro, Netherlands, Norway, Portugal, Republic of Macedonia, Romania, Serbia, Spain, Sweden, Switzerland, Ukraine and United Kingdom. In all but a few cases, the 2010 estimates are higher than the 2009 estimates. In the Netherlands, for example, the percentage of the population that is Muslim in 2010 (5.5%) is actually lower than the percentage reported in the 2009 Pew Forum report (5.7%). IIASA used a newer source from Statistics Netherlands to calculate the 2010 estimate. (return to text)

35 Eastern Europe includes 11 countries and territories: Belarus, Bulgaria, Czech Republic, Georgia, Hungary, Moldova, Poland, Romania, Russia, Slovakia and Ukraine. Northern Europe includes 13 countries and territories: Channel Islands, Denmark, Estonia, Faeroe Islands, Finland, Iceland, Ireland, Latvia, Lithuania, Isle of Man, Norway, Sweden and United Kingdom. Southern Europe includes 17 countries and territories: Albania, Andorra, Bosnia-Herzegovina, Croatia, Gibraltar, Greece, Italy, Kosovo, Malta, Montenegro, Portugal, Republic of Macedonia, San Marino, Serbia, Slovenia, Spain and Vatican City. Western Europe includes nine countries and territories: Austria, Belgium, France, Germany, Liechtenstein, Luxembourg, Monaco, Netherlands and Switzerland. The two Muslim-majority countries in Europe are in green. (return to text)

36 The average fertility rate of 2.2 children per woman among Muslims in Europe is weighted by country population so that the most populous countries affect the average more than the smaller countries. The same is true for the average fertility rate for non-Muslim women. (return to text)

37 For background information, see the Pew Forum’s 2010 report Muslim Networks and Movements in Western Europe. (return to text)

38 Spain has an even larger number of immigrants coming from other European countries and from South America. Sizable numbers of immigrants to Spain also come from Asia, including recent immigrant streams from China. As the table on page 135 shows, the annual number of Muslim immigrants to Spain is projected to drop sharply by 2025-30, primarily because many of the Muslim immigrants to Spain are temporary workers facing declining economic prospects. (return to text)

39 Data on numbers and nationalities of immigrants and emigrants from the countries discussed in this section are provided by Eurostat, the U.N. and country statistical offices. The proportion of Muslims among these immigrants and emigrants is assumed to be the same as the proportion in the general population in their countries of origin. (return to text)


Region: Americas

The number of Muslims in the 51 countries in the Americas is projected to more than double in the next 20 years, from 5.3 million in 2010 to 10.9 million in 2030. Nevertheless, Muslims will remain a small minority in the region, accounting for an estimated 1.0% of the population in 2030, compared with 0.6% in 2010. Muslims in the Americas also will continue to represent a small share of the global Muslim population. The percentage of the world’s Muslims living in the Americas is expected to remain roughly the same (0.5% in 2030, compared with 0.3% in 2010).

Most of the projected growth in the region’s Muslim population will take place in North America, particularly in the U.S. and Canada. If current trends continue, the Muslim population in the United States is projected to more than double in the next 20 years, from 2.6 million in 2010 to 6.2 million in 2030.40 Canada’s Muslim population is expected to nearly triple, climbing from 940,000 in 2010 to 2.7 million in 2030.

md2-95

The Americas is the only region where the percentage increase in the number of Muslims will be greater from 2010 to 2030 than it was from 1990 to 2010.41 From 1990 to 2010, the number of Muslims in the region increased by 2.3 million. In the next two decades, the number of Muslims in the Americas is projected to increase by 5.6 million. Much of the projected increase will come from the large number of Muslim immigrants expected to come to the U.S. and Canada from South Asia, the Middle East and North Africa (see section on migration in the Americas).

md2-97

The rate of growth of the Muslim population in the Americas will continue to be substantially higher than the rate of growth of the non-Muslim population. But the growth of the Muslim population is expected to slow by 2030, as Muslim fertility rates gradually drop and as new immigrants make up a declining percentage of Muslims in the region.

Sub-Regions and Countries in the Americas

Sub-Regions in the Americas

Central and South America, including the Caribbean, are projected to have modest increases in the size of their Muslim populations in the next 20 years.42 Most of the projected growth in the Muslim population in the region will take place in North America, where the number of Muslims is projected to increase from about 3.5 million in 2010 to roughly 8.9 million in 2030. Muslims are expected to make up 2.2% of North America’s population in 2030, up from 1.0% in 2010.

md2-98

Countries in the Americas

The Muslim population in the United States is projected to more than double in the next 20 years, from nearly 2.6 million in 2010 to about 6.2 million in 2030, in large part because of immigration and higher-than-average fertility among Muslims.

Within two decades, the United States is expected to have the 43rd largest Muslim population in the world (in absolute numbers), up from 55th place in 2010. By 2030, the U.S. is projected to have a larger number of Muslims than any European country other than Russia (which is expected to have 19 million Muslims by 2030) and France (which is expected to have 6.9 million Muslims in 2030). By comparison, the United Kingdom and Germany are each projected to have nearly 5.6 million Muslims in 2030.

By 2030, Muslims are expected to account for 1.7% of the total U.S. population, up from 0.8% in 2010. If current trends continue, Muslims may constitute as large a share of the U.S. population as either Jews or Episcopalians do today.43 The Pew Forum’s U.S. Religious Landscape Survey, conducted in 2007, found that Jews represented 1.7% of the adult population in the U.S., while Episcopalians (including Anglicans) accounted for 1.4%.44

md2-99

The number of Muslims in Canada is expected to nearly triple in the next 20 years, from about 940,000 in 2010 to nearly 2.7 million in 2030. Muslims account for a larger share of the general population in Canada than they do in the United States. By 2030, 6.6% of Canada’s population is projected to be Muslim, up from 2.8% in 2010.

Within two decades, Canada is expected to have the second-largest number of Muslims in the Americas, overtaking Argentina, which is now in second place. The number of Muslims in Argentina is expected to rise from 1 million in 2010 to about 1.2 million in 2030. During the same period, Brazil’s Muslim population is projected to climb from about 204,000 to about 227,000, and Mexico’s Muslim population is expected to increase from about 111,000 to about 126,000.

Of all the countries in the Americas, Canada and the U.S. are expected to have by far the largest percentage increases in the size of their Muslim populations, 183.1% and 139.5%, respectively.

The countries in the region with the highest concentration of Muslims as a share of the total population in 2010 are Suriname (15.9%), Guyana (7.2%), and Trinidad and Tobago (5.8%). The Muslim population shares in these countries are not expected to change very much in the next 20 years. The countries expected to have the largest projected increase in the portion of the population that is Muslim are the U.S., Canada and Argentina.

Fertility

There are not enough data available to arrive at an overall fertility rate for Muslims in the Americas; differential fertility data for Muslims and non-Muslims are not available for most countries in the region. The two exceptions are the United States and Canada.

There is no direct measure of the total fertility rate for Muslims living in the U.S. However, Pew Forum staff were able to estimate a fertility rate using information on the two main subgroups of U.S. Muslims: foreign-born immigrants and Muslims born in the U.S. For the 64.5% of U.S. Muslims who were born in another country, Pew Forum staff used data from the New Immigrant Survey to estimate the proportion of Muslim immigrants from each of the major countries from which Muslim immigrants came.45 Using data from the American Community Survey, Pew Forum staff then estimated the fertility rate for women in the U.S. who were born in each of those countries.46 These rates were averaged together, giving greatest weight to the fertility rates for women in the U.S. who are from the countries with the largest proportion of Muslim immigrants. For instance, the overall average is impacted more by the Total Fertility Rate of 2.5 children for U.S. women born in Pakistan than by the rate of 1.8 children for U.S. women born in Iran; this is because there are more new Muslim immigrants from Pakistan than from Iran in the U.S. When averaged together, the estimated Total Fertility Rate for Muslim immigrants is 2.6 children per woman.

Of the 35.5% of U.S. Muslims who were born in the U.S., slightly more than half are African- Americans; most of the rest are second- or third-generation immigrants. Since comparative fertility data for Muslim and non-Muslim African-Americans are not available, Pew Forum staff used as a proxy the 2.2 children per woman Total Fertility Rate for blacks reported by the Division of Vital Statistics of the U.S. Centers for Disease Control and Prevention in 2006, the latest data available when the U.S. projection was made.47 Also, since Total Fertility Rates are not available for second- or third- generation immigrants, and since the fertility rates of subsequent generations generally tend to converge with the national average, this group was assumed to also have a Total Fertility Rate slightly above the national average of 2.1.

Finally, Pew Forum staff estimated the Total Fertility Rate for all U.S. Muslims by giving a weight of 64.5% to the Total Fertility Rate of 2.6 for Muslim immigrants and a weight of 35.5% to the fertility rate of 2.2 for Muslims born in the U.S., yielding an estimate of about 2.5 children per woman for all U.S. Muslims.

The fertility rate for Muslims in Canada is higher than the rate for other Canadians (an average of 2.4 children per woman for Muslims, compared with 1.6 children per woman for other populations in Canada).48

The best available data suggest that fertility rates among Muslim women in the Central and South American countries with the largest proportion of Muslims – Argentina, Guyana, Suriname, and Trinidad and Tobago – resemble those for the general population of those countries. This is because previous generations of Muslim immigrants tended to adopt their new country’s fertility patterns, and these countries have had far fewer Muslim immigrants in recent decades than the U.S. or Canada.

Sex Ratios

md2-100

The ratio of men to women also will have an impact on Muslim fertility rates in the Americas. As previously mentioned, when a population has more men than women, the number of births tends to be lower than if the population is more balanced.

The 2007 Pew Research Center survey of Muslims in the United States found that 54% of all adult Muslims in the U.S. are male, while 46% are female.49 This finding is consistent with U.S. Census data on immigrants from Muslim-majority nations. Males constitute a majority of the immigrants from several Muslim-majority nations that are the source of substantial numbers of people coming to the U.S., such as Pakistan, Bangladesh and Somalia. When children are taken into account, however, an estimated 51.4% of U.S. Muslims are male in 2010, which means that the number of Muslim men and women in the U.S. is expected to be fairly balanced in the coming years. This is another reason why the U.S. Muslim population is projected to continue to grow.

The male-to-female ratio of young Canadian Muslims (ages 0-24) is about the same as the ratio for the country as a whole. However, among those age 25 and older, the ratio of Muslim men to Muslim women is higher than that for the general population. This most likely indicates that more Muslim men than Muslim women have immigrated to Canada.

md2-102

Life Expectancy at Birth

Life expectancy data by religious affiliation is not available for countries in the Americas. The projections in this report assume that Muslims have the same life expectancy as the general population.

Migration

If economic opportunities in Central and South America remain limited, immigration is not expected to be a significant factor in the future growth of Muslim populations in most countries in this sub-region.

Muslim population growth will come largely from natural population increases among previous waves of immigrants. The earliest Muslims are thought to have emigrated to Central and South America from Spain, followed by slaves from sub-Saharan Africa and laborers from the Middle East and India. Today, for example, a majority of Muslim immigrants to Argentina are from Arabic-speaking countries in the Middle East.

md2-103

If economic opportunities in Central and South America remain limited, immigration is not expected to be a significant factor in the future growth of Muslim populations in most countries in this sub-region.

Muslim population growth will come largely from natural population increases among previous waves of immigrants. The earliest Muslims are thought to have emigrated to Central and South America from Spain, followed by slaves from sub-Saharan Africa and laborers from the Middle East and India. Today, for example, a majority of Muslim immigrants to Argentina are from Arabic-speaking countries in the Middle East.

An analysis of data from Statistics Canada suggests that immigration will be an important factor in the growth of Canada’s Muslim population over the next 20 years.50 Canada has experienced a rapid increase in its immigrant Muslim population in recent decades. Before 1961, only about 1,000 foreign-born Muslims lived in Canada. The number of immigrant Muslims grew to roughly 10,000 during the 1960s, to nearly 51,000 in the 1970s, to about 78,000 in the 1980s and to almost 276,000 in the 1990s.

Among Muslim-majority countries, Pakistan, Iran, Lebanon, Morocco, Afghanistan, Bangladesh, Algeria and Somalia have been the top countries of origin for immigrants to Canada in recent decades. With the exception of Lebanon and Somalia, the number of immigrants to Canada from these countries has steadily increased since the 1990s, according to an analysis of data from Statistics Canada; indications are that the numbers are continuing to increase. 51 For example, the number of Pakistanis who acquired citizenship in Canada rose from almost 15,000 in 1991-95 to about 41,000 from 1996-2001 and to nearly 58,000 from 2001-06.

Muslim Immigration to the United States

Muslim immigration to the United States has been steadily increasing since the 1990s, except for a slight dip following the 9/11 terrorist attacks in New York City in 2001. 52 In 1992, nearly 50,000 Muslim immigrants were granted permanent residency status in the United States. By 2009, the annual number had increased to more than 115,000.53 If current trends continue, about 130,000 Muslims are expected to be granted permanent residency in the United States annually by 2030.

This report’s projections for Muslim immigrants to the U.S. are based partly on data from the 2003 New Immigrant Survey. Pew Forum staff used these data to calculate the proportion of all immigrants who are Muslim for each country from which large numbers of Muslims recently have come to the U.S. (This proportion does not necessarily match the religious composition of the country of origin. For instance, while Pakistan is 96.4% Muslim today, 89.5% of immigrants from Pakistan are estimated to be Muslim.) The proportion of immigrants who are Muslim for each country was then applied to the actual number of immigrants receiving permanent residency from that country, as reported by the U.S. Department of Homeland Security from 1992 to 2009.

These calculations show that Muslim immigrants have been rising both in absolute numbers and as a share of all immigrants receiving permanent U.S. residency. As previously mentioned, the number of Muslims receiving permanent residency grew from just under 50,000 in 1992 to about 115,000 in 2009, while the share that Muslims represent of all new permanent residents rose from about 5.1% in 1992 to about 10.2% in 2009. At the same time, the total number of immigrants receiving permanent residency status has fluctuated from year to year but has increased, on average, by about 2% annually from 1992 to 2009.

md2-104

Based on these trends, the projections for 2020 and 2030 conservatively assume a rate of growth of about 1% per year in the total number of new permanent residents. The projections also assume a slow rise in the share of Muslims among new permanent residents. Specifically, the projections start with Muslims making up 9.4% of a total of 938,000 new permanent residents per year, or an estimated 88,000 people in 2010. By 2020, Muslims are projected to comprise 10.5% of more than 1 million new permanent U.S. residents per year, or about 109,000 people annually. By 2030, the projections show Muslim immigrants making up 11.4% of more than 1.1 million projected new permanent residents, or about 130,000 people per year. All these projections assume that the year-to-year fluctuations in immigration numbers are less important than the long-term trends.

md2-105

The top countries of origin for Muslim immigrants to the United States in 2009 were Pakistan and Bangladesh. They also are expected to be the top countries of origin for Muslim immigrants in 2030.

About two-thirds of the Muslims in the U.S. today (64.5%) are foreign-born, first-generation immigrants, while slightly more than a third (35.5%) were born in the United States.54 By 2030, however, more than four-in-ten of the Muslims in the U.S. (44.9%) are expected to be nativeborn.

md2-106

Age Structure

Information on the age structure of Muslim populations in the Americas is available only for the U.S. and Canada.

The Muslim population in the United States today is somewhat younger than the general population of the U.S., but it is expected to be significantly younger by 2030.55 Currently, about 36% of U.S. Muslims are under age 30, compared with about 41% of non-Muslims in the U.S. By 2030, however, about 53% of U.S. Muslims are expected to be under age 30, compared with roughly 39% of non-Muslims.

Children under age 15 make up a relatively small portion of the U.S. Muslim population today. Only 13.1% of Muslims are in the 0-14 age category. This reflects the fact that a large proportion of Muslims in the U.S. are newer immigrants who arrived as adults. But by 2030, many of these immigrants are expected to start families. The number of U.S. Muslims under age 15 is projected to more than triple, from fewer than 500,000 in 2010 to 1.8 million in 2030. The number of Muslim children ages 0-4 living in the U.S. is expected to increase from fewer than 200,000 in 2010 to more than 650,000 in 2030.

It is important to note that this report does not project a rise in the Total Fertility Rate among Muslim women in the U.S. Rather, the projections assume that the fertility rate among new Muslim immigrants will gradually converge with that of the general population. The large expected increase in the number of Muslim children ages 0-4 in the U.S. is the result not of a rise in the fertility rate, but instead a rise in the number of Muslim women in their prime childbearing years.

md2-107

A smaller portion of U.S. Muslims will be age 60 and older in 2030 (9.5%) than in 2010 (13.1%), as the Muslim population shifts from being largely comprised of immigrants to one that has a growing number of native-born Muslims.

The Muslim population in Canada is significantly younger than the non-Muslim population in Canada. According to the 2001 Canadian census, the median age for Muslims in Canada is 28, compared with 37 for the general population. 56 Nearly a third of Muslims in Canada (29.0%) are age 14 and younger, compared with 19.4% of non-Muslims.

Canada also has a relatively large number of Muslims in or about to enter their prime childbearing years. The 2001 census found that 16.3% of Canada’s Muslims are between ages 15 and 24, compared with 13.4% of non-Muslims. More than a third of Canada’s Muslims (34.9%) are ages 25-44; 30.5% of non-Muslims fall into this age group.


Footnotes

40 The size of the Muslim population in the U.S. has been a subject of considerable debate. According to the Pew Research Center’s May 2007 report Muslim Americans: Middle Class and Mostly Mainstream, there were a total of 2.35 million Muslims (adults and children) nationwide. For a discussion of the varying estimates of the size of the Muslim population in the U.S., see Chapter 1 of the Pew Research Center report. (return to text)

41 Muslim population growth in Europe is projected to be slightly greater on average in the next 10 years than it was in the previous 10 years, but the rate of growth is projected to decline from 2020-30. Over the 20-year period from 2010 to 2030, the growth of Europe’s Muslim population is projected to be slower than it was from 1990 to 2010. (return to text)

42 Central and South America includes 46 countries and territories: Anguilla, Antigua and Barbuda, Argentina, Aruba, Bahamas, Barbados, Belize, Bolivia, Brazil, British Virgin Islands, Cayman Islands, Chile, Colombia, Costa Rica, Cuba, Dominica, Dominican Republic, Ecuador, El Salvador, Falkland Islands (Malvinas), French Guiana, Grenada, Guadeloupe, Guatemala, Guyana, Haiti, Honduras, Jamaica, Martinique, Mexico, Montserrat, Netherlands Antilles, Nicaragua, Panama, Paraguay, Peru, Puerto Rico, St. Kitts and Nevis, St. Lucia, St. Vincent and the Grenadines, Suriname, Trinidad and Tobago, Turks and Caicos Islands, U.S. Virgin Islands, Uruguay and Venezuela. North America includes five countries: Bermuda, Canada, Greenland, St. Pierre and Miquelon, and United States. There are no Muslim-majority countries or territories in the Americas. (return to text)

43 Vegard Skirbekk, Eric Kaufmann and Anne Goujon found that Jews in the U.S., with an estimated total fertility rate of 1.4, will comprise a decreasing share of the U.S. population in each of the five projection models they analyzed. The fertility rate for Jews in the U.S. is lower than the rate for the general U.S. population, and Jewish immigration is projected to be negligible. See Vegard Skirbekk, Eric Kaufmann and Anne Goujon, “Secularism, Fundamentalism, or Catholicism? The Religious Composition of the United States to 2043,” Journal for the Scientific Study of Religion, Volume 49, Number 2, pages 293-310, 2010. (return to text)

44 See Pew Research Center’s Forum on Religion & Public Life, U.S. Religious Landscape Survey, 2008. (return to text)

45 The New Immigrant Survey (NIS) is a nationally representative study of new legal immigrants to the United States and their children. The first full wave of the NI S was conducted from June 2003 to June 2004 and involved 10,000 respondents. Interviews were conducted face-to-face and by telephone in the respondent’s preferred language. The NI S was designed by Guillermina Jasso, Douglas S. Massey, Mark R. Rosenzweig and James P. Smith and funded by the National Institutes of Health, National Science Foundation and the U.S. Citizenship and Immigration Services. Additional support was provided by the U.S. Department of Health and Human Services, Office of the Assistant Secretary for Planning and Evaluation, and The Pew Charitable Trusts. The Pew Forum had access to restricted-use data, which was retrieved in August 2007. For further information, see The New Immigrant Survey. (return to text)

46 The American Community Survey (ACS) is an annual survey conducted by the U.S. Census Bureau. It provides current demographic, social, economic and housing information about communities in the U.S. Pew Forum staff pooled 2004-2008 ACS data to make Total Fertility Rate calculations. The data sets were obtained from IPUMS-USA. (return to text)

47 The Division of Vital Statistics of the U.S. Centers for Disease Control and Prevention collects a variety of health and population statistics for the United States. (return to text)

48 Alain Bélanger, Editor-in-Chief, “Report on the Demographic Situation in Canada: 2003 and 2004,” Statistics Canada, Catalogue number 91-209-XIE , 2006. (return to text)

49 Estimating the proportion of male and female Muslims in the U.S. is more complicated than it may seem. Previous surveys of Muslim Americans – including the self-identified Muslims reached in the Pew Research Center’s nationwide surveys over the past decade – tended to complete more interviews with males than females. However, potential cultural factors – in particular, the possibility that some Muslims consider it inappropriate for Muslim women to be interviewed by a stranger, especially if the interviewer is male – make these unreliable as measures of the overall sex balance among U.S. Muslims. The May 2007 Pew Research Center survey, Muslim Americans: Middle Class and Mostly Mainstream, made an effort to avoid this problem by matching female interviewers with female respondents whenever possible. See Methodology section of that survey report for a more extensive discussion of this issue. (return to text)

50 See Statistics Canada Demosim Team, Éric Caron Malenfant, André Lebel and Laurent Martel, “Projections of the Diversity of the Canadian Population, 2006 to 2031,” Catalogue number 91-551-X, March 2010. (return to text)

51 Note that immigrants to Canada from these Muslim-majority countries are not necessarily all Muslim. These data come from a 2007 analysis by Statistics Canada of the place of birth of the immigrant population, which includes 2006 counts and percentage distribution for Canadian provinces and territories, using 20% sample data. See Statistics Canada, “Immigration and Citizenship Highlight Tables,” 2006 Census, Catalogue number 97-557-XWE 2006002, Dec. 4, 2007. (return to text)

52 This research uses data from the New Immigrant Survey (NIS), a nationally representative study of new legal immigrants to the United States and their children. (return to text)

53 This is the most recent year for which permanent residency data are available from the U.S. Department of Homeland Security. A permanent resident is also known as a green card holder. Permanent residency permits an individual to live and work in the United States on a permanent basis but does not allow him/her to vote in federal elections.(return to text)

54 These statistics differ slightly from the ones in the Pew Research Center’s May 2007 report, Muslim Americans: Middle Class and Mostly Mainstream, because they have been projected forward from 2006 to 2010. Because this study focuses on newer Muslim immigrants, groups such as Pakistani Muslims make up a larger share of Muslim immigrants in this study than they did in the 2007 report. (return to text)

55 The 2007 Pew Research Center survey of Muslim Americans found that the Muslim population in the United States is significantly younger than the general population, but it did not estimate the number of Muslims under age 18. See Chapter 1 of the Pew Research Center’s May 2007 report, Muslim Americans: Middle Class and Mostly Mainstream. (return to text)

56 The 2001 census also found that Muslims in Canada tended to be younger than members of other religious groups in the country. (return to text)


Sunni and Shia Muslims

Sunni Muslims and Shia Muslims comprise the two main sects within Islam. Because data on the percentages of Sunni and Shia Muslims are rough estimates in many countries, this study presents them as ranges. 57

Sunnis will continue to make up an overwhelming majority of Muslims in 2030. The number of Sunnis is projected to reach almost 2 billion by 2030 (between 1.91 billion and 1.97 billion), up from approximately 1.4 billion in 2010 (between 1.41 billion and 1.46 billion). Sunnis are expected to make up 87-90% of the world’s Muslims in 20 years, roughly the same percentage as today. The number of Shia Muslims is projected to be between 219 million and 285 million in 2030, up from between 162 million and 211 million in 2010. Shia Muslims are expected to make up 10-13% of the world’s Muslims, roughly the same percentage as today.

md2-108

Within these ranges, however, there may be a very slight increase in the percentage of Sunni Muslims and a very slight decline in the percentage of Shia Muslims, largely because of low fertility in Iran, where more than a third of the world’s Shia Muslims live. The annual rates of growth for the world’s Sunni and Shia populations were identical from 1990 to 2000. But the rate of growth of the Shia population is expected to be slightly lower than the rate of growth for Sunnis over the next 20 years.

Four countries in the world have a Shia-majority population – Iran (where ~93% of Muslims are Shia), Azerbaijan (~70%), Bahrain (~70%) and Iraq (~67%). Of these, Iran has the largest number of Shia Muslims. Iraq’s Shia Muslim population is substantially smaller, but it is expected to grow at a faster rate than the Shia population in neighboring Iran.

md2-109

The four countries with the largest Sunni-majority populations are Egypt (where ~99% of Muslims are Sunni), Indonesia (~99%), Bangladesh (~99%) and Pakistan (~87%). Of these, Pakistan is expected to have the greatest annual growth in its number of Sunni Muslims. Indonesia’s gains will be more modest.


Footnotes

57 For more information, see Methodology for Sunni-Shia estimates on page 38 of the Pew Forum’s 2009 report Mapping the Global Muslim Population. (return to text)


Muslim-Majority Countries

As of 2010, there are 49 countries in which Muslims comprise more than 50% of the population. A total of 1.2 billion Muslims live in these nations, representing 74% of the global Muslim population of 1.6 billion. By 2030, Nigeria is projected to become the 50th Muslim-majority country. In that year, according to the projections in this report, a total of 1.7 billion Muslims are expected to live in Muslim-majority nations, representing 78% of the world’s 2.2 billion Muslims. All Muslim-majority countries are in less-developed regions of the world with the exception of Albania and Kosovo, which are in Europe.

md2-110

More than a fifth of the world’s Muslims (23.3%) live in non-Muslim-majority, less-developed countries in 2010. These countries make up the rest of the “developing world”; they include all the non-Muslim-majority countries in sub-Saharan Africa, Asia-Pacific (excluding Australia, Japan and New Zealand), and Central and South America, including the Caribbean. These developing countries have a total of 376 million Muslim inhabitants in 2010. By 2030, they are projected to have 416 million Muslims, or 19% of all Muslims worldwide. The decline from 23% to 19% is due primarily to Nigeria (which accounts for about 5% of the world’s Muslims) becoming a Muslim-majority country by 2030. (For more information on Nigeria, see Spotlight on Nigeria.)

About 3% of the world’s Muslims live in non-Muslim-majority, more-developed countries in 2010. This category is often described as the “developed world”; it includes all countries in Europe (except Albania and Kosovo, which have Muslim majorities) and North America, plus Australia, New Zealand and Japan. These countries have a total of 42 million Muslims in 2010.

By 2030, they are projected to have 62 million Muslims, still about 3% of all Muslims worldwide.

This report uses the term Muslim-majority countries rather than Muslim countries because many of them have secular rather than religious governments.

The terms “less-developed” and “more-developed” in this report are based on United Nations categories. The U.N. describes regions as “less-developed” and “more-developed” according to factors such as life expectancy, education and income. These U.N. categories are used for statistical convenience and do not express a judgment about the political or social systems of particular countries or regions. As this report notes, there is great diversity among the countries in each category.

For a detailed look at each country and its projected population, please see the Sortable Data Tables.

About the Project

This report was produced by the Pew Research Center’s Forum on Religion & Public Life. The Pew Forum delivers timely, impartial information on issues at the intersection of religion and public affairs. The Pew Forum is a nonpartisan, nonadvocacy organization and does not take positions on policy debates. Based in Washington, D.C., the Pew Forum is a project of the Pew Research Center, which is funded by The Pew Charitable Trusts.

This report is part of the Pew-Templeton Global Religious Futures project, which is jointly and generously funded by The Pew Charitable Trusts and the John Templeton Foundation. The project analyzes religious change and its impact on societies around the world.

The report is a collaborative effort based on the input and analysis of the following individuals: Primary Researchers Brian J. Grim, Senior Researcher and Director of Cross-National Data, Pew Forum on Religion & Public Life Mehtab S. Karim, Visiting Senior Research Fellow, Pew Forum on Religion & Public Life Pew Forum Luis Lugo, Director

Research Alan Cooperman, Associate Director, Research Conrad Hackett, Demographer Phillip Connor, Research Associate Sahar Chaudhry, Research Analyst Mira Hidajat, Demography Consultant Becky Hsu, Project Consultant Andrew J. Gully, Noble Kuriakose, Elizabeth A. Lawton and Elizabeth Podrebarac, Research Assistants

Editorial Sandra Stencel, Associate Director, Editorial Anne Farris Rosen, Contributing Editor Diana Yoo, Graphic Designer Tracy Miller, Editor Hilary Ramp, Assistant Editor

Communications and Web Publishing Erin O’Connell, Associate Director, Communications Stacy Rosenberg, Digital Project Manager Mary Schultz, Communications Manager Liga Plaveniece, Communications Associate Joseph Liu, Web Associate Pew Research Center Andrew Kohut, President Paul Taylor, Executive Vice President Elizabeth Mueller Gross, Vice President Michael Piccorossi, Director of Digital Strategy and IT Russell Heimlich, Web Developer Brian Bailey, Web Producer

Appendix A: Methodology

This study uses the standard demographic method of making population projections. Called the cohort-component method, it takes the age and sex structure of a population into account when projecting the population forward in time. This has the advantage of recognizing that an initial, baseline population can be relatively “young,” with a high proportion of people in younger age groups (such as Nigeria) or relatively “old,” with a high proportion of older people (such as Japan). Cohorts are groups defined by age and sex, such as females ages 15-19 and males ages 15-19. Components are the three ways in which populations grow or shrink: new entrants via births, exits via deaths and net changes from migration. Each cohort of the population is projected into the future by adding likely gains – births and people moving into the country (immigrants) – and subtracting likely losses – deaths and people moving out (emigrants) – year-by-year. The very youngest cohorts, those ages 0-4, are created by applying age-specific birth rates to each female cohort in the childbearing years (ages 15-49).

The cohort-component method has been in existence for more a century. First suggested by the English economist Edwin Cannan in 1895, then further improved by demographers in the 1930s and ’40s, it has been widely adopted since World War II. It is used by the United Nations Population Division, the U.S. Census Bureau, other national statistical offices and numerous academic and research institutions.58

For countries in which Muslim populations are large enough that fertility rates and other demographic data are available specifically for the Muslim portion of the population, this study’s projections were made using the Demographic (DemProj) module of the Spectrum Policy Modeling System developed for the U.S. Agency for International Development (USAID), which is designed to integrate with data from the United Nations. However, projections for the United States and 25 European nations with significant Muslim populations were made by the Age and Cohort Change project of the International Institute for Applied Systems Analysis (IIASA) following the same basic methodology but using IIASA’s own software. IIASA, an independent research center supported by more than 15 countries and based in Laxenburg, Austria, is a recognized leader in population projections and is collaborating with the Pew Forum on demographic analysis of major religious groups around the world.  59

For many countries with very small Muslim populations, data on the differences in fertility, mortality and migration rates between Muslims and non-Muslims are not available. In such cases, the percentage that Muslims comprise of the baseline (2010) population is carried forward to future years and applied to the country’s expected total population, which is projected using the cohort-component method. This assumes that the Muslim population in such countries is growing at the same rate as the country’s overall population. Additionally, for a few countries, this report uses cohort-component projections made by demographic consultants for this project or independent estimates by national statistical agencies.

The projections of the Muslim population for 2010, 2020 and 2030 are based on assumptions about patterns in births, deaths, migration and age structures – the main factors driving population change – which are detailed below. There may, however, be political, environmental or social events that affect fertility, mortality, migration and age structures but that are not captured in these projections.

This study also considered conversion to or from Islam. Because recent survey data do not indicate that conversion is having any clear impact on the size of Muslim populations, the report assumes that future conversions into Islam will roughly equal conversions away from Islam, either to other faiths or to no particular faith. (See discussion in the Conversion section.)

Data

The Pew Forum’s population projections take into account several types of data. In some cases, statistics are available specifically for Muslim populations. In other cases, however, they are available only for the general population. Since many countries are conducting national censuses in 2010-11, more data is likely to emerge over the next few years, but a cut-off must be made at some point; this report is based on information available as of mid-2010.

Baseline Muslim Populations

To provide a current population baseline, the Pew Forum and its consultants used the best available sources to estimate the percentage of Muslims as a portion of each country’s population in 2010. In some cases, the best source is a census from several years ago, such as 2001 or 2005. However, this study does not simply carry the percentage of Muslims in 2001 or 2005 forward to 2010. Wherever sufficient data on the fertility and migration of Muslims populations in a particular country are available, they are used to project the earlier population figure to reach a 2010 estimate. This results in substantial differences, for some countries, between the 2010 Muslim population estimates contained in this report and the 2009 estimates published by the Pew Forum in its report Mapping the Global Muslim Population. (See the section below on “Differences Between this Report and the Pew Forum’s 2009 Report.”)

Fertility

The standard measure of fertility in this report is the Total Fertility Rate (TFR), defined as the total number of children an average woman would have in her lifetime if fertility patterns did not change. More specifically, the TFR is calculated by adding up all the age-specific fertility rates for women in a particular country (or region) during a given year (or other time period). This study includes estimates of TFRs for Muslim women in all countries in which Muslims make up a substantial portion of the population. For countries in which fertility rates for various religious groups are not available, this study assumes that the TFR of Muslims is the same as the TFR in the general population. This applies to some countries in which Muslims are an overwhelming majority (constituting approximately 90% or more of the country’s population), such as Afghanistan and Morocco.

Fortunately, fertility rates specifically for Muslims (or for ethnic groups that are predominantly Muslim) are available in many countries where sizeable numbers of Muslims live as minorities, including India, Nigeria, Ethiopia, Russia, Tanzania and many countries in Europe and North America. In such cases, the study has used those differential rates for projection purposes.

In countries where Muslims are a minority, the Muslim TFR, in most instances, tends to be slightly higher than the rate among the general population. In addition, fertility rates of Muslims tend to be higher than average in countries where they are recent immigrants (though the Muslim TFRs are projected gradually to converge to the national level in those countries). Therefore, this study’s estimates of the Muslim population in countries that have small Muslim populations, and for which differential data are not available, are believed to be conservative.

Age and Sex Structure

In countries for which demographic data specifically on Muslims are available, the age and sex structure of Muslim populations are incorporated into the projection models. In countries for which differential age and sex data for Muslims are not available (usually countries in which Muslims make up a very small portion of the overall population), Muslims are assumed to have demographic characteristics similar to the country’s general population.

Life Expectancy at Birth

The study’s projections use United Nations assumptions about life expectancy gains. The study assumes that life expectancy at birth will improve somewhat for all populations by 2030 and that the greatest gains will be made in less-developed countries (where the majority of Muslims live). The study also assumes that in countries where Muslims live as a minority, life expectancy at birth for Muslims is similar to the life expectancy of the general population and is reflective of national standards of living. In addition, data on differences in life expectancy at birth among members of various religious groups within a country generally are not available.

Migration: Important Primarily in Europe and North America

Immigration is a key driver of Muslim population growth in Europe and North America. Muslim immigration to countries in more-developed parts of the world has risen steadily for decades as a result of evolving labor markets, changes in immigration laws, growing connections of immigrant families to communities abroad and increased globalization.

Projections for future immigration of Muslims to Europe were made in collaboration with IIASA, primarily using immigration data provided by Eurostat. 60 Muslim immigration has been an ongoing phenomenon for decades in a number of European countries. This study assumes that the annual flow of Muslim immigrants to European countries will decline in absolute numbers in the years ahead.

In North America, however, the number of new Muslim immigrants has risen steadily in recent years, even after accounting for a slight dip in immigration among Muslims and non-Muslims following the 9/11 terrorist attacks. As a result, the projections for the U.S. assume that overall annual immigration will increase slowly, by about 1% per year. Based on recent trends that show more Muslims are leaving Muslim-majority countries and immigrating to the U.S., this study assumes that Muslims will comprise a slightly larger share of all immigrants to the U.S. each year.

This study’s projections count only immigrants to the U.S. who receive permanent legal residency and do not include visiting family members, students or others who are in the U.S. temporarily or illegally. Therefore, the report’s projections on the number of Muslim immigrants can be considered conservative.61

Patterns of immigration to the U.S. have varied from year to year, including a spike in 1998- 2001, a sharp decline in 2002-2004 and a return to average increases in the last several years.62 Despite these ups and downs, there has been relatively steady growth in the last 70 years, contrasting with substantial long-term fluctuations that occurred in the 19th and early 20th centuries. While short-term fluctuations seem likely to continue to occur, the projections assume that those variations will be less important than the long-term trends.

The issue of illegal immigration to the U.S. has become highly contentious in recent years. However, there is no evidence that illegal immigration is a significant factor in Muslim population growth in the U.S., partly because the overwhelming majority of Muslim immigrants enter through airports rather than at land crossings, which are more difficult than airports to monitor.

Projection Assumptions

This study made three alternative population projections – a high, medium and low estimate – for Muslims in each country. The country estimates were then added together to produce high, medium and low projections for the entire world. The three estimates are based on different assumptions about fertility, life expectancy at birth and migration of both Muslims and non- Muslims (where differential data are available). The main body of this report provides figures from the medium scenario for 2020 and 2030 because it is considered to be the most likely indicator of future population growth.

Fertility Assumptions

The assumptions about future changes in fertility used in this study largely follow those of the United Nations.

md2-111

The medium fertility scenario assumes that the Muslim Total Fertility Rate in every country will eventually settle in a range of approximately 1.9 to 2.1 children per woman. Some countries are already in this range, and others are projected to reach this range by 2030-35. Accordingly, if a country has already dipped below 1.9, as Iran has, the medium projection assumes that it will eventually stabilize around 1.9.

The low fertility scenario assumes 0.5 fewer children per woman in 2020-25 and 2030-35 than the fertility rate in the medium scenario.

The high fertility scenario assumes 0.5 more children per woman in 2020-25 and 2030-35 than the fertility rate in the medium scenario.

Projections for countries with Muslim-specific fertility data, including the United States and many European nations, used similar fertility assumptions

Mortality Assumptions

Based on United Nations estimates, this study projects that life expectancy at birth will gradually increase in all countries. There is no high, medium or low assumption because each country, whatever its current economic condition, is assumed to be moving toward better living standards and, therefore, longer life expectancy at birth.

Migration Assumptions

Based on United Nations estimates, this study assumes that in most countries the gap between the number of emigrants and the number of immigrants gradually will narrow. In Europe, for example, Muslim immigrant flows are projected to remain steady or decrease slightly. Based on historical patterns in U.S. immigration, however, the study assumes that the most likely scenario is a modest increase in the flow of Muslim immigrants to the United States over the next 20 years.

md2-112

The Projected Global Muslim Population Scenarios

Unlike the projected number of Muslims, the proportion or percentage of Muslims comprising the world population is similar in all three growth scenarios. For example, the low scenario projects that Muslims will make up 26.29% of the world’s population by 2030. The medium scenario projects 26.36% and the high scenario projects 26.43%.

Some regions also show little difference between the high, medium and low scenarios. For example, the low scenario projects that Muslims will make up 7.9% of the European population in 2030. The medium scenario is 8.0% and the high estimate is 8.1%. Even if Russia – which has the largest number of Muslims of any country in Europe but whose landmass extends into Asia – is not included in the European estimates, the overall difference (in percentage terms) between the high and low scenarios is just 0.2 points.

While the three scenarios produce essentially the same projections at the global and regional level, there may be more noticeable differences at the country level, especially in countries with a large influx of Muslim immigrants, such as the U.S. The low scenario projects that Muslims will make up 1.54% of the U.S. population in 2030. The medium projection is 1.68% and the high projection is 1.89%. As in all cases throughout this study, the medium scenario is used as the best indicator of the future.

md2-113

md2-114

Definition of Muslims

This report seeks to provide the most up-to-date and comprehensive demographic estimates of the number of Muslims in the 232 countries and territories for which the United Nations Population Division provides general population estimates. In order to have statistics that are comparable across countries, wherever possible this study counts all groups and individuals who self-identify as Muslim. This includes members of the Sunni and Shia sects as well as Sufi orders and various smaller groups, such as the Ahmadiyya movement and the Nation of Islam, that may be considered heterodox by some Muslim authorities. It also includes Muslims who may be secular or nonobservant.

Differences Between This Report and the Pew Forum’s 2009 Report

This report builds on the findings from the Pew Forum’s 2009 report Mapping the Global Muslim Population, which acquired and analyzed about 1,500 sources of data – including census reports, large-scale demographic studies and general population surveys – to estimate the number of Muslims in every country. Some of those estimates have been revised to take into account new sources of data, such as the 2008 Nigerian Demographic and Health Survey, which were not available when the 2009 report was compiled.

In addition, this report improves on the methodology used to generate some of the 2009 estimates from older census and survey data. For the 2009 report, the number of Muslims in each country was calculated by multiplying the U.N.’s 2009 total population estimate for that country by the single most-recent and most-reliable estimate of the percentage of Muslims in the country’s population, based on the conservative assumption that Muslim populations are growing at least as fast as the general population in each country. In contrast, this new report uses estimates of the differential growth rates of Muslim populations in many countries where Muslims are a substantial minority, including India, China, Nigeria, United States, Canada and numerous European nations. For instance, the United Kingdom’s 2001 census found that 2.7% of the U.K.’s total population was Muslim, and that percentage was reflected in the Pew Forum’s 2009 report. This study, however, takes into account higher-than-average fertility among Muslims in the U.K. as well as additional Muslim immigration. Using the cohortcomponent method, it projects the U.K.’s 2001 Muslim population forward to 2010, which results in a revised estimate that Muslims comprise 4.6% of the country’s current population.

Historical Data

To illustrate trends, this report and its accompanying interactive maps (online) provide estimates for 1990 and 2000 based on national censuses, demographic and health surveys, and general population surveys and studies available for those years. These data points have not been altered retrospectively; no attempt has been made to correct or revise the historical figures in light of more recent data. However, Pew Forum staff did attempt to identify past overcounts or undercounts of Muslims. This evaluation involved two steps. First, any country or territory whose Muslim population size, as ranked in world order in 2010, was 15 or more places higher or lower than its world ranking in 1990 or 2000 was marked for further analysis. Staff then assessed whether the change was likely attributable to inconsistencies in the data sources rather than to an actual change in the size of the Muslim population. For instance, a 1988 report published by the Population Reference Bureau was used for the 1990 Muslim population of France. That report, based on an analysis of the few sources available at the time, estimated that there were slightly more than half a million Muslims living in France. In contrast, the 2010 estimate of 4.7 million Muslims in France – more than an eight-fold increase over the 1990 figure – is based on an analysis of a 2008 nationally representative survey of the French population. Given the limitations of the source used for 1990, compared with the strengths of the 2010 source, it seems more likely that the 1990 figure was an undercount than that the Muslim population of France grew eight-fold in 20 years.

All together, the sources for 1990 appear to have substantially understated the actual number of Muslims in Angola, Cyprus, France, Gabon, Mozambique and Ukraine, while substantially overstating the number in Colombia, Georgia, Mongolia, Panama, Taiwan and Vietnam. The 2000 estimates appear to have undercounted Muslims in Cyprus, France, Guatemala, Hungary, Slovakia and Vietnam, while overcounting the number in Laos, Lesotho and Taiwan. These likely undercounts and overcounts should be taken into consideration when looking at growth rates, particularly in the affected countries. The number of Muslims in Vietnam, for example, may not have dropped from 1990 to 2000 and then climbed rapidly from 2000 to 2010; rather, the 1990 figure was probably too high an estimate, and the 2000 figure may have been too low.

Discussion of Sources

Sources for this report include United Nations data, national censuses, demographic and health surveys, and general population surveys and studies. The specific source used for the Muslim population in each country is listed in Appendix B: Data Sources by Country. Readers should note, however, that general population surveys typically have smaller sample sizes than demographic surveys and are not designed to measure the size of small minority populations. This may lead to undercounts of Muslims in countries where they represent a small minority of the population and to overcounts where they represent the vast majority of the population. See below for more detail.63

With all sources, results may be affected by methodological decisions with respect to how the data are collected and managed. Social, cultural or political factors can also affect how answers to census and survey questions are provided and recorded.

United Nations and Other International Research Agencies

Data on fertility rate, age structure, life expectancy, migration and related factors come mainly from the United Nations Population Division. Differential demographic data on Muslims is taken from censuses, demographic and health surveys, and national statistical offices. Specific data sources are identified in each chart and table throughout the report.

Censuses

For this study, Pew Forum researchers acquired and analyzed religious affiliation data from 81 censuses that were conducted since 1999, comparing more current sources of data with older census data on religious affiliation for an additional 103 countries as a cross-check. Religious affiliation questions from national censuses are the best source for estimating the number of Muslims because they generally cover the entire population and are conducted on a fairly regular basis. The chief limitation in using census data is that fewer than half of recent country censuses include a religious affiliation question. In addition, censuses typically are conducted only once every 10 years.

Demographic Surveys

Where recent census data on religion are not available, religious affiliation questions from large-scale demographic surveys, such as Macro International’s MEASURE Demographic and Health Surveys, are the second-best source because of their large sample sizes, sampling frame and representative results at the province level. Though many fewer people are interviewed in a demographic survey than in a census, demographic surveys complete sufficiently high numbers of interviews to produce a generally accurate demographic profile of the country. The chief limitation of demographic surveys, for purposes of this report, is that they assume that children in a household or older members of a household have the same religion as the people interviewed, who are women and men in their reproductive years (ages 15-49 for women and ages 15-54 for men).

For this report, DHS data were acquired and analyzed for more than 60 countries, or nearly two-thirds of the countries where census data are lacking or are older than 1999. For most of the DHS surveys, both women and men are interviewed and Macro International provides the data in separate male-female data sets. Pew Forum staff pooled the female and male data sets in consultation with sampling experts at Macro International so that the combined data set retains nationally representative results. In countries where only females are interviewed, Pew Forum staff used those data to make the overall Muslim population estimate for the country.

General Population Surveys

Pew Forum researchers acquired and analyzed religious affiliation data from general population surveys for about 100 countries. In more than 20 of these countries, these surveys provide religious affiliation data where a recent census or demographic survey is lacking. Since general population surveys typically involve only 1,000 to 2,000 respondents, however, they provide less accurate numbers. This is especially true where the size of the Muslim population is quite small or Muslims live in concentrated locations that are not oversampled.

World Religion Database

Pew Forum researchers also used estimates from the World Religion Database (WRD), primarily for countries in which census and survey estimates are out of date, unavailable or lack sufficient coverage. Besides census and survey reports, WRD estimates also take into account other sources of information on religious affiliation, including anthropological and ethnographic studies as well as reputable statistical reports from religious groups themselves. The WRD is an outgrowth of the international religious demography project at Boston University’s Institute on Culture, Religion and World Affairs.

A Note on Country and Territory Designation

This report provides population estimates for 232 countries and territories. The word “territories” is used as a general term for geographical entities that are not recognized as countries by the United Nations but that have separate population estimates reported by the U.N. Population Division. Territories in this report include entities such as Hong Kong and Macau (special administrative regions of China), Greenland (an autonomous constituent country within the Kingdom of Denmark) and the Commonwealth of Puerto Rico (an unincorporated territory of the United States). For convenience, “countries” is often used in charts, tables and the text of the report as an umbrella term for countries and territories.


Footnotes

58 For a detailed explanation of the cohort-component method as well as a discussion of the accuracy of population projections, see Brian O’Neill and Deborah Balk, “World Population Futures,” Population Reference Bureau, September 2001. (return to text)

59 Forthcoming global projections by the Pew Forum and IIASA will use multistate projection modeling, which goes beyond traditional cohort-component analysis by building projection scenarios that take into account not just fertility, mortality and migration but also other predictors of demographic change – that is, other demographic “states” – such as education levels. Multistate projection modeling was developed at IIASA by the American geographer Andrei Rogers in the 1970s. (return to text)

60 Eurostat is the statistical office of the European Union, situated in Luxembourg. Its task is to provide the European Union with statistics that enable comparisons among countries and regions in Europe. (return to text)

61 Data are not available on the number of permanent residents who move out of the U.S. each year, including the number of Muslim permanent residents who leave. These losses may be partially offset by counting only legal, permanent residents as immigrants. (return to text)

62 See Jeffrey S. Passel and Roberto Suro, Rise, Peak and Decline: Trends in U.S. Immigration 1992–2004, Pew Hispanic Center, September 2005. (return to text)

63 Additional discussion and evaluation of these sources can be found in Brian J. Grim and Becky Hsu, “Estimating the Global Muslim Population: Size and Distribution of the World’s Muslim Population,” Interdisciplinary Journal of Research on Religion, Volume 7, Article 2, 2011. (return to text)


Appendix B: Data Sources by Country

The below list of general sources provides bibliographic information for sources that were used to provide estimates and projections for the Muslim populations of multiple countries. The subsequent list of sources by country provides abbreviated bibliographic information identifying which general sources were used as the basis for estimates and projections for countries, as well as fuller bibliographic information for sources that were used for one country only. All estimates and projections were made by The Pew Research Center’s Forum on Religion & Public Life unless otherwise noted.

General Sources

Demographic and Health Surveys. MEASURE DHS. Calverton, Maryland: Administered by Macro International, 1995-2007. http://www.measuredhs.com/

European Social Survey. London: Led by Centre for Comparative Social Surveys, City University, 2004, 2006. http://www.europeansocialsurvey.org/

Pew Research Center’s Global Attitudes Project 2009 Survey http://pewresearch.org/pewresearch-org/global/datasets/

Pew Research Center’s Global Attitudes Project 2007 Survey http://pewresearch.org/pewresearch-org/global/datasets/

Pew Research Center’s Global Attitudes Project 2002 Survey http://pewresearch.org/pewresearch-org/global/datasets/

Population Reference Bureau. John R. Weeks “The Demography of Islamic Nations,” Population Bulletin, Vol. 43, No. 4. Washington, D.C.: Population Reference Bureau, Inc., December 1988.

United Nations Demographic Yearbook. “Special Census Topics Volume 2 – Social characteristics, ‘Table 6: Population by religion, sex, urban/rural residence and percentage: each census, 1985-2004.’ ” New York: United Nations Statistics Division, 2006. http://unstats.un.org/unsd/demographic/sconcerns/popchar/popchar2.htm

United Nations. “UNdata.” UNdata is an internet-based data service that makes U.N. statistical databases available through a single entry point. http://data.un.org/

World Population Prospects: The 2008 Revision. United Nations Population Division, 2009. http://esa.un.org/UNPP/

World Religion Database: International Religious Demographic Statistics and Sources. Todd M. Johnson and Brian J. Grim, eds. Leiden, Netherlands and Boston, Mass.: Brill, 2010. http://www.worldreligiondatabase.org

World Values Survey (WVS). “Values Survey Database.” World Values Survey Association, 1999-2006. http://www.worldvaluessurvey.org/

Sources by Country

Afghanistan: 1990 estimate based on 1979 Census; 2000 estimate based on World Religion Database; 2010, 2020 and 2030 projections based on 2010 World Religion Database

Albania: 1990 estimate based on 1988 Population Reference Bureau; 2000 estimate based on 1998 World Values Survey; 2010, 2020 and 2030 projections carried out by the International Institute for Applied Systems Analysis based on the 2005 Multiple Indicator Cluster Survey, Round 3 and the 2002 Albania Reproductive Health Survey

Algeria: 1990 and 2000 estimates based on World Religion Database; 2010, 2020 and 2030 projections based on 2010 World Religion Database

American Samoa: 1990 and 2000 estimates based on World Religion Database; 2010, 2020 and 2030 projections based on 2010 World Religion Database

Andorra: 1990 and 2000 estimates based on World Religion Database; 2010, 2020 and 2030 projections based on 2005 World Values Survey

Angola: 1990 and 2000 estimates based on World Religion Database; 2010, 2020 and 2030 projections based on Pew Research Center’s Global Attitudes Project 2002 Survey

Anguilla: 1990 estimate based on World Religion Database; 2000 estimate based on 2001 Census; 2010, 2020 and 2030 projections based on 2001 Census

Antigua and Barbuda: 1990 and 2000 estimates based on World Religion Database; 2010, 2020 and 2030 projections based on 2010 World Religion Database

Argentina: 1990 and 2000 estimates based on World Religion Database; 2010, 2020 and 2030 projections based on 2009 estimate by consultant Khaleel Mohammed (see Appendix C: Advisers and Consultants).

Armenia: 1990 estimate based on World Religion Database; 2000 estimate based on 2000 Demographic and Health Survey; 2010, 2020 and 2030 projections based on 2000 Demographic and Health Survey

Aruba: 1990 and 2000 estimates based on World Religion Database; 2010, 2020 and 2030 projections based on 2010 World Religion Database

Australia: 1990 estimate based on 1991 Census; 2000 estimate based on 2001 Census; 2010, 2020 and 2030 projections based on an analysis of the 2006 Census carried out by consultant Farhat Yusuf (see Appendix C: Advisers and Consultants).

Austria: 1990 estimate based on 1991 Census; 2000 estimate based on 2001 Census; 2010, 2020 and 2030 projections carried out by the International Institute for Applied Systems Analysis based on the 2001 Census

Azerbaijan: 1990 estimate based on World Religion Database; 2000 estimate based on 1997 World Values Survey; 2010, 2020 and 2030 projections based on 2006 Demographic and Health Survey

Bahamas: 1990 estimate based on World Religion Database; 2000 estimate based on 2000 Census; 2010, 2020 and 2030 projections based on 2000 Census. Census data obtained from personal email correspondence with United Nations Statistics Division.

Bahrain: 1990 estimate based on 1991 Census; 2000 estimate based on 2001 Census; 2010, 2020 and 2030 projections based on 2001 Census. Obtained from “Part 2, ‘Table – 0603.0: POPULATION BY RELIGION, AGE GROUPS, NATIONALITY AND SEX – 2001.’” Bahrain Census 2001. Bahrain: Directorate of Statistics in Central Informatics Organization, 2001. http://www.cio.gov.bh/CIO_ENG/sitemap.aspx

Bangladesh: 1990 estimate based on 1991 Census; 2000 estimate based on 2001 Census; 2010, 2020 and 2030 projections based on an analysis of the 2001 Census carried out by consultants Khan Mohammad Mohsin, e-Khuda and and Narul Alam (see Appendix C: Advisers and Consultants).

Barbados: 1990 estimate based on 1990 Census; 2000 estimate based on World Religion Database; 2010, 2020 and 2030 estimate based on 2010 World Religion Database

Belarus: 1990 estimate based on 1996 World Values Survey; 2000 estimate based on 2000 World Values Survey; 2010, 2020 and 2030 projections based on 2000 World Values Survey

Belgium: 1990 estimate based on World Religion Database; 2000 estimate based on 2004 European Social Survey; 2010, 2020 and 2030 projections carried out by the International Institute for Applied Systems Analysis based on 2001 Census

Belize: 1990 estimate based on 1991 Census; 2000 estimate based on 2000 Census; 2010, 2020 and 2030 projections based on 2000 Census. Obtained from United Nations Demographic Yearbook.

Benin: 1990 estimate based on 1992 Census; 2000 estimate based on 2001 Demographic and Health Survey; 2020, 2020 and 2030 projections based on 2002 Census and 2006 Demographic and Health Survey. Census data obtained from “ ‘Table: Ethnie et Religion,’ Principaux Indicateurs Socio-Demographiques,” Troisieme Recensement General de la Population et de l’Habitation, Febrier 2002. Institut National de la Statistique et de L’Analyse Economique, 2003. http:// www.insae-bj.org/IMG/pdf/principaux_indicateur_rgph3.pdf  (PDF) and http://www. insae-bj.org/?Religion

Bermuda: 1990 estimate based on 1991 Census; 2000 estimate based on 2001 Census; 2010, 2020 and 2030 projections based on 2001 Census. Obtained from United Nations Demographic Yearbook.

Bhutan: 1990 and 2000 estimates based on World Religion Database; 2010, 2020 and 2030 projections based on 2010 World Religion Database

Bolivia: 1990 and 2000 estimates based on World Religion Database; 2010, 2020 and 2030 projections based on 2010 World Religion Database

Bosnia-Herzegovina: 1990 estimate based on 1991 Country Census; 2000 estimate based on 2001 World Values Survey; 2010, 2020 and 2030 projections carried out by the International Institute for Applied Systems Analysis based on the 2001 World Values Survey and the 2002 World Bank Living In Bosnia and Herzegovina Survey

Botswana: 1990 estimate based on World Religion Database; 2000 estimate based on 2001 Census; 2010, 2020 and 2030 projections based on 2001 Census. Census data obtained from Ntloedibe-Kuswani, G.S. “AFRICAN RELIGIONS AND 2001 POPULATION AND HOUSING CENSUS IN BOTSWANA.” Centre for Continuing Education, University of Botswana, 2003. http://www.cso.gov.bw/images/stories/Census/paper24.pdf (PDF)

Brazil: 1990 and 2000 estimates based on World Religion Database; 2010, 2020 and 2030 projections based on 2010 World Religion Database

British Virgin Islands: 1990 and 2000 estimates based on World Religion Database; 2010, 2020 and 2030 projections based on 2010 World Religion Database

Brunei: 1990 estimate based on 1991 Census; 2000 estimate based on 1991 Census; 2010, 2020 and 2030 projections based on 2001 Census

Bulgaria: 1990 estimate based on 1992 Census; 2000 estimate based on 2001 Census; 2010, 2020 and 2030 projections carried out by the International Institute for Applied Systems Analysis based on the 2001 Census

Burkina Faso: 1990 estimate based on 1992 Demographic and Health Survey; 2000 estimate based on 1998 Demographic and Health Survey; 2010, 2020 and 2030 projections based on 2003 Demographic and Health Survey

Burma (Myanmar): 1990 estimate based on 1990 Census; 2000 estimate based on World Religion Database; 2010, 2020 and 2030 projections based on 2010 World Religion Database

Burundi: 1990 estimate based on 1990 Census; 2000 estimate based on 2007 InterMedia Survey; 2010, 2020 and 2030 projections based on 2007 InterMedia Survey. Washington, D.C.: InterMedia. Prepared for Pew Research Center’s Forum on Religion & Public Life in 2009.http://www.intermedia.org/

Cambodia: 1990 estimate based on 1988 Population Reference Bureau; 2000 estimate based on 1998 Census; 2010, 2020 and 2030 projections based on 2005 Demographic and Health Survey

Cameroon: 1990 estimate based on 1991 Demographic and Health Survey; 2000 estimate based on 1998 Demographic and Health Survey; 2010, 2020 and 2030 projections based on 2004 Demographic and Health Survey

Canada: 1990 estimate based on 1991 Census; 2000 estimate based on 2001 Census; 2010, 2020 and 2030 projections based on 2001 Census and Statistics Canada’s 2010 study, “Projections of the Diversity of the Canadian Population”

Cape Verde: 1990 estimate based on World Religion Database; 2000 estimate based on 2005 Afrobarometer Survey; 2010, 2020 and 2030 projections based on 2008 Afrobarometer Survey

Cayman Islands: 1990 and 2000 estimates based on World Religion Database; 2010, 2020 and 2030 projections based on 2010 World Religion Database

Central African Republic: 1990 estimate based on 1988 Population Reference Bureau; 2000 estimate based on 1995 Demographic and Health Survey; 2010, 2020 and 2030 projections based on 1995 Demographic and Health Survey

Chad: 1990 estimate based on 1993 Census; 2000 estimate based on 1996-1997 Demographic and Health Survey; 2010, 2020 and 2030 projections based on 2004 Demographic and Health Survey

Channel Islands: 1990 and 2000 estimates based on World Religion Database; 2010, 2020 and 2030 projections based on 2010 World Religion Database

Chile: 1990 estimate based on 1992 Census; 2000 estimate based on 2002 Census; 2010, 2020 and 2030 projections based on 2002 Census. Obtained from personal email correspondence with United Nations Statistics Division.

China: 1990 estimate based on 1988 Population Reference Bureau; 2000 estimate based on 2000 Census; 2010, 2020 and 2030 projections based on ethnicity data in 2000 Census. Census data obtained from The Tabulation on Nationalities of 2000 Population Census of China. China: Nationalities Publishing House, 2003.

Colombia: 1990 and 2000 estimates based on World Religion Database; 2010, 2020 and 2030 projections based on 2005 World Values Survey

Comoros: 1990 and 2000 estimates based on World Religion Database; 2010, 2020 and 2030 projections based on 2010 World Religion Database

Congo: 1990 and 2000 estimates based on World Religion Database; 2010, 2020 and 2030 projections based on 2007 Demographic and Health Survey

Cook Islands: 1990 and 2000 estimates based on World Religion Database; 2010, 2020 and 2030 projections based on 2001 Census. Census data obtained from United Nations Demographic Yearbook.

Costa Rica: 1990 and 2000 estimates based on World Religion Database; 2010, 2020 and 2030 projections based on 2007 Latinobarometro. Chile: Latinobarometro Corporation. Obtained by Pew Research Center’s Forum on Religion & Public Life in 2009.http://www.latinobarometro.org/

Croatia: 1990 estimate based on 1991 Census; 2000 estimate based on 2001 Census; 2010, 2020 and 2030 projections based on 2001 Census

Cuba: 1990 and 2000 estimates based on World Religion Database; 2010, 2020 and 2030 projections based on 2010 World Religion Database

Cyprus: 1990 and 2000 estimates based on World Religion Database; 2010, 2020 and 2030 projections based on 2005 World Religion Database and 2001 Census. Obtained from United Nations Demographic Yearbook.

Czech Republic: 1990 estimate based on 1991 Census; 2000 estimate based on 2001 Census; 2010, 2020 and 2030 projections based on 2001 Census. Obtained from United Nations Demographic Yearbook.

Denmark: 1990 and 2000 estimates based on World Religion Database; 2010, 2020 and 2030 projections carried out by the International Institute for Applied Systems Analysis based on 2009 data from Statistics Denmark

Djibouti: 1990 estimate based on 1988 Population Reference Bureau; 2000 estimate based on World Religion Database; 2010, 2020 and 2030 projections based on 2010 World Religion Database

Dominica: 1990 and 2000 estimates based on World Religion Database; 2010, 2020 and 2030 projections based on 2010 World Religion Database

Dominican Republic: 1990 and 2000 estimates based on World Religion Database; 2010, 2020 and 2030 projections based on 2010 World Religion Database

Ecuador: 1990 and 2000 estimates based on World Religion Database; 2010, 2020 and 2030 projections based on 2010 World Religion Database

Egypt: 1990 estimate based on 1988 Demographic and Health Survey; 2000 estimate based on 1996 Census; 2010, 2020 and 2030 projections based on 2005 Demographic and Health Survey

El Salvador: 1990 and 2000 estimates based on World Religion Database; 2010, 2020 and 2030 projections based on 2010 World Religion Database

Equatorial Guinea: 1990 and 2000 estimates based on World Religion Database; 2010, 2020 and 2030 projections based on 2010 World Religion Database

Eritrea: 1990 estimate based on 1995 Demographic and Health Survey; 2000 estimate based on 2002 Demographic and Health Survey; 2010, 2020 and 2030 projections based on 2002 Demographic and Health Survey

Estonia: 1990 estimate based on World Religion Database; 2000 estimate based on 2000 Country Census; 2010, 2020 and 2030 projections based on 2000 Census. Obtained from United Nations Demographic Yearbook.

Ethiopia: 1990 estimate based on 1994 Census; 2000 estimate based on 2000 Demographic and Health Survey; 2010, 2020 and 2030 projections based on 2007 Census. Census data obtained from “Table 6: Population Size of Regions by Religion and Place of Residence: 2007.” Summary and Statistical Report of the 2007 Population and Housing Census: Population Size by Age and Sex. Federal Democratic Republic of Ethiopia: Population Census Commission, 2008.

Faeroe Islands: 1990 and 2000 estimates based on World Religion Database; 2010, 2020 and 2030 projections based on 2010 World Religion Database

Falkland Islands (Malvinas): 1990 and 2000 estimates based on World Religion Database; 2010, 2020 and 2030 projections based on 2010 World Religion Database

Federated States of Micronesia: 1990 estimate based on World Religion Database; 2000 estimate based on 2000 Census; 2010, 2020 and 2030 projections based on 2000 Census. Obtained from personal email correspondence with United Nations Statistics Division.

Fiji: 1990 estimate based on 1988 Population Reference Bureau; 2000 estimate based on 1996 Census; 2010, 2020 and 2030 projections based on 2007 Census. Obtained from “‘Table 2.10 Population by Religion and Province of Enumeration, Fiji: 2007 Census,’ Key Statistics: March 2009.” Fiji 2007 Census. Fiji Islands Bureau of Statistics, 2009.

Finland: 1990 and 2000 estimates based on World Religion Database; 2010, 2020 and 2030 projections carried out by the International Institute for Applied Systems Analysis based on 2008 data from Statistics Finland

France: 1990 estimate based on 1988 Population Reference Bureau; 2000 estimate based on Pew Research Center’s Global Attitudes Project 2002 Survey; 2010, 2020 and 2030 projections carried out by the International Institute for Applied Systems Analysis based on the 2008-2009 Trajectoires et Origines survey and the 1999 Census

French Guiana: 1990 and 2000 estimates based on World Religion Database; 2010, 2020 and 2030 projections based on 2010 World Religion Database

French Polynesia: 1990 estimate based on 1971 Census; 2000 estimate based on World Religion Database; 2010, 2020 and 2030 projections based on 2010 World Religion Database

Gabon: 1990 estimate based on 1988 Population Reference Bureau; 2000 estimate based on 2000 Demographic and Health Survey; 2010, 2020 and 2030 projections based on 2000 Demographic and Health Survey

Gambia: 1990 estimate based on 1988 Population Reference Bureau; 2000 estimate based on 2004 InterMedia Survey; 2010, 2020 and 2030 projections based on 2004 InterMedia Survey. Washington, D.C.: InterMedia. Prepared for Pew Research Center’s Forum on Religion & Public Life in 2009.http://www.intermedia.org/

Georgia: 1990 estimate based on World Religion Database; 2000 estimate based on 2002 Census; 2010, 2020 and 2030 projections carried out by the International Institute for Applied Systems Analysis based on the 2002 Census and the 2005 Multiple Indicator Cluster Survey, Round 3

Germany: 1990 and 2000 estimates based on World Religion Database; 2010, 2020 and 2030 projections carried out by the International Institute for Applied Systems Analysis based on the 2009 German Interior Ministry Survey, the Federal Office for Migration and Refugees’ 2008 study, “Muslim Life in Germany,” Religionsmonitor 2008, 2009 data from Eurostat and the 2002-2004 estimates of Total Fertility Rates of Turkish Population in Germany done by Susanne Schmid and Martin Kohls, Federal Office for Migration and Refugees (BAMF) based on data from the Statutory Pension Insurance report SUFAKVS04XVSBB

Ghana: 1990 estimate based on 1988 Population Reference Bureau; 2000 estimate based on 2000 Census; 2010, 2020 and 2030 projections based on 2000 Census. Census data obtained from United Nations Demographic Yearbook.

Gibraltar: 1990 estimate based on 1991 Census; 2000 estimate based on 2001 Census; 2010, 2020 and 2030 projections based on 2001 Census. Obtained from United Nations Demographic Yearbook.

Greece: 1990 estimate based on 1988 Population Reference Bureau; 2000 estimate based on 2002 European Social Survey; 2010, 2020 and 2030 projections carried out by the International Institute for Applied Systems Analysis based on the 2001 Census

Greenland: 1990 and 2000 estimates based on World Religion Database; 2010, 2020 and 2030 projections based on 2010 World Religion Database

Grenada: 1990 and 2000 estimates based on World Religion Database; 2010, 2020 and 2030 projections based on 2010 World Religion Database

Guadeloupe: 1990 and 2000 estimates based on World Religion Database; 2010, 2020 and 2030 projections based on 2010 World Religion Database

Guam: 1990 and 2000 estimates based on World Religion Database; 2010, 2020 and 2030 projections based on 2010 World Religion Database

Guatemala: 1990 estimate based on World Religion Database; 2000 estimate based on 1998 Demographic and Health Survey; 2010, 2020 and 2030 projections based on 2010 World Religion Database

Guinea: 1990 estimate based on 1988 Population Reference Bureau; 2000 estimate based on 1999 Demographic and Health Survey; 2010, 2020 and 2030 projections based on 2005 Demographic and Health Survey

Guinea Bissau: 1990 estimate based on 1988 Population Reference Bureau; 2000 estimate based on World Religion Database; 2010, 2020 and 2030 projections based on 2010 World Religion Database

Guyana: 1990 estimate based on 1988 Population Reference Bureau; 2000 estimate based on 2002 Census; 2010, 2020 and 2030 projections based on 2002 Census. Census data obtained from “‘Religious Composition,’ Chapter II Population Composition,” Census 2002 National Census Report. Guyana Bureau of Statistics, 2007. http://www.statisticsguyana.gov.gy/pubs/Chapter2_Population_Composition.pdf(PDF)

Haiti: 1990 and 2000 estimates based on World Religion Database; 2010, 2020 and 2030 projections based on 2003 Census. Census data obtained from “Le Quatrième Recensement General de la Population et de l’Habitat.” Haiti 2003 Census. Institut Haïtien de Statistique et d’Informatique, 2003.http://www.ihsi.ht/rgph_resultat_ensemble_population.htm#

Honduras: 1990 and 2000 estimates based on World Religion Database; 2010, 2020 and 2030 projections based on 2010 World Religion Database

Hong Kong: 1990 and 2000 estimates based on World Religion Database; 2010, 2020 and 2030 projections based on 2009 Hong Kong Government Statistical Summary

Hungary: 1990 estimate based on 1991 World Values Survey; 2000 estimate based on 2001 Census; 2010, 2020 and 2030 projections based on 2010 World Religion Database

Iceland: 1990 and 2000 estimates based on World Religion Database; 2010, 2020 and 2030 projections based on 2010 World Religion Database

India: 1990 estimate based on 1991 Census; 2000 estimate based on 2001 Census; 2010, 2020 and 2030 projections based on 2001 Census. Obtained from “Table: India at a Glance – Religious Composition.” India 2001 Census. Government of India: Office of the Registrar General & Census Commissioner, 2001. http://www.censusindia.gov.in/Census_Data_2001/India_at_glance/religion.aspxand http://www.censusindia.net/

Indonesia: 1990 estimate based on 1990 Census; 2000 estimate based on 2000 Census; 2010, 2020 and 2030 projections based on 2000 Census. Obtained from United Nations Demographic Yearbook.

Iran: 1990 estimate based on 1986 Census; 2000 estimate based on 2000 World Values Survey; 2010, 2020 and 2030 projections based on 2006 Census. Census data obtained from consultant Farzaneh Zayan Roudi (see Appendix C: Advisers and Consultants).

Iraq: 1990 estimate based on 1988 Population Reference Bureau; 2000 estimate based on 2004 World Values Survey; 2010, 2020 and 2030 projections based on 2006 World Values Survey

Ireland: 1990 estimate based on World Religion Database; 2000 estimate based on 2002 Census; 2010, 2020 and 2030 projections carried out by the International Institute for Applied Systems Analysis based on the 2006 Census

Isle of Man: 1990 and 2000 estimates based on World Religion Database; 2010, 2020 and 2030 projections based on 2010 World Religion Database

Israel: 1990 and 2000 estimates based on 2009 Statistical Abstract of Israel, Central Bureau of Statistics; 2010, 2020 and 2030 projections based on 2009 Statistical Abstract of Israel, Central Bureau of Statistics and “Projection for 2010 and 2025, by Population, Religion, Variant and Average Yearly Percentage of Growth, 2005.” www.cbs.gov.il

Italy: 1990 and 2000 estimates based on World Religion Database; 2010, 2020 and 2030 projections carried out by the 2010 International Institute for Applied Systems Analysis based on the 2009 Fondazione Iniziative e Studi sulla Multietnicità (ISMU) and the 2002 Eurostat

Ivory Coast: 1990 estimate based on 1988 Census; 2000 estimate based on 1998 Census; 2010, 2020 and 2030 projections based on 2005 Demographic and Health Survey

Jamaica: 1990 estimate based on World Religion Database; 2000 estimate based on 2001 Census; 2010, 2020 and 2030 projections based on 2001 Census. Obtained from United Nations Demographic Yearbook.

Japan: 1990 and 2000 estimates based on World Religion Database; 2010, 2020 and 2030 projections based on 2010 World Religion Database

Jordan: 1990 estimate based on 1990 Demographic and Health Survey; 2000 estimate based on 2002 Demographic and Health Survey; 2010, 2020 and 2030 projections based on 2002 Demographic and Health Survey

Kazakhstan: 1990 estimate based on 1995 Demographic and Health Survey; 2000 estimate based on 1999 Demographic and Health Survey; 2010, 2020 and 2030 projections based on 1999 Demographic and Health Survey

Kenya: 1990 estimate based on 1988 Population Reference Bureau; 2000 estimate based on 2003 Demographic and Health Survey; 2010, 2020 and 2030 projections based on 2003 Demographic and Health Survey

Kiribati: 1990 and 2000 estimates based on World Religion Database; 2010, 2020 and 2030 projections based on 2005 Census. Census data obtained from “Section 4.2, ‘Religion.’ ” Kiribati 2005 Census, Volume 2: Analytical Report. Kiribati National Statistics Office, 2007.http://www.spc.int/prism/Country/KI/Stats/CensusSurveys/censurveys-index.htm

Kosovo: 1990 and 2000 estimates based on World Religion Database; 2010, 2020 and 2030 projections carried out by the 2010 International Institute for Applied Systems Analysis based on the 2000 World Bank, Kosovo Living Standards Measurement Study Survey and 2000 data from the Statistical Office of Kosovo

Kuwait: 1990 and 2000 estimates based on World Religion Database; 2010, 2020 and 2030 projections based on 2010 World Religion Database

Kyrgyzstan: 1990 estimate based on World Religion Database; 2000 estimate based on 1997 Demographic and Health Survey; 2010, 2020 and 2030 projections based on 1997 Demographic and Health Survey

Laos: 1990 estimate based on 1995 Census; 2000 estimate based on World Religion Database; 2010, 2020 and 2030 projections based on 2005 Census

Latvia: 1990 estimate based on 1990 World Values Survey; 2000 estimate based on 1999 World Values Survey; 2010, 2020 and 2030 projections based on 1999 World Values Survey

Lebanon: 1990 estimate based on 1988 Population Reference Bureau; 2000 estimate based on Pew Research Center’s Global Attitudes Project 2002 Survey; 2010, 2020 and 2030 projections based on 2010 World Religion Database

Lesotho: 1990 estimate based on World Religion Database; 2000 estimate based on 2003 Afrobarometer Survey; 2010, 2020 and 2030 projections based on 2010 World Religion Database

Liberia: 1990 estimate based on 1986 Demographic and Health Survey; 2000 estimate based on 2007 Demographic and Health Survey; 2010, 2020 and 2030 projections based on 2008 Census. Census data obtained from “Table 4.3: Distribution of Population by Religious Affiliation, Age and Sex, Liberia 2008.” 2008 Population and Housing Census: Final Results. Liberia Institute of Statistics and Geo-Information Services, 2009.

Libya: 1990 estimate based on 1988 Population Reference Bureau; 2000 estimate based on World Religion Database; 2010, 2020 and 2030 projections based on 2010 World Religion Database

Liechtenstein: 1990 estimate based on 1990 Census; 2000 estimate based on 2000 Census; 2010, 2020 and 2030 projections based on 2000 Census. Census data obtained from “Religion und Hauptsprachen – Band 2.” Liechtenstein 2000 Census. Lichtenstein Statistics Department, 2000. http://www.llv.li/pdf-llv-avw-statistik-religion_und_hauptsprache_teil1-analyse(PDF)

Lithuania: 1990 estimate based on World Religion Database; 2000 estimate based on 2001 Census; 2010, 2020 and 2030 projections based on 2001 Census. Census data obtained from United Nations Demographic Yearbook.

Luxembourg: 1990 estimate based on World Religion Database; 2000 estimate based on 2002 European Social Survey; 2010, 2020 and 2030 projections based on 2008 European Values Survey

Macau: 1990 and 2000 estimates based on World Religion Database; 2010, 2020 and 2030 projections based on 1991 Census. Census data obtained from United Nations Demographic Yearbook.

Madagascar: 1990 estimate based on 1992 Demographic and Health Survey; 2000 estimate based on 1997 Demographic and Health Survey; 2010, 2020 and 2030 projections based on 2004 Demographic and Health Survey

Malawi: 1990 estimate based on 1988 Population Reference Bureau; 2000 estimate based on 2000 Demographic and Health Survey; 2010, 2020 and 2030 projections based on 1998 Census. Obtained from World Christian Encyclopedia, 2nd Edition. David B. Barrett, George T. Kurian, and Todd M. Johnson, eds. United States: Oxford University Press, 2001.

Malaysia: 1990 estimate based on 1988 Population Reference Bureau; 2000 estimate based on 2000 Census; 2010, 2020 and 2030 projections based on 2000 Census. Census data obtained from United Nations Demographic Yearbook.

Maldives: 1990 estimate based on 1988 Population Reference Bureau; 2000 estimate based on World Religion Database; 2010, 2020 and 2030 projections based on 2010 World Religion Database

Mali: 1990 estimate based on 1987 Demographic and Health Survey; 2000 estimate based on 2001 Demographic and Health Survey; 2010, 2020 and 2030 projections based on 2006 Demographic and Health Survey

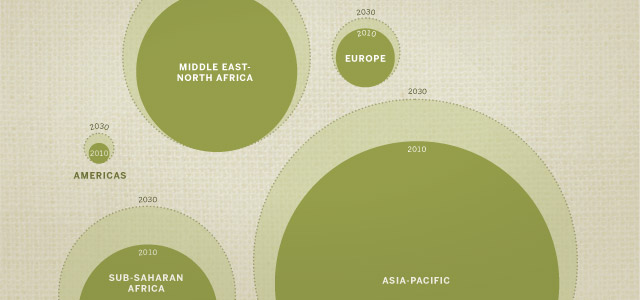
Malta: 1990 and 2000 estimates based on World Religion Database; 2010, 2020 and 2030 projections based on 2010 World Religion Database

Marshall Islands: 1990 estimate based on World Religion Database; 2000 estimate based on 1999 Census; 2010, 2020 and 2030 projections based on 1999 Census. Census data obtained from United Nations Demographic Yearbook.

Martinique: 1990 and 2000 estimates based on World Religion Database; 2010, 2020 and 2030 projections based on 2010 World Religion Database

Mauritania: 1990 estimate based on 1988 Population Reference Bureau; 2000 estimate based on World Religion Database; 2010, 2020 and 2030 projections based on 2005 World Religion Database

Mauritius: 1990 estimate based on 1990 Census; 2000 estimate based on 2000 Census; 2010, 2020 and 2030 projections based on 2000 Census. Obtained from United Nations Demographic Yearbook.

Mayotte: 1990 estimate based on 1988 Population Reference Bureau; 2000 estimate based on World Religion Database; 2010, 2020 and 2030 projections based on 2010 World Religion Database

Mexico: 1990 and 2000 estimates based on World Religion Database; 2010, 2020 and 2030 projections based on 1996 World Values Survey

Moldova: 1990 estimate based on 1996 World Values Survey; 2000 estimate based on World Religion Database; 2010, 2020 and 2030 projections based on 2010 World Religion Database

Monaco: 1990 and 2000 estimates based on World Religion Database; 2010, 2020 and 2030 projections based on 2010 World Religion Database

Mongolia: 1990 estimate based on 1988 Population Reference Bureau; 2000 estimate based on World Religion Database; 2010, 2020 and 2030 projections based on 2010 World Religion Database

Montenegro: 1990 estimate based on 1988 Population Reference Bureau; 2000 estimate based on World Religion Database; 2010, 2020 and 2030 projections carried out by the 2010 International Institute for Applied Systems Analysis based on the 2003 Census and the 2003 data from The Statistical Office of Montenegro

Montserrat: 1990 estimate based on 1980 Census; 2000 estimate based on World Religion Database; 2010, 2020 and 2030 projections based on 1980 Census. Census data obtained from United Nations Demographic Yearbook.

Morocco: 1990 estimate based on 1988 Population Reference Bureau; 2000 estimate based on 2001 World Values Survey; 2010, 2020 and 2030 projections based on Pew Research Center’s Global Attitudes Project 2007 Survey

Mozambique: 1990 estimate based on 1988 Population Reference Bureau; 2000 estimate based on 1997 Demographic and Health Survey; 2010, 2020 and 2030 projections based on 2003 Demographic and Health Survey

Namibia: 1990 and 2000 estimates based on World Religion Database; 2010, 2020 and 2030 projections based on 2010 World Religion Database

Nauru: 1990 and 2000 estimates based on World Religion Database; 2010, 2020 and 2030 projections based on 2002 Census. Census data obtained from “Chapter 2 ‘Population Characteristics-Religion.’” 2002 Nauru Census Main Report and Demographic Profile of the Republic of Nauru 1992-2002. The Secretariat of the Pacific Community, 2006.http://www.spc.int/prism/country/nr/stats/Publication/Census/NR_02_Census_Rept_FINAL.pdf (PDF)

Nepal: 1990 estimate based on 1991 Census; 2000 estimate based on 2001 Census; 2010, 2020 and 2030 projections based on 2001 Census. Obtained from United Nations Demographic Yearbook.

Netherlands: 1990 estimate based on 1986 Census; 2000 estimate based on 2003 Census; 2010, 2020 and 2030 projections carried out by the International Institute for Applied Systems Analysis based on 2007 data from Statistics Netherlands

Netherlands Antilles: 1990 estimate based on 1992 Census; 2000 estimate based on World Religion Database; 2010, 2020 and 2030 projections based on 1992 Census. Census data obtained from United Nations Demographic Yearbook.

New Caledonia: 1990 and 2000 estimates based on World Religion Database; 2010, 2020 and 2030 projections based on 2010 World Religion Database

New Zealand: 1990 estimate based on 1991 Census; 2000 estimate based on World Religion Database; 2010, 2020 and 2030 projections based on 2006 Census.

Nicaragua: 1990 and 2000 estimates based on World Religion Database; 2010, 2020 and 2030 projections based on 2010 World Religion Database

Niger: 1990 estimate based on 1988 Census; 2000 estimate based on 1998 Demographic and Health Survey; 2010, 2020 and 2030 projections based on 2006 Demographic and Health Survey
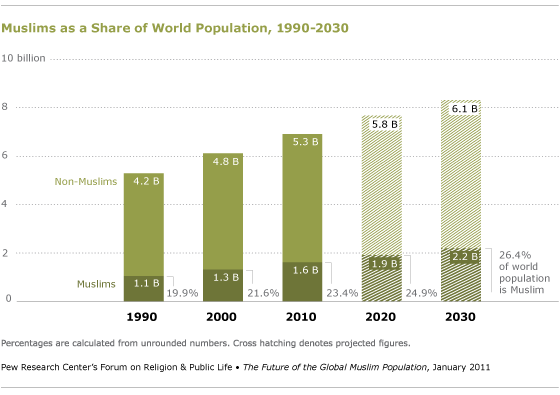
Nigeria: 1990 estimate based on 1990 Demographic and Health Survey; 2000 estimate based on 1999 Demographic and Health Survey; 2010, 2020 and 2030 projections based on 2003 and 2008 Demographic and Health Surveys and 2007 National HIV/AIDS and Reproductive Health Survey

Niue: 1990 estimate based on World Religion Database; 2000 estimate based on 1991 Census; 2010, 2020 and 2030 projections based on 2001 Census. Census data obtained from personal email correspondence with United Nations Statistics Division.

North Korea: 1990 and 2000 estimates based on World Religion Database; 2010, 2020 and 2030 projections based on 2010 World Religion Database

Northern Mariana Islands: 1990 and 2000 estimates based on World Religion Database; 2010, 2020 and 2030 projections based on 2010 World Religion Database

Norway: 1990 and 2000 estimates based on World Religion Database; 2010, 2020 and 2030 projections carried out by the International Institute for Applied Systems Analysis based on 2009 data from Statistics Norway

Oman: 1990 estimate based on 1993 Census; 2000 estimate based on World Religion Database; 2010, 2020 and 2030 projections based on 1993 Census. Census data obtained from “ ‘Table No.1: Total Population by Region: Omani & Non-Omani’; ‘Table 3.1.8: Non-Omani Population by Region, Religion, and Sex’; ‘Section 2-5: Religion,’ Housing and Establishments.” General Census of Population. Sultanate of Oman: Ministry of Development, 1993.

Pakistan: 1990 estimate based on 1988 Population Reference Bureau; 2000 estimate based on 1998 Census; 2010, 2020 and 2030 projections based on 1998 Census. Census data obtained from “Table: Population by Religion.” 1998 Population Census. Government of Pakistan: Population Census Organization, Statistics Division, 1998. http://www.census.gov.pk/Religion.htm

Palau: 1990 estimate based on World Religion Database; 2000 estimate based on 2000 Census; 2010, 2020 and 2030 projections based on 2000 Census. Census data obtained from personal email correspondence with United Nations Statistics Division.

Palestinian territories: 1990 estimate based on 1988 Population Reference Bureau; 2000 estimate based on 1997 Census; 2010, 2020 and 2030 projections based on Pew Research Center’s Global Attitudes Project 2009 Survey

Panama: 1990 and 2000 estimates based on World Religion Database; 2010, 2020 and 2030 projections based on 2010 World Religion Database

Papua New Guinea: 1990 estimate based on World Religion Database; 2000 estimate based on 2000 Census; 2010, 2020 and 2030 projections based on 2010 World Religion Database

Paraguay: 1990 estimate based on World Religion Database; 2000 estimate based on 2002 Census; 2010, 2020 and 2030 projections based on 2002 Census. Census data obtained from United Nations Demographic Yearbook.

Peru: 1990 estimate based on 1993 Census; 2000 estimate based on World Religion Database; 2010, 2020 and 2030 projections based on 2010 World Religion Database

Philippines: 1990 estimate based on 1990 Census; 2000 estimate based on 2000 Census; 2010, 2020 and 2030 projections based on 2000 Census. Obtained from United Nations Demographic Yearbook.

Pitcairn Islands: 1990 and 2000 estimates based on World Religion Database; 2010, 2020 and 2030 projections based on 2010 World Religion Database

Poland: 1990 and 2000 estimates based on World Religion Database; 2010, 2020 and 2030 projections based on 2008 European Social Survey

Portugal: 1990 estimate based on 1991 Census; 2000 estimate based on 2001 Census; 2010, 2020 and 2030 projections based on 2008 European Social Survey

Puerto Rico: 1990 estimate based on World Religion Database; 2000 estimate based on 2000 Census; 2010, 2020 and 2030 projections based on 2010 World Religion Database

Qatar: 1990 estimate based on World Religion Database; 2000 estimate based on 2004 Census; 2010, 2020 and 2030 projections based on 2004 Census. Census data obtained from United Nations Demographic Yearbook.

Republic of Congo: 1990 and 2000 estimates based on World Religion Database; 2010, 2020 and 2030 projections based on 2005 Demographic and Health Survey

Republic of Macedonia: 1990 estimate based on World Religion Database; 2000 estimate based on 2002 Census; 2010, 2020 and 2030 projections carried out by the International Institute for Applied Systems Analysis based on the 2002 Census, the 2003-2004 South East European Social Survey Project and the 2005 Multiple Indicator Cluster Survey, Round 3

Reunion: 1990 estimate based on 1988 Population Reference Bureau; 2000 estimate based on World Religion Database; 2010, 2020 and 2030 projections based on 2010 World Religion Database

Romania: 1990 estimate based on 1992 Census; 2000 estimate based on 2002 Census; 2010, 2020 and 2030 projections carried out by the International Institute for Applied Systems Analysis based on the 2002 Census

Russia: 1990 estimate based on World Religion Database; 2000 estimate based on ethnicity data in 2002 Country Census; 2010, 2020 and 2030 projections based on ethnicity data in 2002 Census. Census data obtained from Heleniak, Timothy. “Regional Distribution of the Muslim Population of Russia, ‘Table 4: Russia’s Ethnic Muslim Population by Region, 1989 and 2002,’” Eurasian Geography and Economics. Volume 47, No. 4. 2006.

Rwanda: 1990 estimate based on 1992 Demographic and Health Survey; 2000 estimate based on 2002 Census; 2010, 2020 and 2030 projections based on 2002 Census. Census data obtained from “Table TA06E. Distribution of the Resident Population in Ordinary Households by Religious Affiliation, Urban/Rural Residence and by Sex.” The Rwanda 2002 Census of Population and Housing. Rwanda: National Census Service, 2004.

St. Helena: 1990 estimate based on 1987 Census; 2000 estimate based on World Religion Database; 2010, 2020 and 2030 projections based on 2010 World Religion Database

St. Kitts and Nevis: 1990 estimate based on 1991 Census; 2000 estimate based on World Religion Database; 2010, 2020 and 2030 projections based on 2010 World Religion Database

St. Lucia: 1990 estimate based on 1991 Census; 2000 estimate based on 2001 Country Census; 2010, 2020 and 2030 projections based on 2001 Census. Obtained from United Nations Demographic Yearbook.

St. Pierre and Miquelon: 1990 estimate based on World Religion Database; 2000 estimate based on 2000 Country Census; 2010, 2020 and 2030 projections based on 2010 World Religion Database

St. Vincent and the Grenadines: 1990 estimate based on World Religion Database; 2000 estimate based on 2000 Census; 2010, 2020 and 2030 projections based on 2010 World Religion Database

Samoa: 1990 estimate based on 1981 Census; 2000 estimate based on 2001 Census; 2010, 2020 and 2030 projections based on 2001 Census. Obtained from personal email correspondence with United Nations Statistics Division.

San Marino: 1990 estimate based on World Religion Database; 2000 estimate based on 2000 Census; 2010, 2020 and 2030 projections based on 2010 World Religion Database

Sao Tome and Principe: 1990 estimate based on 1991 Census; 2000 estimate based on World Religion Database; 2010, 2020 and 2030 projections based on 2010 World Religion Database

Saudi Arabia: 1990 estimate based on 1988 Population Reference Bureau; 2000 estimate based on 2003 World Values Survey; 2010, 2020 and 2030 projections based on 2003 World Values Survey

Senegal: 1990 estimate based on 1991 Census; 2000 estimate based on 2002 Afrobarometer Survey; 2010, 2020 and 2030 projections based on 2006 Demographic and Health Survey

Serbia: 1990 estimate based on World Religion Database; 2000 estimate based on 2002 Census; 2010, 2020 and 2030 projections carried out by the International Institute for Applied Systems Analysis based on the 2002 Census

Seychelles: 1990 estimate based on 1987 Census; 2000 estimate based on 2002 Census; 2010, 2020 and 2030 projections based on 2002 Census. Obtained from United Nations Demographic Yearbook.

Sierra Leone: 1990 estimate based on 1988 Population Reference Bureau; 2000 estimate based 2004 Census; 2010, 2020 and 2030 projections based on 2004 Census. Census data obtained from “Table 1.9: Percentage distribution of Heads by Religion by Region and Residence.” Sierra Leone Integrated Household Survey (SLIHS) 2003/04. Government of Sierra Leone, 2007.http://www.statistics.sl/slihs_report.pdf(PDF)

Singapore: 1990 estimate based on 1990 Census; 2000 estimate based on 2000 Census; 2010, 2020 and 2030 projections based on 2000 Census. Obtained from United Nations Demographic Yearbook.

Slovakia: 1990 estimate based on 1991 Census; 2000 estimate based on World Religion Database; 2010, 2020 and 2030 projections based on 2008 European Social Survey

Slovenia: 1990 estimate based on 1991 Census; 2000 estimate based on 2002 Census; 2010, 2020 and 2030 projections based on 2002 Census. Obtained from United Nations Demographic Yearbook.

Solomon Islands: 1990 estimate based on 1986 Census; 2000 estimate based on 1999 Census; 2010, 2020 and 2030 projections based on 1999 Census. Obtained from “Table P01-3: Relationship, Ethnicity, and Religion by Province of Enumeration, Solomon Islands: 1999.” Solomon Islands 1999 Census. PacificWeb.org. http://www.pacificweb.org/DOCS/Other P.I/SolomonIs/Si1999/PROVINCE.doc

Somalia: 1990 estimate based on 1988 Population Reference Bureau; 2000 estimate based on World Religion Database; 2010, 2020 and 2030 projections based on 2010 World Religion Database

South Africa: 1990 estimate based on 1996 Census; 2000 estimate based on 2001 Census; 2010, 2020 and 2030 projections based on 2001 Census. Obtained from United Nations Demographic Yearbook.

South Korea: 1990 estimate based on 1996 World Values Survey; 2000 estimate based on 2001 World Values Survey; 2010, 2020 and 2030 projections based on 2010 World Religion Database

Spain: 1990 estimate based on World Religion Database; 2000 estimate based on 2000 Census; 2010, 2020 and 2030 projections carried out by the International Institute for Applied Systems Analysis based on the 2008 Eurostat, the 2008 Statistics Spain and the 2007 Spanish Municipal Population Registry and National Immigrants Survey

Sri Lanka: 1990 estimate based on 1988 Population Reference Bureau; 2000 estimate based on 2001 Census; 2010, 2020 and 2030 projections based on 2001 Census. Census data obtained from United Nations Demographic Yearbook.

Sudan: 1990 estimate based on 1988 Population Reference Bureau; 2000 estimate based on World Religion Database; 2010, 2020 and 2030 projections based on 2010 World Religion Database

Suriname: 1990 estimate based on 1988 Population Reference Bureau; 2000 estimate based on World Religion Database; 2010, 2020 and 2030 projections based on 2010 World Religion Database

Swaziland: 1990 and 2000 estimates based on World Religion Database; 2010, 2020 and 2030 projections based on 2006 Demographic and Health Survey

Sweden: 1990 and 2000 estimates based on World Religion Database; 2010, 2020 and 2030 projections carried out by the International Institute for Applied Systems Analysis based on 2008 data from Statistics Sweden

Switzerland: 1990 estimate based on 1990 Census; 2000 estimate based on 2000 Census; 2010, 2020 and 2030 projections carried out by the International Institute for Applied Systems Analysis based on the 2006 Census and Goujon, A., Skirbekk, V., and K. Fliegenschnee, “New Times, Old Beliefs: Investigating the Future of Religions in Austria and Switzerland,” Eurostat/UNECE Demographic Projections Conference Proceedings, pp. 355-370, 2007.

Syria: 1990 estimate based on 1988 Population Reference Bureau; 2000 estimate based on World Religion Database; 2010, 2020 and 2030 projections based on 2010 World Religion Database

Taiwan: 1990 estimate based on 1988 Population Reference Bureau; 2000 estimate based on World Religion Database; 2010, 2020 and 2030 projections based on 2006 World Values Survey

Tajikistan: 1990 and 2000 estimates based on World Religion Database; 2010, 2020 and 2030 projections based on 2003 ethnicity data from Goskomstat

Tanzania: 1990 estimate based on 1988 Population Reference Bureau; 2000 estimate based on 1999 Demographic and Health Survey; 2010, 2020 and 2030 projections based on 2004 Demographic and Health Survey

Thailand: 1990 estimate based on 1990 Census; 2000 estimate based on 2000 Census; 2010, 2020 and 2030 projections based on 2009 estimate by consultant Aree Jampaklay (see Appendix C: Advisers and Consultants).

Timor-Leste: 1990 estimate based on 1990 Census; 2000 estimate based on 2003 Demographic and Health Survey; 2010, 2020 and 2030 projections based on 2003 Demographic and Health Survey

Togo: 1990 estimate based on 1988 Demographic and Health Survey; 2000 estimate based on 1998 Demographic and Health Survey; 2010, 2020 and 2030 projections based on 1998 Demographic and Health Survey

Tokelau: 1990 and 2000 estimates based on World Religion Database; 2010, 2020 and 2030 projections based on 2006 Census. Census data obtained from “‘Table 2.5: Lotu i te Fenua e Mahani Nofo ai (Religion by Atoll of Usual Residence),’ Tabular Report, Section 2, Social Profile.” Tokelau 2006 Census of Population and Dwellings. Statistics New Zealand and the Office of the Council for the Ongoing Government of Tokelau, 2006.http://www.spc.int/prism/country/tk/stats/Reports/2006censusrpts/2006%20Census%20Tabular%20Report%20-%20Final.pdf(PDF)

Tonga: 1990 estimate based on 1996 Census; 2000 estimate based on 2001 Census; 2010, 2020 and 2030 projections based on 2001 Census. Obtained from United Nations Demographic Yearbook.

Trinidad and Tobago: 1990 estimate based on 1990 Census; 2000 estimate based on 2000 Census; 2010, 2020 and 2030 projections based on 2000 Census. Obtained from “Non- Institutional Population: Religion.” Trinidad and Tobago 2000 Census: 2007 Pocket Digest. Central Statistical Office, 2007.  http://cso.gov.tt/files/cms/PocketDigest2007.pdf(PDF)

Tunisia: 1990 estimate based on 1988 Population Reference Bureau; 2000 estimate based on World Religion Database; 2010, 2020 and 2030 projections based on 2005 World Religion Database

Turkey: 1990 and 2000 estimates based on World Religion Database; 2010, 2020 and 2030 projections based on Carkoglu, Ali and Binnaz, Toprak, “Religion, Society and Politics in a Changing Turkey,” Istanbul: Turkish Economic and Social Studies Foundation Publications, 2006.

Turkmenistan: 1990 estimate based on World Religion Database; 2000 estimate based on 2000 Demographic and Health Survey; 2010, 2020 and 2030 projections based on 2000 Demographic and Health Survey. Demographic and Health Survey data obtained from “Table 3.2: Residence, ethnicity, and religion by region.” Turkmenistan Demographic and Health Survey 2000. Calverton, Maryland: Gurbansoltan Eje Clinical Research Center for Maternal and Child Health (GECRCMCH) and ORC Macro; Turkmenistan: Ministry of Health and Medical Industry. Calverton, Maryland: GECRCMCH and ORC Macro, 2001. NOTE: The DHS dataset for Turkmenistan has never been released, but data on religious affiliation was included in the text of the DHS report cited here.

Turks and Caicos Islands: 1990 estimate based on 1990 Census; 2000 estimate based on World Religion Database; 2010, 2020 and 2030 projections based on 2010 World Religion Database

Tuvalu: 1990 estimate based on World Religion Database; 2000 estimate based on 2002 Census; 2010, 2020 and 2030 projections based on 2010 World Religion Database

Uganda: 1990 estimate based on 1991 Census; 2000 estimate based on 2001-2002 Demographic and Health Survey; 2010, 2020 and 2030 projections based on 2002 Census. Obtained from United Nations Demographic Yearbook.

Ukraine: 1990 estimate based on 1999 World Values Survey; 2000 estimate based on Pew Research Center’s Global Attitudes Project 2002 Survey; 2010, 2020 and 2030 projections carried out by the International Institute for Applied Systems Analysis based on the 2001 Census and the 2007 Demographic and Health Survey

United Arab Emirates: 1990 and 2000 estimates based on World Religion Database; 2010, 2020 and 2030 projections based on 2010 World Religion Database

United Kingdom: 1990 estimate based on World Religion Database; 2000 estimate based on 2001 Census; 2010, 2020 and 2030 projections carried out by the International Institute for Applied Systems Analysis based on the 2001 Census

Uruguay: 1990 and 2000 estimates based on World Religion Database; 2010, 2020 and 2030 projections based on 2010 World Religion Database

United States: 1990 estimate based on 1988 Population Reference Bureau; 2000 estimate based on 1988 Population Reference Bureau; 2010, 2020 and 2030 projections carried out by the International Institute for Applied Systems Analysis and The Pew Research Center’s Forum on Religion & Public Life based on the Pew Research Center’s 2007 survey, “Muslim Americans: Middle Class and Mostly Mainstream,” the 2003 New Immigrants Survey, the 2008 American Community Survey and the U.S. Centers for Disease Control and Prevention’s National Vital Statistics data

Uzbekistan: 1990 estimate based on 1996 Demographic and Health Survey; 2000 estimate based on 2002 Demographic and Health Survey; 2010, 2020 and 2030 projections based on 2002 Demographic and Health Survey

Vanuatu: 1990 estimate based on 1989 Census; 2000 estimate based on 1999 Census; 2010, 2020 and 2030 projections based on 1999 Census. Obtained from “Table D: The three most common religious groups by province”; “Table 2.10: Population by religion and island of residence.” 1999 Population and Housing Census. Vanuatu National Statistics Office, 2001.

Vatican City: 1990 and 2000 estimates based on World Religion Database; 2010, 2020 and 2030 projections based on 2010 World Religion Database

Venezuela: 1990 and 2000 estimates based on World Religion Database; 2010, 2020 and 2030 projections based on 2010 World Religion Database

Vietnam: 1990 estimate based on 1988 Population Reference Bureau; 2000 estimate based on 1999 Census; 2010, 2020 and 2030 projections based on 2010 World Religion Database

U.S. Virgin Islands: 1990 and 2000 estimates based on World Religion Database; 2010, 2020 and 2030 projections based on 2010 World Religion Database

Wallis and Futuna: 1990 and 2000 estimates based on World Religion Database; 2010, 2020 and 2030 projections based on 2010 World Religion Database

Western Sahara: 1990 estimate based on 1988 Population Reference Bureau; 2000 estimate based on World Religion Database; 2010, 2020 and 2030 projections based on 2005 World Religion Database

Yemen: 1990 estimate based on 1988 Population Reference Bureau; 2000 estimate based on World Religion Database; 2010, 2020 and 2030 projections based on 2005 World Religion Database

Zambia: 1990 estimate based on 1992 Demographic and Health Survey; 2000 estimate based on 2000 Census; 2010, 2020 and 2030 projections based on 2007 Demographic and Health Survey

Zimbabwe: 1990 estimate based on 1988 Population Reference Bureau; 2000 estimate based on 1999 Demographic and Health Survey; 2010, 2020 and 2030 projections based on 2006 Demographic and Health Survey

Appendix C: Advisers and Consultants

Project Advisers

Charles F. Westoff, Princeton University John Casterline, Ohio State University Tukufu Zuberi, University of Pennsylvania Peter Xenos, University of Hawaii Amaney Jamal, Princeton University Carl Haub, Population Reference Bureau Mohamed Ayad, ICF Macro

Consultants

Below is the list of demographers and social scientists with whom the Pew Forum consulted to arrive at the population size estimates, growth rates and future population size estimates included in this report. Most were working in their individual capacities rather than as representatives of their institution or organization.

All Muslim population estimates were arrived at using multiple sources and may not be identical with the estimates used or suggested by a particular country expert.

Mohammed Abu-Nimer, American University, Washington, D.C. (Country Focus: United States)

Niveen ME Abu-Rmeileh, Institute of Community and Public Health, Birzeit University, the West Bank (Country Focus: Palestinian territories)

Victor Agadjanian, Arizona State University, Phoenix, Arizona (Country Focus: Kazakhstan)

Tauseef Ahmed, Freelance Consultant, Pakistan (Country Focus: Pakistan)

Mohamed Ahmed Al-Haddad, Freelance Consultant, Yemen (Country Focus: Yemen)

Yousef Al-Madi, Palestine Central Bureau of Statistics, Syria (Country Focus: Syria and Palestinians living in Syria and Lebanon)

Nurul Alam, International Centre for Diarrhoeal Diseases Research, Bangladesh: Public Health Sciences Division, Health and Demographic Surveillance Unit, Bangladesh (Country Focus: Bangladesh)

Evi Nurvidya Arifin, Institute of South East Asian Studies, Singapore (Country Focus: Indonesia)

M’hamed Ayed, Freelance Consultant, Tunisia (Country Focus: Tunisia)

Bilal Barakat, Vienna Institute of Demography, Austria (Country Focus: Albania, Bosnia-Herzegovina, France, Germany, Netherlands, Spain, Sweden and United Kingdom)

Jennifer B. Barrett, Wageningen University and Research Centre, Netherlands (Country Focus: Uzbekistan)

Cem Behar, Bogaziçi University, Turkey (Country Focus: Turkey)

Ali Çarkoglu, Sabancı University, Turkey and Netherlands Institute for Advanced Study, Netherlands (Country Focus: Turkey)

Rufat Efendiyev, Institute of Economy, National Academy of Sciences of Azerbaijan, Azerbaijan (Country Focus: Azerbaijan)

Karl Feld, D3 Systems, Inc., Vienna, Virginia (Country Focus: Afghanistan)

Anne Goujon, Vienna Institute of Demography, Austria and International Institute for Applied Systems Analysis, Austria, (Country Focus: Albania, Austria, Belgium, Bosnia-Herzegovina, Bulgaria, Denmark, Finland, France, Georgia, Germany, Greece, Ireland, Italy, Kosovo, Macedonia, Montenegro, Netherlands, Norway, Romania, Serbia, Spain, Sweden, Switzerland, Ukraine, United Kingdom and United States)

Ali Hassen, College of Development Studies, Addis Ababa University, Ethiopia (Country Focus: Ethiopia)

Robert W. Hefner, Boston University, Boston, Massachusetts (Country Focus: Indonesia)

Timothy Heleniak, University of Maryland, College Park, Maryland (Country Focus: Russia)

Mohammad Irfan, International Islamic University, Islamabad, Pakistan (Country Focus: Pakistan)

Aree Jumpaklay, The Institute for Population and Social Research, Mahidal University, Thailand (Country Focus: Thailand)

Samir KC, International Institute for Applied Systems Analysis, Austria (Country Focus: Albania, Austria, Belgium, Bosnia-Herzegovina, Bulgaria, Denmark, Finland, France, Georgia, Germany, Greece, Ireland, Italy, Kosovo, Macedonia, Montenegro, Netherlands, Norway, Romania, Serbia, Spain, Sweden, Switzerland, Ukraine and United Kingdom)

Eric Kaufmann, Birkbeck College, University of London, England (Country Focus: Albania, Bosnia-Herzegovina, United Kingdom, France, Germany, Netherlands, Spain and Sweden)

Muqtedar Khan, University of Delaware, Newark, Delaware (Regional Focus: Middle East and South Asia)

Rshood M. Khraif, King Saud University, Saudi Arabia (Country Focus: Saudi Arabia)

Barkat-e-Khuda, University of Dhaka, Bangladesh (Country Focus: Bangladesh)

Khalid Khawaja, Arab Institute for Training and Research in Statistics, Jordan (Country Focus: Jordan)

Ali Kouaouci, University of Montreal, Canada (Country Focus: Algeria)

Idrissa Alichina Kourgueni, Centre International d’Etude et de Recherché, Niger (Country Focus: Burkina Faso, Chad, Mali, Mauritania and Niger)

Li Jianxin, Peking University, China (Country Focus: China)

Erling Lundevaller, Umeå University, Sweden (Country Focus: Albania, Bosnia-Herzegovina, France, Germany, Netherlands, Spain, Sweden and United Kingdom)

Aslam Mahmood, Jawaharlal Nehru University, India (Country Focus: India)

Gisele Maynard-Tucker, UCLA Center for the Study of Women, University of California, Los Angeles, North Hollywood, California (Country Focus: Guinea)

Khaleel Mohammed, San Diego State University, San Diego, California (Country Focus: Argentina, Brazil and Guyana)

Khan Mohammad Mohsin, University of Dhaka, Bangladesh (Country Focus: Bangladesh)

Abdul Ghaffar Mughal, South and East European University, Macedonia (Country Focus: Kosovo, Kyrgyzstan, Macedonia, Tajikistan and Turkmenistan)

Martha Brill Olcott, Carnegie Endowment for International Peace, Washington, D.C. (Country Focus: Azerbaijan, Kazakhstan, Kyrgyzstan, Russia, Tajikistan, Turkmenistan and Uzbekistan)

Zahia Ouadah-Bedidi, Institut National d’Études Démographiques, France (Country Focus: Libya and Morocco)

Kolawole Azeez Oyediran, John Snow Incorporated, Nigeria (Country Focus: Nigeria)

Sureeporn Punpuing, The Institute for Population and Social Research, Mahidal University, Thailand (Country Focus: Thailand)

Farzaneh Zayan Roudi, Population Reference Bureau, Washington, D.C. (Country Focus: Iran)

Abdul Majid Salleh, Freelance Consultant, Malaysia (Country Focus: Malaysia)

Abdel Aziz Hussein Sayed, Cairo University, Egypt (Country Focus: Egypt)

Vegard Skirbekk, International Institute for Applied Systems Analysis, Austria (Country Focus: Albania, Austria, Belgium, Bosnia-Herzegovina, Bulgaria, Denmark, Finland, France, Georgia, Germany, Greece, Ireland, Italy, Kosovo, Macedonia, Montenegro, Netherlands, Norway, Romania, Serbia, Spain, Sweden, Switzerland, Ukraine and United Kingdom)

Marcin Stonawski, International Institute for Applied Systems Analysis, Austria (Country Focus: Albania, Austria, Belgium, Bosnia-Herzegovina, Bulgaria, Denmark, Finland, France, Georgia, Germany, Greece, Ireland, Italy, Kosovo, Macedonia, Montenegro, Netherlands, Norway, Romania, Serbia, Spain, Sweden, Switzerland, Ukraine and United Kingdom)

El Daw Abdalla Suliman, Population Council, Sudan (Country Focus: Sudan)

Charles H. Teller, Population Reference Bureau, Washington, D.C. (Country Focus: Ethiopia)

Peter Xenos, University of Hawaii at Manoa, Honolulu, Hawaii (Country Focus: Philippines)

Yang Gui Ping, Central University for Nationalities in China, China (Country Focus: China)

Farhat Yusuf, Macquarie University, Australia (Country Focus: Australia, Canada and New Zealand)