Pew Research Center

FOR RELEASE JULY 9, 2026

U.S. Hispanics Are Divided on Whether Their Identity Helps or Hurts Them in America

Some say being Latino is a source of advantage or connection but others say it is tied to barriers and discrimination

BY Gabriel Piña, Mark Hugo Lopez, Sahana Mukherjee, Dalia Fahmy and Alexandra Cahn

FOR MEDIA OR OTHER INQUIRIES:

Communications Department
202.419.4372
www.pewresearch.org

RECOMMENDED CITATION

Pew Research Center, July 2026, "U.S. Hispanics Are Divided on Whether Their Identity Helps or Hurts Them in America"

About Pew Research Center

Pew Research Center is a nonpartisan, nonadvocacy fact tank that informs the public about the issues, attitudes and trends shaping the world. It does not take policy positions. The Center conducts public opinion polling, demographic research, computational social science research and other data-driven research. It studies politics and policy; news habits and media; the internet and technology; religion; race and ethnicity; international affairs; social, demographic and economic trends; science; research methodology and data science; and immigration and migration. Pew Research Center is a subsidiary of The Pew Charitable Trusts, its primary funder.

© Pew Research Center 2026

About this research

This Pew Research Center analysis explores the ways U.S. Latinos express and view their national, ethnic and racial identities.

Why did we do this?

The Center does research to inform the public, journalists and decision-makers. This analysis builds on a quarter century of research about Hispanic identity. It is part of a larger body of work that explores the attitudes and experiences of U.S. Hispanics.

Learn more about Pew Research Center, our research on Hispanics in the U.S. and other research on race and ethnicity.

How did we do this?

This analysis is based on Pew Research Center’s latest National Survey of Latinos, conducted from Oct. 6 to 16, 2025, among a sample of 8,046 U.S. adults. Some 4,923 Hispanics were surveyed, with 1,125 respondents who are members of the Center’s American Trends Panel (ATP) and 3,798 respondents who are members of SSRS’s Opinion Panel. The survey also included 3,114 non-Hispanic ATP members. Here are the questions used for this analysis, detailed responses and the methodology.

The survey was conducted in English and Spanish. Respondents were recruited through national, random sampling of residential addresses. This kind of recruitment gives nearly all U.S. adults a chance of selection.

Interviews took place either online, or by telephone with a live interviewer. The survey is weighted to be representative of the U.S. adult population by gender, race, ethnicity, partisan affiliation, education, presidential vote (among voters) and other factors. Read more about the ATP’s methodology.

Table of contents

  • About Pew Research Center
  • About this research
  • U.S. Hispanics Are Divided on Whether Their Identity Helps or Hurts Them in America
  • The many ways U.S. Hispanics describe their identity
  • Latino Trump voters are less likely than Harris voters to say being Latino is central to their lives
  • Latino immigrants and U.S.-born Latinos differ on how much their identity shapes their lives
  • Appendix: Supplemental tables
  • Acknowledgments
  • Methodology

U.S. Hispanics Are Divided on Whether Their Identity Helps or Hurts Them in America

Some say being Latino is a source of advantage or connection but others say it is tied to barriers and discrimination

Key terms

The terms Hispanic and Latino are used interchangeably in this analysis.

U.S.-born people are those born in the 50 U.S. states and the District of Columbia, or those born in foreign countries to U.S. citizen parents.

Immigrants are U.S. residents born in foreign countries to parents who aren’t U.S. citizens.

Note: In this report, people born in Puerto Rico are considered immigrants. Although individuals born in Puerto Rico are U.S. citizens by birth, they are born into a Spanish-dominant culture. On many points, their attitudes, views and beliefs are much closer to Hispanics born abroad than to Hispanics born in the 50 states or D.C., even those who identify as being of Puerto Rican origin.

Second generation refers to U.S.-born people who have at least one immigrant parent.

Third or higher generation refers to U.S.-born people who have two U.S.-born parents.

Throughout this report, Democrats are respondents who identify with the Democratic Party or who identify as independent but lean toward the Democratic Party. Republicans are those who identify with the Republican Party or who identify as independent but lean toward the Republican Party.

Validated voters are adult citizens who told us in a postelection survey that they voted in a given general election and have a record of voting in a commercial voter file. Trump voters are validated voters who self-reported that they voted for Republican Donald Trump in the 2024 presidential election. Harris voters are validated voters who self-reported that they voted for Democrat Kamala Harris in the 2024 presidential election.

Nonvoters are those who did not vote in 2024 but were eligible to do so.

Country of origin or place of origin refers to the country or place that respondents’ families trace their heritage to. These terms are used interchangeably with similar expressions such as home country, family origins, family roots, ancestral origin and heritage.

For most Hispanics living in the United States, their Hispanic identity is an important part of how they see themselves. But there is no single view of what that identity means for their lives: some people see it as a source of connection or advantage, while others associate it with obstacles to getting ahead.
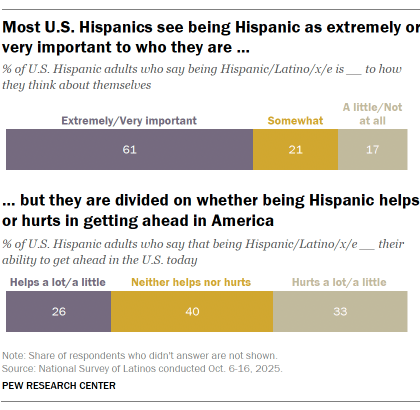
A bar chart showing Most U.S. Hispanics see being Hispanic as extremely or
very important to who they are … but they are divided on whether being Hispanic helps
or hurts in getting ahead in America

In a Pew Research Center survey conducted in October 2025, 61% of Hispanic adults say being Hispanic is an extremely or very important part of how they think about themselves. At the same time, 33% say being Hispanic hurts their ability to get ahead a lot or a little, while 26% say it helps a lot or a little and 40% say it makes no difference.1

Hispanics’ views about their identity differ sharply across two factors: political leaning and immigrant generation.

  • Hispanic Democrats and Republicans often express different views about the importance and impact of their Hispanic identity. The gaps between Hispanics who voted for Democratic candidate Kamala Harris in 2024 and those who voted for President Donald Trump are often even more pronounced.
  • Differences also emerge between immigrants and U.S.-born Hispanics, including those in the second generation and third or higher generations. (Find our definitions of immigrant generations in Key Terms.)

Hispanics see links between their identity and their lives in other ways. About a third (34%) say they personally experienced discrimination or were treated unfairly in the 12 months before the survey because of their Hispanic background by someone who is not Hispanic. A quarter or more say they were criticized for speaking Spanish in public (29%), told to go back to their home country (26%) or called offensive names for being Hispanic (25%).
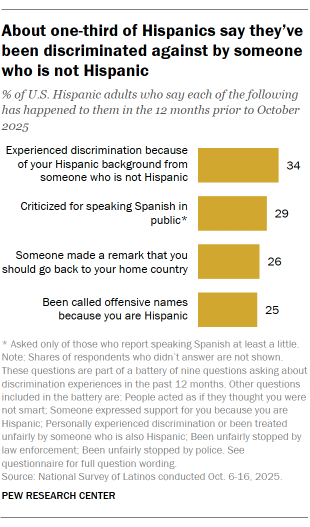
A bar chart showing About one-third of Hispanics say they’ve been discriminated against by someone who is not Hispanic

But not all Hispanic adults experience these types of discrimination. A majority (54%) say they have not experienced any of the four discrimination incidents related to being Hispanic asked about in the survey.2 And about a third (34%) say that someone expressed support for them because they are Hispanic.

These findings are based on the Center’s National Survey of Latinos, conducted Oct. 6-16, 2025, among 4,923 Latino adults in English and Spanish. The survey took place before subsequent changes in immigration enforcement and shifts in the national economic situation, which may shape how U.S. Hispanics experience identity and opportunity today. Other findings from the same survey – including those about Hispanics’ views of the Trump administration, immigration policy and economics – were published in November 2025.

Hispanics are the second-largest racial or ethnic group in the U.S., accounting for about one-in-five people in the country. They are a growing share of the U.S. population, electorate and labor force.

U.S. Hispanics have family roots across Latin America and elsewhere, and they emphasize their cultural diversity: About three-quarters say Hispanics in the U.S. have many different cultures, while a quarter say they share a common culture, according to the October survey.

This analysis examines how Hispanics view their identity and its impact on their lives in the U.S. It does so across political lines and immigrant generations. It also explores the labels that Hispanics use to describe their Hispanic and American identities.

The rest of this section summarizes some of the key findings on these topics.

Political identity is tied to how Hispanics understand and experience Hispanic identity

Like Republicans and Democrats overall, Hispanic partisans disagree on issues ranging from the economy to immigration. Hispanics also see the impact of their Hispanic identity very differently depending on their 2024 presidential vote and their party affiliation, according to the October survey.
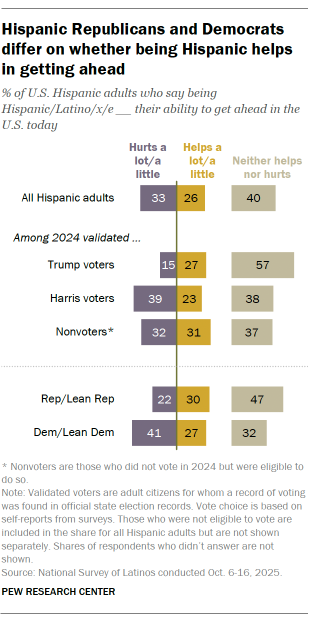
A bar chart showing Hispanic Republicans and Democrats differ on whether being Hispanic helps in getting ahead

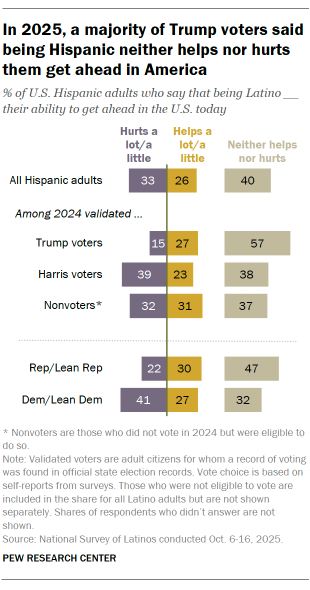
A majority of 2024 Hispanic Trump voters (57%) say being Hispanic neither helps nor hurts them get ahead in America. Much smaller shares say it helps a lot or a little (27%) or that it hurts a lot or a little (15%). By contrast, Hispanic Harris voters are more likely to see being Hispanic as a disadvantage: 39% say their identity hurts them, another 38% say it neither helps nor hurts, and 23% say it helps.

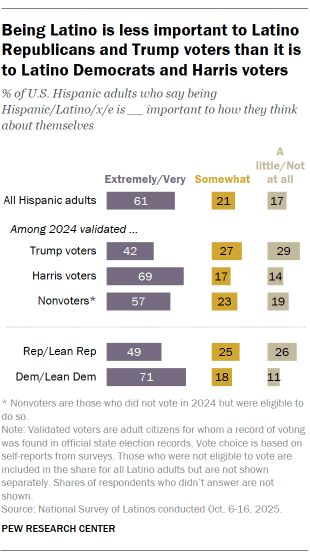
Political differences extend beyond perceptions of opportunity. Hispanic Trump and Harris voters also differ in how central Hispanic identity is to how they think about themselves and how connected they feel to other Hispanics. For example, 42% of Trump voters say being Hispanic is extremely or very important to how they see themselves, while 69% of Harris voters say the same.

There are similar differences by political party, though they are generally not as sharp.

Among Hispanic Republicans, nearly half (47%) say being Hispanic neither helps nor hurts their ability to get ahead in the U.S. This is a larger share than those who say it hurts (30%) or that it helps (22%).

By contrast, Hispanic Democrats most commonly say being Hispanic hurts their ability to get ahead (41%), while fewer say it doesn’t make a difference (32%) or that it helps (27%).

Political differences also extend to responses that people give about their experiences with discrimination. For example, Hispanic Democrats are more likely than Hispanic Republicans to say they were discriminated against or were treated unfairly because of their Hispanic background by someone who is not Hispanic, in the 12 months before the October survey (40% vs. 29%).

Similarly, Hispanic Democrats are more likely than Hispanic Republicans to say they were criticized for speaking Spanish in public (33% vs. 25%), that someone told them to go back to their home country (30% vs. 22%), or that they were called offensive names because they are Hispanic (29% vs. 22%).

Although many Hispanic Trump voters identify as Republicans, the two groups are not identical, according to a Pew Research Center analysis of validated voters. That distinction is reflected in some of the October survey’s findings.

In the 2024 presidential election, nearly half of Hispanic voters backed President Trump, their highest level of support for a Republican candidate across the last three presidential elections.

Most of these differences across political groups hold even after accounting for age, gender, income, immigrant generation and other factors.3

Jump to our detailed analysis on Hispanic identity across party lines and vote choice.

Distance from their family’s immigration experience is linked with how Hispanics understand their identity

How close Hispanics are to their family’s immigration experience shapes how they view their Hispanic identity. For example, Hispanic immigrants are more likely than U.S.-born Hispanics to say their Hispanic identity is extremely or very important to how they see themselves (71% vs. 54%).

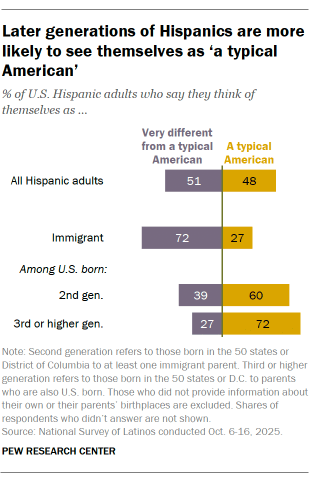
In addition, differences often extend across immigrant generations: 27% of Hispanic immigrants consider themselves “a typical American,” while 60% of second-generation and 72% of third- or higher-generation Hispanics say the same.

On the other hand, both Hispanic immigrants and U.S.-born Hispanics share a sense of connection to other Hispanics. About six-in-ten in both groups say what happens to Hispanics in the U.S. overall impacts what happens in their own lives a great deal or a fair amount (65% and 61%, respectively).

While the share of U.S. Hispanics who are immigrants has declined in recent decades, this group makes up about 42% of all Hispanic adults, according to estimates from the 2025 National Survey of Latinos. In the same survey, second-generation Hispanics – people born in the U.S. to at least one immigrant parent – account for 31% of Hispanic adults, while Hispanics who are third generation or higher represent 24%.4

Jump to our detailed analysis about how Hispanic immigrants and U.S.-born Hispanics view their Hispanic identity.

Hispanics use many labels to describe their identity

Hispanic identity in the U.S. is not expressed through a single label. Instead, Hispanics use a variety of labels to describe themselves, reflecting their diverse backgrounds. Among Hispanic adults:

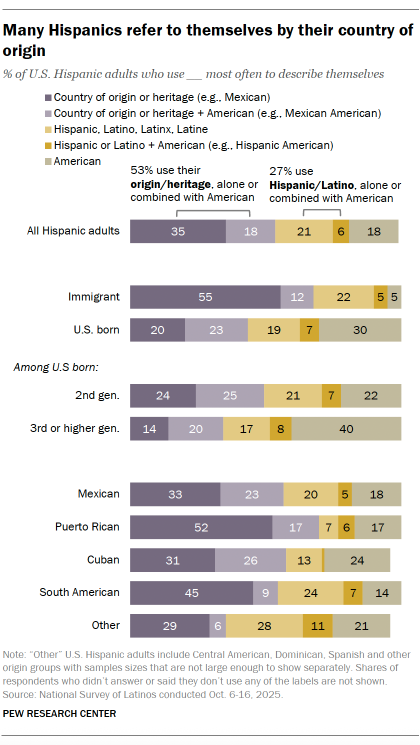
  • 53% most often use a label that reflects their country of origin or heritage – either on its own or combined with American (e.g., Mexican or Mexican American).
  • 27% most often use a pan-ethnic term – either alone or combined with American (e.g., Hispanic, Latino or Hispanic American).
  • 18% most often describe themselves as American.
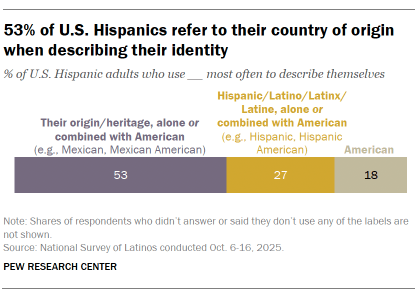
A bar chart showing 53% of U.S. Hispanics refer to their country of origin when describing their identity

The labels Hispanics use most often also vary by political affiliation, 2024 vote choice and immigrant generation.

Hispanics who voted for Trump in 2024 and those of third or higher immigrant generations are the two groups most likely to say they use American on its own most often when describing their identity (43% and 40%, respectively). 

By contrast, Hispanic Harris voters (54%) and Hispanic immigrants (67%) are more likely to most often describe themselves by their country of origin – either alone or combined with American.

Which pan-ethnic term do Hispanics prefer when referring to the Hispanic population?

Pew Research Center has frequently asked Hispanic adults which pan-ethnic term – Hispanic, Latino, Latinx or Latine – they prefer to describe people who are of Hispanic or Latino origin or descent.
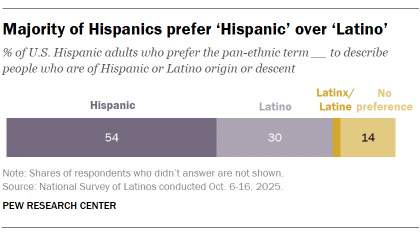
A bar chart showing Majority of Hispanics prefer ‘Hispanic’ over ‘Latino

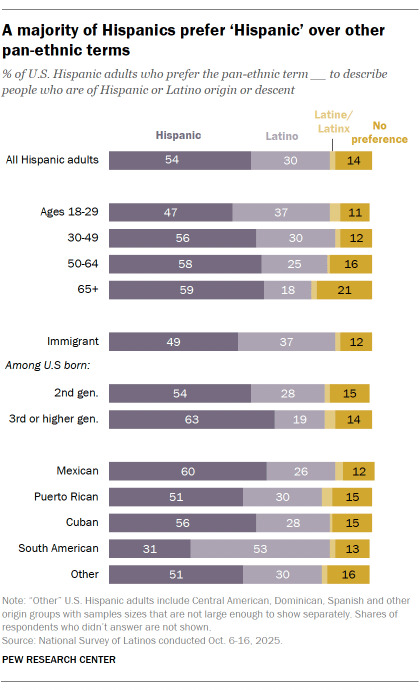
In line with previous studies, the October survey finds a majority of Hispanic adults say they prefer the term Hispanic (54%) over Latino (30%), while very few prefer Latinx (1%) or Latine (1%). Some 14% indicate no preference for any of these pan-ethnic terms.

Most groups, regardless of age, education, party affiliation and immigration background, prefer the pan-ethnic term Hispanic to Latino.

Jump to our detailed analysis about the different ways U.S. Hispanics express their identity.
The many ways U.S. Hispanics describe their identity

Key terms

The terms Hispanic and Latino are used interchangeably in this analysis.

U.S.-born people are those born in the 50 U.S. states and the District of Columbia, or those born in foreign countries to U.S. citizen parents.

Immigrants are U.S. residents born in foreign countries to parents who aren’t U.S. citizens.

Note: In this report, people born in Puerto Rico are considered immigrants. Although individuals born in Puerto Rico are U.S. citizens by birth, they are born into a Spanish-dominant culture. On many points, their attitudes, views and beliefs are much closer to Hispanics born abroad than to Hispanics born in the 50 states or D.C., even those who identify as being of Puerto Rican origin.

Second generation refers to U.S.-born people who have at least one immigrant parent.

Third or higher generation refers to U.S.-born people who have two U.S.-born parents.

Throughout this report, Democrats are respondents who identify with the Democratic Party or who identify as independent but lean toward the Democratic Party. Republicans are those who identify with the Republican Party or who identify as independent but lean toward the Republican Party.

Validated voters are adult citizens who told us in a postelection survey that they voted in a given general election and have a record of voting in a commercial voter file. Trump voters are validated voters who self-reported that they voted for Republican Donald Trump in the 2024 presidential election. Harris voters are validated voters who self-reported that they voted for Democrat Kamala Harris in the 2024 presidential election.

Nonvoters are those who did not vote in 2024 but were eligible to do so.

Country of origin or place of origin refers to the country or place that respondents’ families trace their heritage to. These terms are used interchangeably with similar expressions such as home country, family origins, family roots, ancestral origin and heritage.

Fifty years ago, Congress passed a law to improve data collection on people in the United States who have roots in Spanish-speaking countries – a group that came to be labeled “Hispanics” and “Latinos” in federal surveys and publications. The law was meant to help decision makers better understand the fast-growing Hispanic population, but it also grouped a diverse people under a single umbrella.

Today, Hispanics in the U.S. use a variety of labels to describe their identity, from pan-ethnic ones such as Hispanic and Latino to ancestry-based ones like Cuban American or Mexican. Some Hispanics use “American” on its own. Importantly, many Hispanics have used each of these terms at least once in their lives to describe themselves, highlighting the layers of U.S. Hispanic identity. At the same time, some terms are used more than others, reflecting the ways Hispanics understand and express who they are.

To better understand how Hispanics use, prioritize and think about identity labels, Pew Research Center conducted a bilingual survey among 4,923 Hispanic adults in October 2025. We asked respondents:

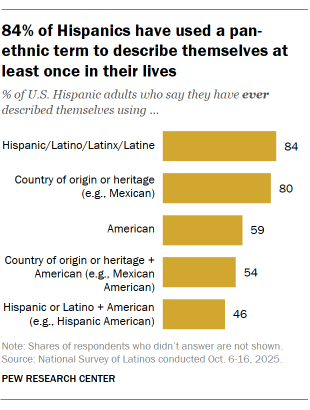
Which labels have they used at least once in their lives to describe themselves? Large majorities of Hispanic adults say they have ever used a pan-ethnic term such as Hispanic or Latino (84%) or their country of origin or heritage on its own – for example, Puerto Rican (80%) – to describe themselves.

Which label do they use most often to describe themselves? Hispanics do not point to a single dominant choice. However, the labels they use most often include their place of origin or heritage, either on its own (35%) or combined with American (18%) — for example, Salvadoran or Dominican American.  

Which pan-ethnic term – Hispanic, Latino, Latinx or Latine – do they prefer to describe people of Hispanic or Latino origin or descent? When labeling the entire U.S. Hispanic population, a majority say they prefer the term Hispanic (54%) over Latino (30%). Few say they prefer the terms Latinx or Latine, while 14% say they have no preference.

In addition, we asked respondents if they consider themselves “a typical American.” Hispanics are evenly divided on this.

Which labels Hispanics use – and how often they use them – also varies by immigrant generation and other demographic characteristics.

This analysis is part of a larger study about U.S. Latino identity. For a summary of the main findings, visit “U.S. Hispanics are divided on whether their identity helps or hurts them in America.”

Defining the U.S. Hispanic population

In 1976, the U.S. Congress passed Public Law 94-311. This legislation defined “Americans of Spanish origin or descent” as “Americans [who] identify themselves as being of Spanish-speaking background and trace their origin or descent from Mexico, Puerto Rico, Cuba, Central and South America, and other Spanish-speaking countries.” This includes around 20 Spanish-speaking nations from Latin America and Spain itself, but not Portugal or Portuguese-speaking Brazil. 

To implement this law, the U.S. Office of Management and Budget (OMB) in 1977 developed Statistical Policy Directive No. 15 (SPD 15), recommending that federal agencies measure race and ethnicity separately. In a 1997 revision, the OMB adopted “Hispanic or Latino” as the label for reporting federal statistics on this population. In a 2024 revision, OMB proposed combining the race and ethnicity questions into a single question. Read more about how the Census Bureau and federal agencies collect race and ethnicity data here.

Which labels have Hispanics used at least once in their lives to describe themselves?

A bar chart showing 84% of Hispanics have used a pan-ethnic term to describe themselves at least once in their lives

Some 84% of U.S. Hispanics say they have used a pan-ethnic term (such as Hispanic, Latino, Latinx or Latine) to describe themselves at least once in their lives. And 80% say they have ever used their family’s country of origin on its own (such as Mexican) to describe themselves.

Fewer have ever used other terms:

  • 59% of U.S. Hispanics have used the standalone term American to describe themselves at least once in their lives.
  • 54% have ever used their country of origin together with American (e.g., Mexican American).
  • 46% have ever used a pan-ethnic label combined with American (e.g., Hispanic American).

Which label do Hispanics use most often to describe themselves?

A bar chart showing Many Hispanics refer to themselves by their country of origin

There is wide variation in the identity labels Hispanic adults use most often to describe their identity.

Some use standalone labels (such as Cuban, Hispanic or American), while others use combined labels (such as Mexican American or Hispanic American).

  • 35% say they most often use a standalone label that references their country of origin or heritage (e.g., Cuban or Mexican).
  • 21% say they most often use a standalone pan-ethnic term (e.g., Hispanic or Latino).
  • 18% say they use the standalone label American.
  • 18% use their country of origin combined with American.
  • 6% use a pan-ethnic term combined with American.

Looking at it another way, 53% say their most-often-used label includes their origin country (either alone or combined with the term American), while 27% say their top label uses a pan-ethnic term (either alone or combined with the term American).

Place-of-origin labels have long been central for many Hispanics. In Center surveys of Hispanics since 2002, most have said they use labels that reference their or their family’s country or place of origin over other labels.5 In the October 2025 survey, Puerto Ricans are the origin group most likely to say they identify by their place of origin or heritage; 70% of U.S. Hispanics of Puerto Rican descent say they most often call themselves Puerto Rican, either alone or combined with American.

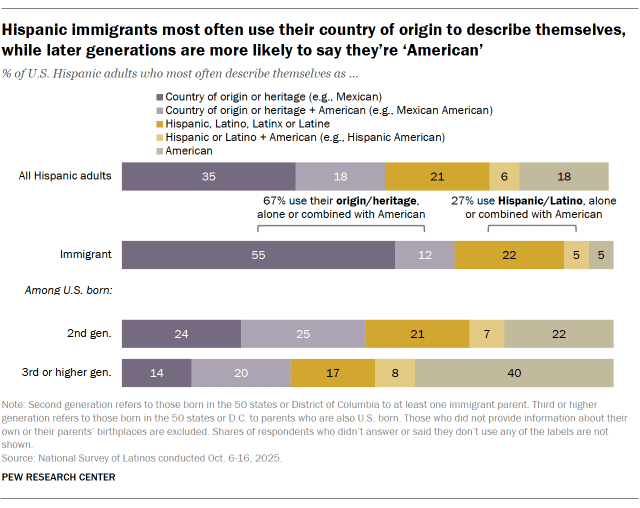
Label use also varies by immigrant generation. Among Hispanic adults born outside the U.S., around 67% use their country or place of origin – alone or combined with American – most often to describe themselves, a higher share than among second-generation (49%) or third- or higher-generation (34%) Hispanics. By contrast, third- or higher-generation Hispanics are more likely than other groups to say they most often use American by itself (40%). (Find our definitions of immigrant generations in the Key Terms section.)

Which pan-ethnic term do Hispanics prefer to describe people of Spanish descent?

A bar chart showing A majority of Hispanics prefer ‘Hispanic’ over other pan-ethnic terms

More than half of Hispanic adults say they prefer the pan-ethnic term Hispanic (54%) to describe the group of people who are of Hispanic or Latino origin or descent, while 30% prefer the term Latino. Few prefer the terms Latinx (1%) or Latine (1%). Meanwhile, 14% say they have no preference among these pan-ethnic terms.

There are differences by age, immigrant status and country of origin.

For example, Hispanic adults under 30 and Hispanic immigrants (those born outside the U.S.) are slightly less likely than their counterparts to say they prefer the term Hispanic.  

But generally speaking, in almost every group we analyzed, larger shares prefer Hispanic than prefer Latino.

Respondents of South American origin are an exception, with a majority who prefer Latino (53%) over Hispanic (31%).  

Historically, U.S. Hispanics overall have preferred the term Hispanic over the term Latino since the Center began studying this topic in the early 2000s. Percentages have fluctuated slightly depending on how surveys asked the question about pan-ethnic term preferences. They have changed little since the current question wording was introduced in 2023.

Hispanics are divided on whether they see themselves as a ‘typical American’

A bar chart showing About half of Hispanics say they think of themselves as ‘a typical American’

Since American is one of the labels Hispanics sometimes use to describe their identity, the survey also asked whether respondents consider themselves “a typical American.”

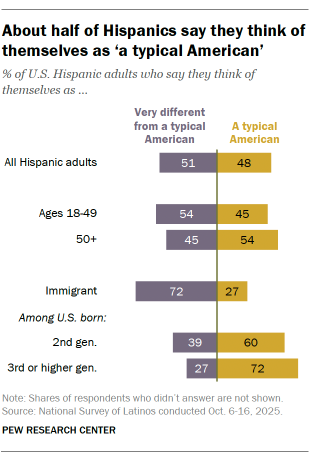
Hispanics are split on whether they see themselves as a typical American (48%) or very different from a typical American (51%).

  • Hispanics who are third or higher generation (72%) are more likely than second-generation Hispanics (60%) and much more likely than Hispanic immigrants (27%) to consider themselves a typical American.
  • Hispanics adults ages 50 and older (54%) are more likely to consider themselves a typical American than those under 50 (45%).

Even as a growing share of Hispanics are U.S.-born, Center telephone surveys of Hispanic adults since 2012 show that the share of Hispanics who see themselves as a typical American has changed little.6

Latino Trump voters are less likely than Harris voters to say being Latino is central to their lives

Key terms

The terms Hispanic and Latino are used interchangeably in this analysis.

U.S.-born people are those born in the 50 U.S. states and the District of Columbia, or those born in foreign countries to U.S. citizen parents.

Immigrants are U.S. residents born in foreign countries to parents who aren’t U.S. citizens.

Note: In this report, people born in Puerto Rico are considered immigrants. Although individuals born in Puerto Rico are U.S. citizens by birth, they are born into a Spanish-dominant culture. On many points, their attitudes, views and beliefs are much closer to Hispanics born abroad than to Hispanics born in the 50 states or D.C., even those who identify as being of Puerto Rican origin.

Second generation refers to U.S.-born people who have at least one immigrant parent.

Third or higher generation refers to U.S.-born people who have two U.S.-born parents.

Throughout this report, Democrats are respondents who identify with the Democratic Party or who identify as independent but lean toward the Democratic Party. Republicans are those who identify with the Republican Party or who identify as independent but lean toward the Republican Party.

Validated voters are adult citizens who told us in a postelection survey that they voted in a given general election and have a record of voting in a commercial voter file. Trump voters are validated voters who self-reported that they voted for Republican Donald Trump in the 2024 presidential election. Harris voters are validated voters who self-reported that they voted for Democrat Kamala Harris in the 2024 presidential election.

Nonvoters are those who did not vote in 2024 but were eligible to do so.

Country of origin or place of origin refers to the country or place that respondents’ families trace their heritage to. These terms are used interchangeably with similar expressions such as home country, family origins, family roots, ancestral origin and heritage.

Latino voters who supported President Donald Trump in 2024 differ from those who supported Democratic candidate Kamala Harris not only in their political views, but also in how central their Latino identity is to their lives. Across multiple measures, Trump voters are less likely to see their Latino background as central to who they are or as shaping their life experiences. By contrast, Harris voters see their identity as important to who they are and as consequential in their lives.

In the 2024 presidential election, nearly half of Latino voters backed Trump, his highest level of support from the group in his three presidential runs, according to a Pew Research Center validated voter analysis.

In addition to viewing Hispanic identity as less important in their lives, Hispanic Trump voters are more likely than Hispanic Harris voters to say:

  • Being Hispanic neither helps nor hurts their ability to get ahead in the United States.
  • What happens to other U.S. Hispanics has little impact on their own lives.
  • They feel little responsibility to look out for other Hispanics.

And Hispanic Trump voters are twice as likely as Latino Harris voters to most often describe themselves as “American” rather than as Hispanic, or by their family’s place of origin label (such as Cuban or Mexican).

These differences hold even after controlling for factors such as immigrant generation, income, religion, age, gender, political affiliation and the state where they live.

Differences in views of identity also exist between Latino Democrats and Latino Republicans, though to a lesser degree than those by 2024 vote choice.

Although many Hispanic Trump voters identify as Republicans, our analysis of 2024 validated voters shows the two groups are not the same – a distinction that also applies to Hispanic Harris voters and Hispanic Democrats. Even as Trump made gains among Hispanic voters from 2016 to 2024, the partisan composition of Hispanic adults changed little over the same period.

In this analysis, 2024 vote choice and party identification are examined side by side because each sheds light on how Hispanics think about identity, belonging and opportunity in the U.S.

Taken together, these findings suggest that Hispanic voters are not only divided politically, but also in how much their Hispanic background shapes how they see themselves and their place in U.S. society.

The October 2025 survey was conducted before subsequent changes in immigration enforcement and the economy, which may shape how U.S. Hispanics think about identity. Other questions from the same survey – including those about Hispanics’ views of the Trump administration and its immigration and economic policies – were published in November 2025.

This analysis is part of a larger study about U.S. Latino identity. For a summary of the main findings, visit “U.S. Hispanics are divided on whether their identity helps or hurts them in America.”

2024 vote choice, partisanship and the impact of being Latino in America

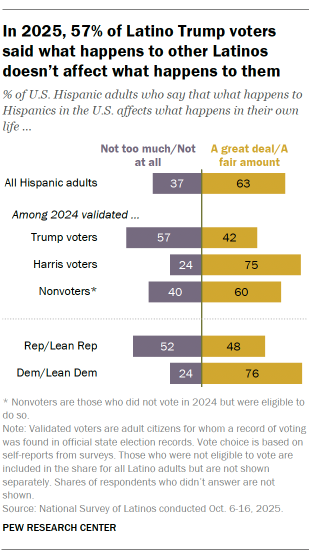
A bar chart showing In 2025, 57% of Latino Trump voters said what happens to other Latinos doesn’t affect what happens to them

A majority (57%) of Latino Trump voters say that what happens to Latinos in the U.S. affects what happens in their own lives not too much or not at all. By contrast, 75% of Latino Harris voters say that what happens to Latinos in the U.S. affects what happens in their own lives a great deal or a fair amount, according to the October survey.

Latino Trump voters also feel less obligated than Harris voters to look out for other U.S. Latinos. Some 61% Latinos who voted for Trump in 2024 say they never or not too often feel a sense of responsibility to look out for other Latinos in the U.S. By contrast, 20% of Harris voters say the same, while 48% say they feel this responsibility extremely or very often.  

There are similar patterns by partisan identity: Hispanics who are Republicans and Republican-leaning independents are less likely than Hispanic Democrats and Democratic leaners to say that what happens to other Hispanics in the U.S. affects what happens to them personally (48% vs. 76%, respectively), and less likely to say that they often feel a sense of responsibility to look out for other Hispanics (21% vs. 47%).

A bar chart showing In 2025, a majority of Trump voters said being Hispanic neither helps nor hurts them get ahead in America

There also are political divides on the extent to which Hispanic identity in the U.S. carries a cost or creates opportunity.

A majority of Hispanic Trump voters (57%) say that being Hispanic neither helps nor hurts their ability to get ahead in the U.S.

But among Hispanic Harris voters, 39% say being Hispanic hurts their ability to get ahead either a lot or a little, 23% say it helps a lot or a little, and 38% say it doesn’t make a difference. 

When asked if they have experienced discrimination in the year prior to the October survey, 15% of Hispanic Trump voters say they were discriminated against or were treated unfairly because of their Hispanic background by someone who is not Hispanic. More than twice as many Hispanic Harris voters (39%) say the same.

Similarly, Hispanic Trump voters are less likely than Hispanic Harris voters to say they were criticized for speaking Spanish in public (11% vs. 27%), that someone told them to go back to their home country (9% vs. 23%), or that they were called offensive names because they are Latino (12% vs. 24%).

Again, there are similar patterns by partisanship, though the gaps are less pronounced. Hispanic Republicans are more likely than Hispanic Democrats to say their Hispanic identity makes no difference in their ability to get ahead in the U.S. (47% vs. 32%). And Hispanic Republicans are less likely than Hispanic Democrats to say they’ve been discriminated against or treated unfairly because of their Hispanic background by someone who is not Hispanic (40% vs. 29%).

These differences remain even after accounting for demographic factors such as age, gender, income and immigrant generation. Even so, the survey cannot show whether differences are driven by vote choice or partisanship. Other unmeasured factors — such as skin color, the racial and ethnic makeup of one’s community, how often one speaks Spanish in public, or differences in how people perceive and report discrimination — may also influence how Hispanic identity is experienced in the U.S.

Hispanic Trump voters place less emphasis on their Hispanic identity than Hispanic Harris voters do

While most Latino Harris voters (69%) say being Latino is extremely or very important to how they think about themselves, less than half of Latino Trump voters (42%) say the same. Indeed, about three-in-ten Latino Trump voters say their Latino identity not too or not at all important, and roughly a quarter say it’s somewhat important.

A bar chart showing Being Latino is less important to Latino Republicans and Trump voters than it is to Latino Democrats and Harris voters

There’s a similar pattern by partisan identity: Hispanic Republicans are less likely than Hispanic Democrats to say Hispanic identity is important to how they think about themselves.

We also asked respondents which types of labels they most often use when referring to their identity in their daily lives. We offered five choices:

  • Hispanic, Latino, Latinx or Latine
  • Hispanic, Latino, Latinx or Latine + American (e.g., Hispanic American)
  • Country of origin or heritage (e.g., Mexican)
  • Country of origin or heritage + American (e.g., Mexican American)
  • American

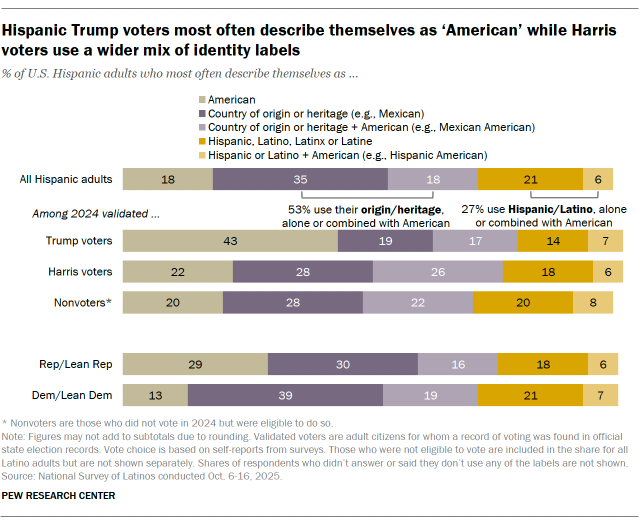
Among Latino Trump voters, American is the most common choice, with 43% in that group saying that is the label they use most often to describe themselves. Another 35% say they usually describe themselves using their country of origin or heritage – either alone or together with American.

By contrast, 54% of Latino Harris voters say they most often describe themselves using their country of origin (either alone or combined with American), while 22% say the label they use most often is American.

A bar chart showing Hispanic Trump voters most often describe themselves as ‘American’ while Harris voters use a wider mix of identity labels

There are differences by party on this question too, though they are not as pronounced as by vote choice. For example, 29% of Hispanic Republicans refer to themselves as American alone, while a similar share (30%) refer to themselves using their country of origin or heritage (e.g., Mexican). Meanwhile, 13% of Democrats say they use American most often, while 39% use their country of origin or heritage.7

On other identity questions measured in the survey, there are fewer differences between Hispanic Trump and Harris voters. Majorities in each group say they consider themselves “a typical American” (72% vs. 60%, respectively), and that they prefer the pan-ethnic label Hispanic over other pan-ethnic labels such as Latino, Latinx or Latine (64% vs. 54%). Jump to our more detailed analysis about the terms U.S. Latinos use to describe their identity.

Latino immigrants and U.S.-born Latinos differ on how much their identity shapes their lives

Key terms

The terms Hispanic and Latino are used interchangeably in this analysis.

U.S.-born people are those born in the 50 U.S. states and the District of Columbia, or those born in foreign countries to U.S. citizen parents.

Immigrants are U.S. residents born in foreign countries to parents who aren’t U.S. citizens.

Note: In this report, people born in Puerto Rico are considered immigrants. Although individuals born in Puerto Rico are U.S. citizens by birth, they are born into a Spanish-dominant culture. On many points, their attitudes, views and beliefs are much closer to Hispanics born abroad than to Hispanics born in the 50 states or D.C., even those who identify as being of Puerto Rican origin.

Second generation refers to U.S.-born people who have at least one immigrant parent.

Third or higher generation refers to U.S.-born people who have two U.S.-born parents.

Throughout this report, Democrats are respondents who identify with the Democratic Party or who identify as independent but lean toward the Democratic Party. Republicans are those who identify with the Republican Party or who identify as independent but lean toward the Republican Party.

Validated voters are adult citizens who told us in a postelection survey that they voted in a given general election and have a record of voting in a commercial voter file. Trump voters are validated voters who self-reported that they voted for Republican Donald Trump in the 2024 presidential election. Harris voters are validated voters who self-reported that they voted for Democrat Kamala Harris in the 2024 presidential election.

Nonvoters are those who did not vote in 2024 but were eligible to do so.

Country of origin or place of origin refers to the country or place that respondents’ families trace their heritage to. These terms are used interchangeably with similar expressions such as home country, family origins, family roots, ancestral origin and heritage.

For U.S. Latinos, the importance and meaning of identity are closely tied to how far they are from their family’s immigrant experience. Latinos born outside the United States (immigrants) are more likely than U.S.-born Latinos to say their Latino identity is central to who they are and to identify with their home country or ancestral heritage. Meanwhile, U.S.-born Latinos are more likely to emphasize their American identity.

These patterns hold across immigrant generations. Compared with Latino immigrants, second-generation Latinos (U.S. born to at least one immigrant parent) and third- or higher-generation Latinos (U.S. born to U.S.-born parents) are less likely to say their Latino identity is central to who they are, and more likely to describe themselves as American.

Still, majorities of both U.S.-born and immigrant Hispanics say that what happens to other Hispanics in the U.S. affects what happens in their own lives.

These findings come from Pew Research Center’s 2025 National Survey of Latinos, conducted Oct. 6-16, 2025, in English and Spanish among 4,923 Hispanic adults. At the time of the survey, about 42% of Hispanic adults were immigrants, 31% were second-generation Hispanics, and 24% were third- or higher-generation.

The survey was fielded as the Trump administration expanded immigration enforcement, including detaining or deporting large numbers of unauthorized Hispanic immigrants. An earlier report from the same survey found that Hispanic immigrants are more likely than U.S.-born Hispanics to express concern about their place in the U.S. and about deportations.

The U.S. Hispanic population has nearly doubled over the past two decades, from 35.3 million in 2000 to about 68 million people in 2024. Hispanics accounted for more than half of the nation’s population growth during that period, with immigration playing a major role. 

This analysis is part of a larger study about U.S. Latino identity. For a summary of the main findings, visit “U.S. Hispanics are divided on whether their identity helps or hurts them in America.”

Hispanic immigrants are more likely than U.S.-born Hispanics to say being Hispanic is important to their identity

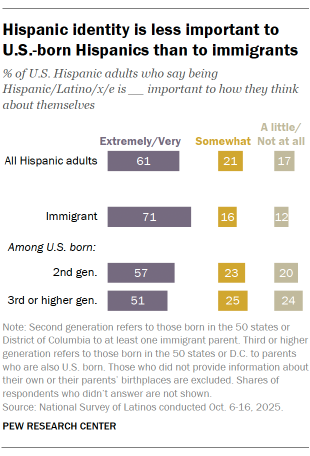
Most Latino immigrants (71%) consider being Latino extremely or very important to how they think about themselves. By contrast, fewer second-generation Latinos (57%) and those of third or higher generations (51%) feel that way. Despite these differences across immigrant generations, half or more in each group say their Latino identity is important to how they see themselves.

A bar chart showing Hispanic identity is less important to U.S.-born Hispanics than to immigrants

In addition, 70% of Hispanic immigrants consider their country of origin or heritage extremely or very important to how they think about themselves, a higher share than among Hispanics in the second and third or higher generations (57% and 47%, respectively).

Even as the importance of Hispanic identity declines across immigrant generations, majorities of Hispanic immigrants and U.S.-born Hispanics say that what happens to other Hispanics in the U.S. affects what happens to them personally. About two-thirds of immigrants (65%) say this, as do 67% of second-generation Hispanics and 55% of third- or higher-generation Hispanics.

We also specifically asked respondents whether they think that what happens to Latino immigrants affects their own lives. A majority of Latino immigrants (57%) say that what happens to Latino immigrants who live in the country legally affects their own lives a great deal or fair amount. And 64% of Latino immigrants say the same when it comes to what happens to Latino immigrants who live in the country illegally. Among Latinos born in the U.S., views are more divided. Roughly half of Latinos born in the U.S. say their lives are linked to the lives of Latino immigrants, whether those immigrants are in the country legally (47%) or illegally (51%).8

Regardless of how far respondents are from their family’s immigrant experience, relatively small shares feel responsible for other Hispanics. The same share of Hispanic immigrants and second-generation Hispanics (38% each) say they feel a responsibility to look out for other Hispanics extremely or very often, while 29% of third- or higher-generation Hispanics say the same.

U.S.-born Hispanics and Hispanic immigrants have similar views about how their identity shapes their ability to get ahead in the U.S.

  • 24% of Hispanic immigrants say being Hispanic helps their ability to get ahead a lot or a little, as do 29% of U.S.-born Hispanics.
  • 36% of Hispanic immigrants and 31% of U.S.-born Hispanics say being Hispanic hurts their ability to get ahead a lot or a little.
  • 40% of Hispanic immigrants and 39% of U.S.-born Hispanics say being Hispanic neither helps nor hurts their ability to get ahead.

Third-generation Latinos most likely to describe themselves as ‘American’

Hispanics use many labels to describe their identity. These range from labels that refer to country of origin or heritage (e.g., Mexican or Mexican American) to pan-ethnic labels (e.g., Latino or Hispanic American), to American. 

Despite widespread use of all these labels, some are used more often than others – and there are different patterns across immigrant generations.

For example, 5% of Latino immigrants say they most often refer to themselves as American alone, compared with 22% of second-generation Latinos and 40% of third-or higher-generation Latinos who do the same.

The pattern is reversed when it comes to labels that include one’s country of origin or heritage (either on its own or combined with American). While 67% of Latino immigrants say they most often use these kinds of labels, smaller shares of second-generation (49%) and third- or higher-generation (34%) Latinos say so.

A bar chart showing Hispanic immigrants most often use their country of origin to describe themselves, while later generations are more likely to say they’re ‘American’
A bar chart showing that Later generations of Hispanics are more likely to see themselves as ‘a typical American’

We also asked Hispanic adults whether they consider themselves “a typical American” or “very different from a typical American.” Just as with identity terms, there is a clear pattern across immigrant generations:

  • 27% of Hispanic immigrants consider themselves a typical American, a share that rises to 60% among second-generation Hispanics and 72% among third- or higher-generation Hispanics.
  • On the other hand, 72% of Hispanic immigrants say they are very different from a typical American. This share falls to 39% among second-generation Hispanics and 27% among third- or higher-generation Hispanics.

How Hispanic self-identification changes across immigrant generations

The findings in this story describe differences among U.S. adults who self-identify as Hispanic. However, not all U.S. adults with roots in Latin America or Spain self-identify as Hispanic.

The closer they are to their immigrant roots, the more likely adults with Hispanic ancestry are to self-identify as Hispanic, according to Pew Research Center estimates published in 2017. 

In that study, the vast majority of immigrants and second-generation adults with Hispanic ancestry self-identified as Hispanic (97% and 92%, respectively). Fewer adults in the third generation or fourth and higher generations did so (77% and 50%, respectively).

Appendix: Supplemental tables

Acknowledgments

This report was written by Gabriel Piña, senior researcher; Mark Hugo Lopez, director, race and ethnicity research; Sahana Mukherjee, associate director, race and ethnicity research; Dalia Fahmy, senior writer/editor; and Alexandra Cahn, research assistant.

Editorial guidance was provided by Steven Shepard, associate director, political research; and Hannah Hartig, senior researcher, political research.

Methodological guidance was provided by Courtney Kennedy, vice president, methods and innovation; Dorene Asare-Marfo, senior panel manager; Dana Popky, associate panel manager; Andrew Mercer, principal methodologist; and Arnold Lau, research methodologist. Guidance on the communications strategy and outreach was provided by Tanya Arditi, senior communications manager, with support from Maya Pottiger, communications associate.

The report was number-checked by Joseph Copeland, research analyst; and Carolyne Im, research analyst. Cahn and Piña provided research support. Sara Atske, digital producer, produced the report. Shifra Dayak, editorial specialist, copy edited the report. Charts were designed by Cahn and Piña, with guidance from John Carlo Mandapat, information graphics designer.

Find related reports online at https://alpha.pewresearch.org/pewresearch-org/topic/race-ethnicity/racial-ethnic-groups/hispanics-latinos/.

Methodology

The American Trends Panel survey methodology

Overview

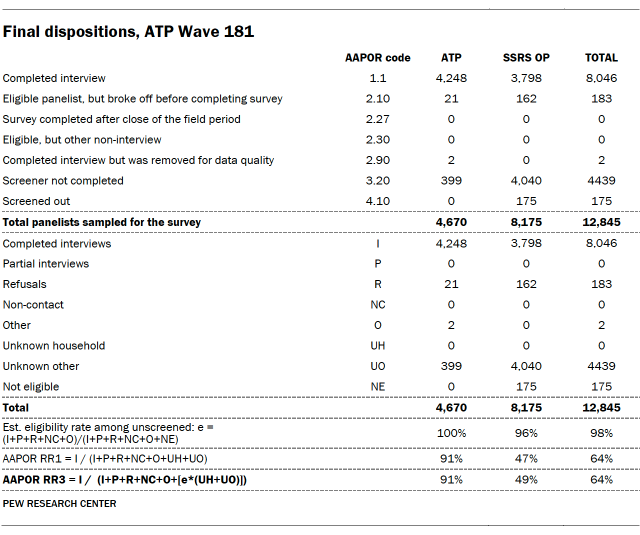
Data in this report comes from Wave 181 of the American Trends Panel (ATP), Pew Research Center’s nationally representative panel of randomly selected U.S. adults. The survey was conducted from Oct. 6 to Oct. 16, 2025. A total of 8,046 panelists responded out of 12,845 who were sampled, for a survey-level response rate of 64% (AAPOR RR3).9 This includes 4,248 respondents from the ATP and an additional 3,798 from the SSRS Opinion Panel.

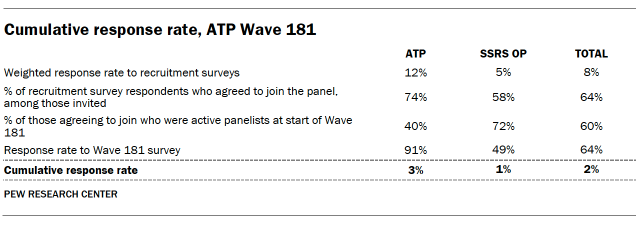
The cumulative response rate accounting for nonresponse to the recruitment surveys and attrition is 2%. The break-off rate among panelists who logged on to the survey and completed at least one item is 2%. The margin of sampling error for the full sample of 8,046 respondents is plus or minus 1.7 percentage points.

The survey includes oversamples of non-Hispanic Asian and Hispanic adults on the ATP in order to provide more precise estimates of the opinions and experiences of these smaller demographic subgroups. These oversampled groups are weighted back to reflect their correct proportions in the population.

SSRS conducted the survey for Pew Research Center via online (n=7,784) and live telephone (n=262) interviewing. Interviews were conducted in both English and Spanish.

To learn more about the ATP, read “About the American Trends Panel.”10

Panel recruitment

Since 2018, the ATP has used address-based sampling (ABS) for recruitment. A study cover letter and a pre-incentive are mailed to a stratified, random sample of households selected from the U.S. Postal Service’s Computerized Delivery Sequence File. This Postal Service file has been estimated to cover 90% to 98% of the population.11 Within each sampled household, the adult with the next birthday is selected to participate. Other details of the ABS recruitment protocol have changed over time but are available upon request.12 Prior to 2018, the ATP was recruited using landline and cellphone random-digit-dial surveys administered in English and Spanish.

A national sample of U.S. adults has been recruited to the ATP approximately once per year since 2014. In some years, the recruitment has included additional efforts (known as an “oversample”) to improve the accuracy of data for underrepresented groups. For example, Hispanic adults, Black adults and Asian adults were oversampled in 2019, 2022 and 2023, respectively.

Sample design

The overall target population for this survey was noninstitutionalized persons ages 18 and older living in the United States. It featured a stratified random sample from the ATP in which non-Hispanic Asian and Hispanic adults were selected with certainty. The remaining panelists were sampled at rates designed to ensure that the share of respondents in each stratum is proportional to its share of the U.S. adult population to the greatest extent possible. Respondent weights are adjusted to account for differential probabilities of selection as described in the Weighting section below.

The ATP was supplemented with a sample from the SSRS Opinion Panel (OP) of panelists who had previously identified as Hispanic. At the start of the survey, Opinion Panel respondents were asked a series of screening questions to confirm their eligibility, and were considered eligible if they indicated that they identified as Hispanic.

Questionnaire development and testing

The questionnaire was developed by Pew Research Center in consultation with SSRS. The web program used for online respondents was rigorously tested on both PC and mobile devices by the SSRS project team and Pew Research Center researchers. The SSRS project team also populated test data that was analyzed in SPSS to ensure the logic and randomizations were working as intended before launching the survey.

Incentives

All respondents were offered a post-paid incentive for their participation. Respondents could choose to receive the post-paid incentive in the form of a check or gift code to Amazon.com, Target.com or Walmart.com. Incentive amounts ranged from $5 to $20 for ATP respondents, and $5 to $10 for OP respondents, depending on whether the respondent belongs to a part of the population that is harder or easier to reach. Differential incentive amounts were designed to increase panel survey participation among groups that traditionally have low survey response propensities.

Data collection protocol

The data collection field period for this survey was Oct. 6 to Oct. 16, 2025. Surveys were conducted via self-administered web survey or by live telephone interviewing. 

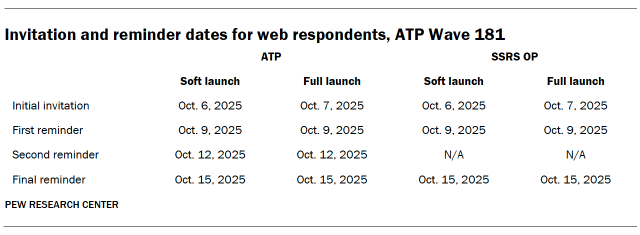
For panelists who take surveys online:13 Postcard notifications were mailed to a subset on Oct. 6.14 Survey invitations were sent out in two separate launches: soft launch and full launch. 801 panelists were included in the soft launch (60 from ATP, 741 from OP), which began with an initial invitation sent on Oct. 6. All remaining English- and Spanish-speaking sampled online panelists were included in the full launch and were sent an invitation on Oct. 7.

A table showing Invitation and reminder dates for web respondents, ATP Wave 181

Panelists participating online were sent an email invitation and up to three email reminders if they did not respond to the survey. ATP panelists who consented to SMS messages were sent an SMS invitation with a link to the survey and up to three SMS reminders.

For panelists who take surveys over the phone with a live interviewer: Prenotification postcards were mailed to ATP panelists on Oct. 3. Soft launch took place on Oct. 6 and involved dialing until a total of seven interviews had been completed (four ATP, three OP). All remaining English- and Spanish-speaking sampled phone panelists’ numbers were dialed throughout the remaining field period. Panelists who take surveys via phone can receive up to six calls from trained SSRS interviewers.

Data quality checks

To ensure high-quality data, Center researchers performed data quality checks to identify any respondents showing patterns of satisficing. This includes checking for whether respondents left questions blank at very high rates or always selected the first or last answer presented. As a result of this checking, two ATP respondents were removed from the survey dataset prior to weighting and analysis.

Weighting

The ATP data is weighted in a process that accounts for multiple stages of sampling and nonresponse that occur at different points in the panel survey process. First, each panelist begins with a base weight that reflects their probability of recruitment into the panel. Base weights for OP respondents were provided by SSRS. The base weights for ATP and OP respondents were combined and scaled to account for the sample design.

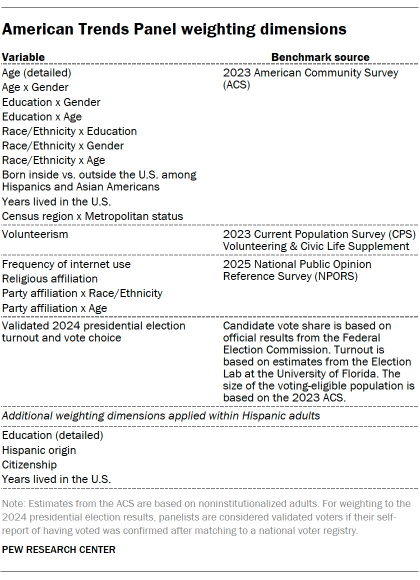
The combined weights were then calibrated to align with the population benchmarks in the accompanying table and trimmed at the 1st and 99.5th percentiles to reduce the loss in precision stemming from variance in the weights. Sampling errors and tests of statistical significance take into account the effect of weighting.

A table showing American Trends Panel weighting dimensions

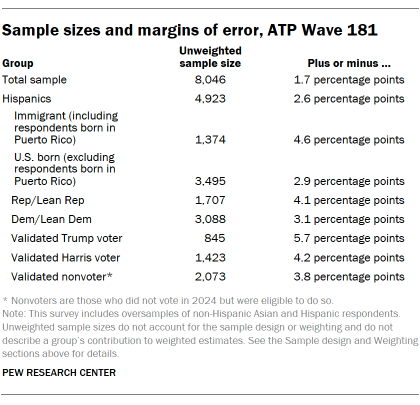
The following table shows the unweighted sample sizes and the error attributable to sampling that would be expected at the 95% level of confidence for different groups in the survey.

A table showing Sample sizes and margins of error, ATP Wave 181

Sample sizes and sampling errors for other subgroups are available upon request. In addition to sampling error, one should bear in mind that question wording and practical difficulties in conducting surveys can introduce error or bias into the findings of opinion polls.

Dispositions and response rates

A table showing Final dispositions, ATP Wave 181
A table showing Cumulative response rate, ATP Wave 181

How family income tiers are calculated

Family income data reported in this study is adjusted for household size and cost-of-living differences by geography. Panelists then are assigned to income tiers that are based on the median adjusted family income of all American Trends Panel members. The process uses the following steps:

  1. First, panelists are assigned to the midpoint of the income range they selected in a family income question that was measured on either the most recent annual profile survey or, for newly recruited panelists, their recruitment survey. This provides an approximate income value that can be used in calculations for the adjustment.
  2. Next, these income values are adjusted for the cost of living in the geographic area where the panelist lives. This is calculated using price indexes published by the U.S. Bureau of Economic Analysis. These indexes, known as Regional Price Parities (RPP), compare the prices of goods and services across all U.S. metropolitan statistical areas as well as non-metro areas with the national average prices for the same goods and services. The most recent available data at the time of the annual profile survey is from 2023. Those who fall outside of metropolitan statistical areas are assigned the overall RPP for their state’s non-metropolitan area.
  3. Next, these income values are adjusted for the cost of living in the geographic area where the panelist lives. This is calculated using price indexes published by the U.S. Bureau of Economic Analysis. These indexes, known as Regional Price Parities (RPP), compare the prices of goods and services across all U.S. metropolitan statistical areas as well as non-metro areas with the national average prices for the same goods and services. The most recent available data at the time of the annual profile survey is from 2023. Those who fall outside of metropolitan statistical areas are assigned the overall RPP for their state’s non-metropolitan area.
  4. Family incomes are further adjusted for the number of people in a household using the methodology from Pew Research Center’s previous work on the American middle class. This is done because a four-person household with an income of say, $50,000, faces a tighter budget constraint than a two-person household with the same income.
  5. Family incomes are further adjusted for the number of people in a household using the methodology from Pew Research Center’s previous work on the American middle class. This is done because a four-person household with an income of say, $50,000, faces a tighter budget constraint than a two-person household with the same income.
  6. Panelists are then assigned an income tier. “Middle-income” adults are in families with adjusted family incomes that are between two-thirds and double the median adjusted family income for the full ATP at the time of the most recent annual profile survey. The median adjusted family income for the panel is roughly $77,800. Using this median income, the middle-income range is about $51,900 to $155,600. Lower-income families have adjusted incomes less than $51,900 and upper-income families have adjusted incomes greater than $155,600 (all figures expressed in 2024 dollars and scaled to a household size of three). A panelist is assigned “no answer” in the income tier variable if they did not provide all three pieces of information needed to calculate their tier (family income, household size and residential address).

Two examples of how a given area’s cost-of-living adjustment was calculated are as follows: the Pine Bluff metropolitan area in Arkansas is a relatively inexpensive area, with a price level that is 19.7% less than the national average. The San Francisco-Oakland-Berkeley metropolitan area in California is one of the most expensive areas, with a price level that is 18.2% higher than the national average. Income in the sample is adjusted to make up for this difference. As a result, a family with an income of $40,200 in the Pine Bluff area is as well off financially as a family of the same size with an income of $59,100 in San Francisco. 

The respondents from the SSRS Opinion Panel oversample answered the same family income and household size questions, and their incomes were adjusted using the procedures detailed above. They were then assigned an income tier based on the median adjusted family income for the full ATP at the time of the most recent annual profile survey.