Pew Research Center

FOR RELEASE MARCH 26, 2025

Americans’ Views of Deportations

<em>Most say arrests of immigrants living in the U.S. illegally should be allowed at protests or in homes, but not at places of worship or schools</em>

BY Luis Noé-Bustamante and Jens Manuel Krogstad

FOR MEDIA OR OTHER INQUIRIES:

Communications Department
202.419.4372
www.pewresearch.org

RECOMMENDED CITATION

Pew Research Center, March 2025, "Americans’ Views of Deportations"

About Pew Research Center

Pew Research Center is a nonpartisan, nonadvocacy fact tank that informs the public about the issues, attitudes and trends shaping the world. It does not take policy positions. The Center conducts public opinion polling, demographic research, computational social science research and other data-driven research. It studies politics and policy; news habits and media; the internet and technology; religion; race and ethnicity; international affairs; social, demographic and economic trends; science; research methodology and data science; and immigration and migration. Pew Research Center is a subsidiary of The Pew Charitable Trusts, its primary funder.

© Pew Research Center 2026

Table of contents

  • About Pew Research Center
  • Americans’ Views of Deportations
  • 1. Views on deportations and arrests of immigrants in the U.S. illegally
  • 2. Personal impacts of deportations and arrests on U.S. adults   
  • Acknowledgments
  • Methodology

Americans’ Views of Deportations

<em>Most say arrests of immigrants living in the U.S. illegally should be allowed at protests or in homes, but not at places of worship or schools</em>

How we did this

Pew Research Center conducted this study to understand the American public’s views of immigration enforcement policies and the personal impact they have on U.S. adults.

For this analysis, we surveyed 5,123 adults from Feb. 24 to March 2, 2025. Everyone who took part in this survey is a member of the Center’s American Trends Panel (ATP), a group of people recruited through national, random sampling of residential addresses who have agreed to take surveys regularly. This kind of recruitment gives nearly all U.S. adults a chance of selection. Surveys were conducted either online or by telephone with a live interviewer. The survey is weighted to be representative of the U.S. adult population by gender, race, ethnicity, partisan affiliation, education and other factors. Read more about the ATP’s methodology.

Here are the questions used for this report, the topline and the survey methodology.

Terminology

The terms Hispanic and Latino are used interchangeably in this report.

Immigrant refers to people born outside of the 50 U.S. states, the District of Columbia, Puerto Rico or other U.S. territories.

U.S. born refers to people born in the 50 U.S. states, the District of Columbia, Puerto Rico or other U.S. territories.

As the new Trump administration begins to carry out immigration enforcement, Americans largely agree that at least some immigrants living in the United States illegally should be deported, in particular those who have committed violent crimes. However, less consensus exists on how the government should carry out deportations.

A bar chart showing that About a third of U.S. adults say all immigrants in the U.S. illegally should be deported; half say some

Roughly one-third of U.S. adults (32%) say all immigrants living in the country illegally should be deported, while 16% say none should be deported. About half (51%) say at least some should face deportation.

U.S. adults who say some immigrants living in the country illegally should be deported have varying views of who should be removed. Nearly all (97%) support deporting those who have committed violent crimes.

Those who favor some deportations are more evenly divided when it comes to deporting those who have committed nonviolent crimes (52%) or have arrived in the U.S. during the past four years (44%). By contrast, far fewer say those with family ties in the U.S. should be deported, according to a Pew Research Center survey of U.S. adults conducted Feb. 24 to March 2, 2025.

An opposing bar chart showing Most U.S. adults say immigration arrests should not be allowed in places of worship or schools

When it comes to law enforcement, the public has mixed views on where officers should and should not be allowed to arrest immigrants living in the U.S. illegally. Majorities of U.S. adults say immigration arrests should not take place in:

  • Places of worship (65%)
  • Schools (63%)
  • Hospitals (61%)

By contrast, majorities say arrests of immigrants in the U.S. illegally should be allowed in the following places:

  • Protests or rallies (66%)
  • Homes (63%)
  • Workplaces (54%)

Jump to Chapter 1 to read more on how different groups of Americans view deportations and where immigration arrests are acceptable.

Donald Trump signed several executive orders related to immigration after becoming president on Jan. 20. By the end of February, apprehensions at the U.S.-Mexico border had dropped to historically low levels, while deportations trailed those of the Biden administration.

In March, after the survey was conducted, Trump used the Alien Enemies Act of 1798 to deport hundreds of immigrants that his administration said were gang members living in the country illegally. The rarely used act allows the government, if at war, to deport immigrants without allowing them to go before a judge.

During the pandemic, migration to the U.S. stalled because governments around the world restricted travel. Since 2021, U.S. Border Patrol has recorded millions of encounters with migrants crossing into the U.S. from Mexico without authorization, with many seeking asylum. These encounters peaked in 2023 and dropped sharply in 2024.1

As of 2022, an estimated 11 million immigrants lived in the U.S. without authorization. This group includes those who do not have a green card or other lawful temporary residence visa or are not naturalized U.S. citizens.2 It also includes an estimated 1.2 million immigrants enrolled in Temporary Protected Status (TPS) and Deferred Action for Childhood Arrivals (DACA) who are temporarily protected from deportation and have a permit to work.

About 772,000 immigrants have received temporary protection through parole programs for Cubans, Haitians, Nicaraguans and Venezuelans (CHNV) and Ukrainians since 2022. However, the president can revoke these temporary protections. In late March, the Trump administration announced it will remove this deportation protection for the approximately 532,000 CHNV parolees.

Personal impact of deportations, immigration enforcement

Some U.S. adults express concern that they will be personally affected by the government’s immigration enforcement.

  • About one-in-five U.S. adults (19%) say they worry a lot or somewhat that they, a family member or close friend could be deported.
  • And 5% of adults say they are extremely or very worried they will be asked to prove their U.S. citizenship or immigration status during their regular day-to-day activities, while 8% say they are somewhat worried.
  • Notably, 42% of Hispanic adults say they are worried that they or someone close to them might be deported.
  • And 30% of immigrants say they worry that they might be asked for proof of their U.S. citizenship or immigration status.

Fewer adults also say that in the month prior to taking the survey, they made changes to their day-to-day lives due to worry over being questioned about their U.S. citizenship or immigration status.

  • 4% say they began to carry a document that proves their U.S. citizenship or immigration status (such as a passport, birth certificate, certificate of citizenship or naturalization certificate) during their daily activities.
  • 2% say they made changes in their daily schedule or routine due to worrying they might be asked to prove their U.S. citizenship or immigration status.
  • And 2% say they have avoided using public services (such as health care and law enforcement services) due to this worry.

Jump to Chapter 2 to read more about the personal impact of deportations on different groups of U.S. adults.

Partisan differences in views of immigration
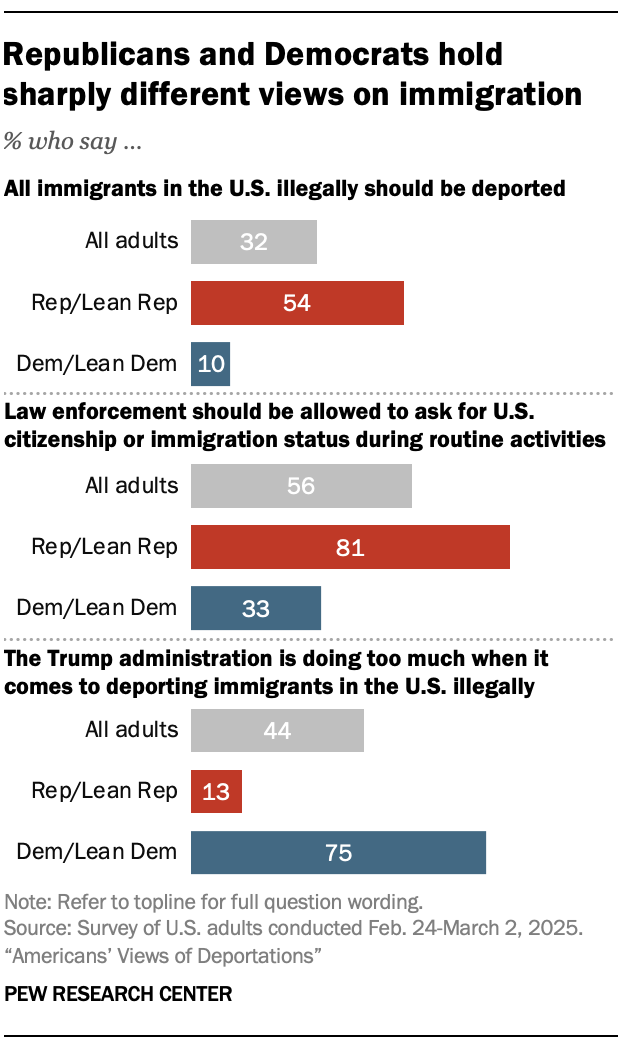
A bar chart showing that 54% of Republicans and Republican-leaning independents say all immigrants living in the country illegally should be deported, compared with 10% of Democrats and Democratic leaners

Stark partisan divides exist on views of immigration enforcement.

  • 54% of Republicans and Republican-leaning independents say all immigrants living in the country illegally should be deported, compared with 10% of Democrats and Democratic leaners.
  • 81% of Republicans say law enforcement officers should be allowed to check a person’s immigration status during routine activities like a traffic stop, while 33% of Democrats say the same.
  • 75% of Democrats say the Trump administration is doing too much when it comes to deporting immigrants living in the U.S. illegally, compared with 13% of Republicans.

There are also wide partisan differences on where arrests of immigrants living in the country illegally should be allowed.

  • 89% of Republicans compared with 44% of Democrats say arrests of immigrants in the country illegally should be allowed at protests or rallies.
  • 84% of Republicans say arrests should be allowed in people’s homes, compared with 44% of Democrats.
  • 52% of Republicans say arrests should be allowed at places of worship, while 15% of Democrats say so.

1. Views on deportations and arrests of immigrants in the U.S. illegally

This chapter explores Americans’ views on which groups of immigrants who are in the country illegally should be deported, where arrests should be allowed, and whether police should be able to check a person’s immigration status.

Views on whether immigrants living in the country illegally should be deported

A bar chart showing that Majorities of U.S. adults across demographic groups say immigrants in the country illegally should be deported

About half of U.S. adults (51%) say some immigrants living in the country illegally should be deported, compared with 32% who say all should be deported. Some 16% say none should be deported.

By political party
  • Nearly all Republicans and Republican-leaning independents (96%) say at least some immigrants living in the country illegally should be deported, compared with 71% of Democrats and Democratic leaners.
  • A far larger share of Republicans (54%) than Democrats (10%) say all immigrants in the country illegally should be deported.
By race and ethnicity
  • Similar shares of White (87%) and Asian (86%) adults say at least some immigrants living in the country illegally should be deported. Lower shares of Black (75%) and Hispanic (72%) adults say so.
  • However, White adults (39%) are more likely than Asian (22%), Black (19%) or Hispanic (16%) adults to say all immigrants in the country illegally should be deported.

Views on which groups of immigrants living in the country illegally should be deported

A bar chart showing that Among U.S. adults who favor ‘some’ deportations, nearly all say immigrants in the country illegally who have committed violent crimes should be deported

Among U.S. adults who say some immigrants living in the country illegally should be deported, nearly everyone supports deporting those who have committed violent crimes.

However, views vary among these Americans on whether immigrants living in the country illegally should be deported if they have committed nonviolent crimes or if they have arrived in the U.S. during the last four years.

Here are views by different demographic groups among U.S. adults who say some immigrants living in the country illegally should be deported:

By political party
  • A greater share of Republicans than Democrats who favor some deportations say immigrants living in the country illegally should be deported if they have committed nonviolent crimes (67% vs. 42%) or have arrived in the last four years (63% vs. 32%). When it comes to those who have committed violent crimes, nearly all Republicans and Democrats (97% each) say this group should be deported.
By race and ethnicity
  • Most White (59%) and Asian (60%) adults who support some deportations say immigrants living in the country illegally should be deported if they have committed nonviolent crimes. By contrast, lower shares of Hispanic (43%) and Black (34%) adults say this.
  • Roughly half or fewer of White (48%), Asian (43%), Hispanic (41%) and Black (34%) adults say immigrants living in the country illegally should be deported if they have arrived in the U.S. during the last four years.

The survey also asked about whether other groups of immigrants in the country illegally should be deported. Relatively few Americans support deporting these immigrants if they have a job (15%), are parents of children born in the U.S. (14%), came to the U.S. as children (9%) or are married to a U.S. citizen (5%).

Views on where arrests of immigrants living in the country illegally should be allowed

A bar chart showing that Views vary on where law enforcement should be allowed to make arrests of immigrants living in the country illegally

A majority of U.S. adults say law enforcement should be allowed to arrest immigrants living in the country illegally at protests or rallies, in their homes or in their workplaces.

By political party
  • 89% of Republicans say arrests of immigrants living in the country illegally should be allowed at protests or rallies, compared with 44% of Democrats.
  • Republicans and Democrats hold starkly different views on whether arrests of these immigrants should be allowed in their homes (84% vs. 44%).
By race and ethnicity
  • Hispanics are the only racial or ethnic group where fewer than half say arrests of immigrants in the country illegally should be allowed in their homes (38%).
  • Roughly a third of Black (35%) and Hispanic (32%) adults say arrests at workplaces should be allowed, a lower share than for White and Asian adults.
  • About half or more of all racial or ethnic groups say law enforcement should be allowed to make arrests at protests or rallies.
By nativity
  • A majority of U.S.-born and immigrant adults (69% vs. 55%) say arrests of immigrants living in the country illegally should be allowed at protests or rallies.
  • U.S.-born adults are more likely than immigrants to say arrests should be allowed in homes (67% vs. 46%) and in workplaces (57% vs. 36%).

The survey also asked about whether immigration arrests should be allowed in other places. Fewer than half of Americans say arrests should be allowed in hospitals (37%), schools (35%) or places of worship (33%).

Views on whether police should be able to check for immigration status

A bar chart showing that 56% of U.S. adults say police should be allowed to check immigration status during daily activities like traffic stops

A slim majority of U.S. adults say law enforcement should be able to check a person’s immigration status during daily activities like traffic stops. Overall, 56% say this should be allowed while 43% say it should not.

By political party
  • Republicans (81%) are far more likely than Democrats (33%) to say law enforcement should be allowed to check for a person’s immigration status during daily activities like traffic stops.
By nativity
  • Those born in the U.S. are more likely than immigrants (60% vs. 36%) to say law enforcement should be allowed to check for immigration status.
By race and ethnicity
  • 66% of White adults say police should be allowed to check for immigration status.
  • By contrast, roughly half or fewer of Asian (45%), Black (42%) and Hispanic (35%) adults say so.
By age

U.S. adults under age 50 are less likely than those 50 and older to say law enforcement should be able to check a person’s immigration status during daily activities.

2. Personal impacts of deportations and arrests on U.S. adults   

This chapter explores whether U.S. adults worry about being asked to prove their U.S. citizenship or immigration status during their daily routine and if they believe deportations of immigrants living in the United States illegally will make their lives better or worse.

Do people worry they or someone close to them might be deported?

About one-in-five U.S. adults (19%) say they worry a lot or some that they, a family member or a friend could be deported.

By nativity
  • One-in-three immigrants in the country worry they or someone close to them could be deported.
  • By comparison, 16% of U.S.-born adults share this worry.
By race and ethnicity
  • 42% of Latinos say they worry they or someone close to them might be deported.3
  • By contrast, 19% of Black and Asian adults and 12% of White adults say they worry they, a family member or close friend might be deported.
By age
  • About one-in-four adults ages 18 to 29 (25%) and ages 30 to 49 (24%) say they worry they or someone close to them could be deported.
  • Fewer ages 50 to 64 (14%) or 65 and older (11%) share this worry.
By political party
  • 27% of Democrats and Democratic-leaning independents worry they or someone close them might be deported.
  • A lower share of Republicans and Republican leaners (10%) say the same.

Do people worry about being asked to prove their citizenship or immigration status during their daily routine?

A bar chart showing that About 3 in 10 Latinos and immigrants worry about being asked to prove their U.S. citizenship or immigration status

Some 13% of U.S. adults say they are at least somewhat worried about being asked to prove their U.S. citizenship or immigration status during their day-to-day activities, including 5% who say they are extremely or very worried.

By nativity
  • 30% of U.S. immigrants say they are worried about being asked to prove their U.S. citizenship or immigration status during their daily activities, higher than the share among U.S.-born adults (9%). 
By race and ethnicity
  • 31% of U.S. Latinos say they worry about being asked to prove their citizenship or immigration status in the country, while 24% of Asian adults and 20% of Black adults say the same.
  • By contrast, 5% of White adults share this worry. 
By age
  • 19% of adults ages 18 to 29 worry about being asked to prove their U.S. citizenship or immigration status during their regular activities.
  • Fewer adults 65 and older (6%) share this worry.
By political party
  • 19% of Democrats say they worry at least somewhat about being asked to prove their U.S. citizenship or immigration status during their daily routine.
  • By comparison, 7% of Republicans share this worry.

Have people made recent changes in their lives due to worry they will be asked about their citizenship or immigration status?

Some U.S. adults say that in the month prior to taking the survey, they made changes in their day-to-day lives due to worry of being asked about their U.S. citizenship or immigration status.

  • 4% say they began to carry a document that proves their U.S. citizenship or immigration status (such as a passport, birth certificate, certificate of citizenship or naturalization certificate) during their daily activities.
  • 2% made changes in their daily schedule or routine.

In addition, some groups are more likely than U.S. adults overall to say they began to carry a document that proves their U.S. citizenship or immigration status.

  • Latinos (12%) are more likely than White (1%), Black (4%) or Asian (7%) adults to say they recently started carrying a document that proves their status in the country.
  • Immigrants (12%) are more likely than those who are U.S. born (2%) to say they recently began to carry such documents.

Do people believe deportations will impact prices in their communities?

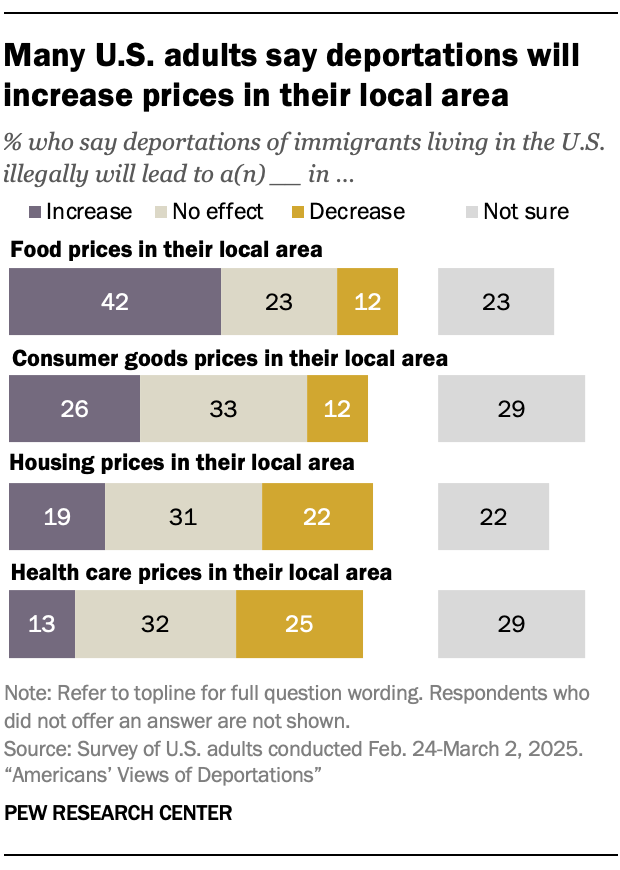
When asked about the potential effects deportations of immigrants in the country illegally might have on prices in their local area, 42% of U.S. adults say it will lead to a rise in food prices, while 23% say it will have no effect and 23% are not sure.

A bar chart showing that Many U.S. adults say deportations will increase prices in their local area

Lower shares say deportations will increase prices of other things in their area.

  • 26% of U.S. adults say consumer goods prices will increase in their area, while 33% say deportations will have no effect.
  • 19% say housing prices will increase due to deportations, whereas 31% say they will have no effect and 22% say housing prices in their local area will fall due to deportations.
  • 13% say health care prices will increase in their area. By contrast, 32% say deportations will have no effect on these prices and 25% say prices will decrease.

Democrats are more likely than Republicans to say local prices will increase in all these sectors due to deportations of immigrants in the country illegally. For example, most Democrats (64%) say food prices will increase due to deportations, while 19% of Republicans say the same. 

Immigrants living in the country illegally make up about 4.8% of the U.S. workforce and account for a larger share of workers in the agriculture, construction and service sectors. Other research has shown that deporting workers in these sectors has the potential to drive up food prices.

Do U.S. adults believe deportations will have a positive or negative impact in their lives?

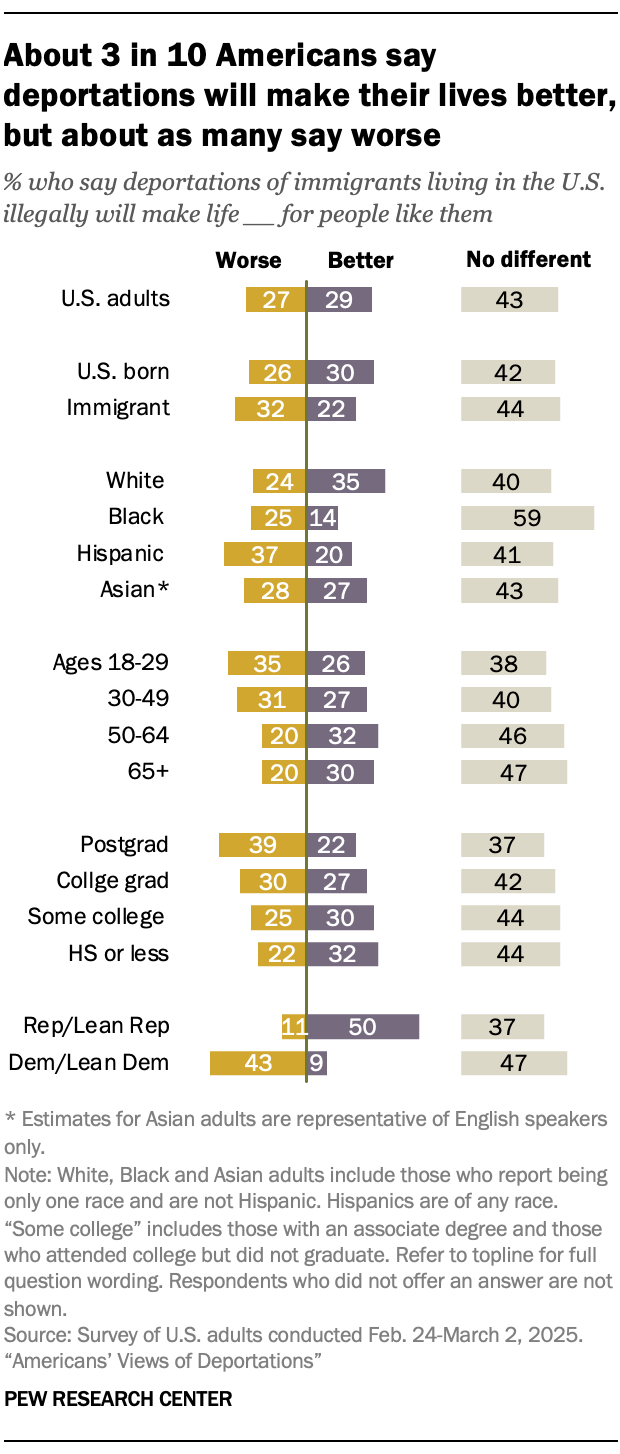
A bar chart showing that About 3 in 10 Americans say deportations will make their lives better, but about as many say worse

About as many U.S. adults say deportations of immigrants living in the country illegally will make their lives better (29%) as say they will make their lives worse (27%). More (43%) say deportations will make no difference in their lives. 

Still, differences in the shares who say deportations will make life better or worse do emerge among some groups. 

By race and ethnicity
  • 37% of Hispanic adults say deportations of immigrants living in the U.S. illegally will make their lives worse. 
  • By comparison, lower shares of White (24%), Black (25%) and Asian (28%) adults say the same.
By age
  • 35% of those ages 18 to 29 say deportations will make their lives worse.
  • By contrast, 20% of those 50 and older say deportations will make their lives worse.
By political party 
  • 43% of Democrats say deportations will make their lives worse and 9% say they will make their lives better.
  • By contrast, half of Republicans say deportations will make their lives better and 11% say they will make their lives worse.

Acknowledgments

This report was written by Luis Noe-Bustamante, research associate, and Jens Manuel Krogstad, senior writer/editor.

Editorial guidance was provided by Mark Hugo Lopez, director, race and ethnicity research; Sahana Mukherjee, associate director, race and ethnicity research; and Jocelyn Kiley, director, political research. The report was reviewed by Neha Sahgal, vice president, research; and Rachel (Weisel) Drian, associate director, communications. Guidance on the communications strategy and outreach was provided by Tanya Arditi, senior communications manager, with support from Talia Price, communications associate.

The report was number-checked by Alex Cahn, research assistant, and Gracie Martinez, research assistant. Sara Atske, digital producer, produced the report. David Kent, senior copy editor, copy edited the report. Charts were designed by Noe-Bustamante and Krogstad, with guidance from John Carlo Mandapat, information graphics designer.

Find related reports online at https://alpha.pewresearch.org/pewresearch-org/topic/immigration-migration/.

Methodology

The American Trends Panel survey methodology

Overview

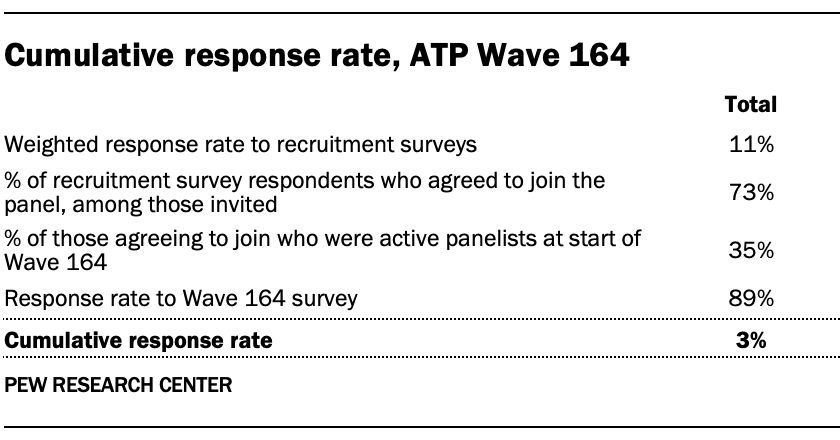
Data in this report comes from Wave 164 of the American Trends Panel (ATP), Pew Research Center’s nationally representative panel of randomly selected U.S. adults. The survey was conducted from Feb. 24 to March 2, 2025. A total of 5,123 panelists responded out of 5,737 who were sampled, for a survey-level response rate of 89%.

The cumulative response rate accounting for nonresponse to the recruitment surveys and attrition is 3%. The break-off rate among panelists who logged on to the survey and completed at least one item is 1%. The margin of sampling error for the full sample of 5,123 respondents is plus or minus 1.5 percentage points.

The survey includes an oversample of non-Hispanic Asian adults in order to provide more precise estimates of the opinions and experiences of these smaller demographic subgroups. These oversampled groups are weighted back to reflect their correct proportions in the population.

SSRS conducted the survey for Pew Research Center via online (n=4,939) and live telephone (n=184) interviewing. Interviews were conducted in both English and Spanish.

To learn more about the ATP, read “About the American Trends Panel.”

Panel recruitment

Since 2018, the ATP has used address-based sampling (ABS) for recruitment. A study cover letter and a pre-incentive are mailed to a stratified, random sample of households selected from the U.S. Postal Service’s Computerized Delivery Sequence File. This Postal Service file has been estimated to cover 90% to 98% of the population.4 Within each sampled household, the adult with the next birthday is selected to participate. Other details of the ABS recruitment protocol have changed over time but are available upon request.5 Prior to 2018, the ATP was recruited using landline and cellphone random-digit-dial surveys administered in English and Spanish. A national sample of U.S. adults has been recruited to the ATP approximately once per year since 2014. In some years, the recruitment has included additional efforts (known as an “oversample”) to improve the accuracy of data for underrepresented groups. For example, Hispanic adults, Black adults and Asian adults were oversampled in 2019, 2022 and 2023, respectively.

Sample design

The overall target population for this survey was noninstitutionalized persons ages 18 and older living in the United States. It featured a stratified random sample from the ATP in which non-Hispanic Asian adults were selected with certainty. The remaining panelists were sampled at rates designed to ensure that the share of respondents in each stratum is proportional to its share of the U.S. adult population to the greatest extent possible. Respondent weights are adjusted to account for differential probabilities of selection as described in the Weighting section below.

Questionnaire development and testing

The questionnaire was developed by Pew Research Center in consultation with SSRS. The web program used for online respondents was rigorously tested on both PC and mobile devices by the SSRS project team and Pew Research Center researchers. The SSRS project team also populated test data that was analyzed in SPSS to ensure the logic and randomizations were working as intended before launching the survey.

Incentives

All respondents were offered a post-paid incentive for their participation. Respondents could choose to receive the post-paid incentive in the form of a check or gift code to Amazon.com, Target.com or Walmart.com. Incentive amounts ranged from $5 to $20 depending on whether the respondent belongs to a part of the population that is harder or easier to reach. Differential incentive amounts were designed to increase panel survey participation among groups that traditionally have low survey response propensities.

Data collection protocol

The data collection field period for this survey was Feb. 24 to March 2, 2025. Surveys were conducted via self-administered web survey or by live telephone interviewing. 

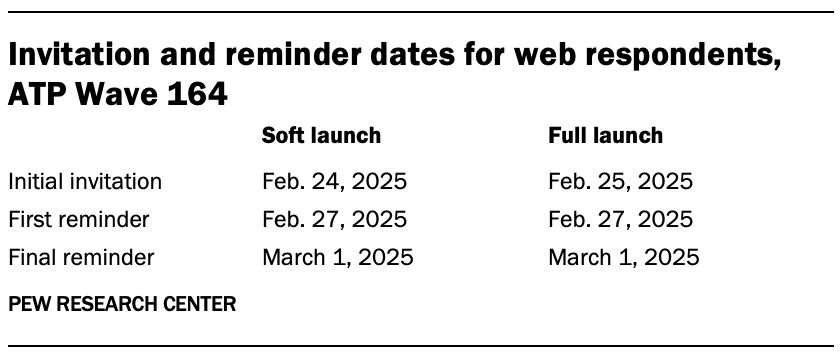
For panelists who take surveys online:6 Postcard notifications were mailed to a subset on Feb. 24.7 Survey invitations were sent out in two separate launches: soft launch and full launch. Sixty panelists were included in the soft launch, which began with an initial invitation sent on Feb. 24. All remaining English- and Spanish-speaking sampled online panelists were included in the full launch and were sent an invitation on Feb 25.

A table showing Invitation and reminder dates for web respondents for ATP Wave 164

Panelists participating online were sent an email invitation and up to two email reminders if they did not respond to the survey. ATP panelists who consented to SMS messages were sent an SMS invitation with a link to the survey and up to two SMS reminders.

For panelists who take surveys over the phone with a live interviewer: Prenotification postcards were mailed on Feb. 21, 2025. Soft launch took place on Feb. 24, 2025, and involved dialing until a total of three interviews had been completed. All remaining English- and Spanish-speaking sampled phone panelists’ numbers were dialed throughout the remaining field period. Panelists who take surveys via phone can receive up to six calls from trained SSRS interviewers.

Data quality checks

To ensure high-quality data, Center researchers performed data quality checks to identify any respondents showing patterns of satisficing. This includes checking for whether respondents left questions blank at very high rates or always selected the first or last answer presented. As a result of this checking, two ATP respondents were removed from the survey dataset prior to weighting and analysis.

Weighting

The ATP data is weighted in a process that accounts for multiple stages of sampling and nonresponse that occur at different points in the panel survey process. First, each panelist begins with a base weight that reflects their probability of recruitment into the panel. These weights are then calibrated to align with the population benchmarks in the accompanying table to correct for nonresponse to recruitment surveys and panel attrition. If only a subsample of panelists was invited to participate in the wave, this weight is adjusted to account for any differential probabilities of selection.

Among the panelists who completed the survey, this weight is then calibrated again to align with the population benchmarks identified in the accompanying table and trimmed at the 1st and 99th percentiles to reduce the loss in precision stemming from variance in the weights. Sampling errors and tests of statistical significance take into account the effect of weighting.

A table showing American Trends Panel weighting dimensions

The following table shows the unweighted sample sizes and the error attributable to sampling that would be expected at the 95% level of confidence in the survey.

A table showing Sample size and margin of error, ATP Wave 164

Sample sizes and sampling errors for other subgroups are available upon request. In addition to sampling error, one should bear in mind that question wording and practical difficulties in conducting surveys can introduce error or bias into the findings of opinion polls.

Dispositions and response rates

A table showing Final dispositions, ATP Wave 164
A table showing Cumulative response rate for ATP Wave 164