Pew Research Center

FOR RELEASE MAY 8, 2023

Diverse Cultures and Shared Experiences Shape Asian American Identities

About six-in-ten feel connected to other Asians in the U.S.

BY Neil G. Ruiz, Luis Noé-Bustamante and Sono Shah

FOR MEDIA OR OTHER INQUIRIES:

Communications Department
202.419.4372
www.pewresearch.org

RECOMMENDED CITATION

Pew Research Center, May 2023, "Diverse Cultures and Shared Experiences Shape Asian American Identities"

About Pew Research Center

Pew Research Center is a nonpartisan, nonadvocacy fact tank that informs the public about the issues, attitudes and trends shaping the world. It does not take policy positions. The Center conducts public opinion polling, demographic research, computational social science research and other data-driven research. It studies politics and policy; news habits and media; the internet and technology; religion; race and ethnicity; international affairs; social, demographic and economic trends; science; research methodology and data science; and immigration and migration. Pew Research Center is a subsidiary of The Pew Charitable Trusts, its primary funder.

© Pew Research Center 2026

Table of contents

  • About Pew Research Center
  • Diverse Cultures and Shared Experiences Shape Asian American Identities
  • 1. Asian identity in the U.S.
  • 2. Asian Americans and life in America
  • Acknowledgments
  • Methodology
  • Appendix: Demographic profile of Asian American adults

Diverse Cultures and Shared Experiences Shape Asian American Identities

About six-in-ten feel connected to other Asians in the U.S.

How we did this

Pew Research Center conducted this analysis to understand the rich diversity of people of Asian origin or ancestry living in the United States and their views of identity. The study is part of the Center’s multiyear, comprehensive, in-depth quantitative and qualitative research effort focused on the nation’s Asian population. Its centerpiece is this nationally representative survey of 7,006 Asian adults exploring the experiences, attitudes and views of Asians living in the U.S. The survey sampled U.S. adults who self-identify as Asian, either alone or in combination with other races or Hispanic ethnicity. It was offered in six languages: Chinese (Simplified and Traditional), English, Hindi, Korean, Tagalog and Vietnamese. Responses were collected from July 5, 2022, to Jan. 27, 2023, by Westat on behalf of Pew Research Center.

The Center recruited a large sample to examine the diversity of the U.S. Asian population, with oversamples of the Chinese, Filipino, Indian, Korean and Vietnamese populations. These are the five largest origin groups among Asian Americans. The survey also includes a large enough sample of self-identified Japanese adults, making findings about them reportable. In this report, the six largest ethnic groups include those who identify with one Asian ethnicity only, either alone or in combination with a non-Asian race or ethnicity. Together, these six groups constitute 81% of all U.S. Asian adults, according to a Pew Research Center analysis of the Census Bureau’s 2021 American Community Survey (ACS), and are the six groups whose attitudes and opinions are highlighted throughout the report. Survey respondents were drawn from a national sample of residential mailing addresses, which included addresses from all 50 states and the District of Columbia. Specialized surnames list frames maintained by the Marketing Systems Group were used to supplement the sample. Those eligible to complete the survey were offered the opportunity to do so online or by mail with a paper questionnaire. For more details, see the Methodology. For questions used in this analysis, see the Topline Questionnaire.

The survey research plan and questionnaire were reviewed and approved by Westat’s institutional review board (IRB), which is an external and independent committee of experts specializing in protecting the rights of research participants.

Even though the U.S. Asian population was the fastest growing racial and ethnic group in the country from 2000 to 2019, it is still a relatively small population. According to the 2021 American Community Survey, the country’s Asian population constitutes 7% of the U.S. population (of all ages) and 7% of adults (those ages 18 and older).

Pew Research Center designed this study with these details in mind to be as inclusive as possible of the diversity of Asian American experiences. Even so, survey research is limited when it comes to documenting the views and attitudes of the less populous Asian origin groups in the U.S. To address this, the survey was complemented by 66 pre-survey focus groups of Asian adults, conducted from Aug. 4 to Oct. 14, 2021, with 264 recruited participants from 18 Asian origin groups. Focus group discussions were conducted in 18 different languages and moderated by members of their origin groups.

Findings for less populous Asian origin groups in the U.S., those who are not among the six largest Asian origin groups, are grouped under the category “Other” in this report and are included in the overall Asian adult findings in the report. These ethnic origin groups each make up about 2% or less of the Asian population in the U.S., making it challenging to recruit nationally representative samples for each origin group. The group “Other” includes those who identify with one Asian ethnicity only, either alone or in combination with a non-Asian race or Hispanic ethnicity. Findings for those who identify with two or more Asian ethnicities are not presented by themselves in this report but are included in the overall Asian adult findings.

To learn more about how members of less populous Asian origin groups in the U.S. identify, see the quote sorter based on our focus group discussions. There, you can read how participants describe their identity in their own words.

For this analysis, an additional national survey of 5,132 U.S. adults was conducted from Dec. 5 to 11, 2022, using Pew Research Center’s American Trends Panel. The survey of U.S. adults was conducted in English and Spanish. Respondents are recruited through national, random sampling of residential addresses.

Pew Research Center has conducted multiple studies that focus on Asian Americans. Previous demographic studies examined the diversity of origins, key facts, and rising income inequality among Asians living in the U.S. and key findings about U.S. immigrants. Qualitative studies have focused on what it means to be Asian in America as well as barriers to English language learning among Asian immigrants. Previous surveys have focused on concerns over discrimination and violence against Asian Americans, as well as studies about their religious beliefs. Find these publications and more on the Center’s Asian Americans topic page.

Pew Research Center is a subsidiary of The Pew Charitable Trusts, its primary funder. The Center’s Asian American portfolio was funded by The Pew Charitable Trusts, with generous support from The Asian American Foundation; Chan Zuckerberg Initiative DAF, an advised fund of the Silicon Valley Community Foundation; the Robert Wood Johnson Foundation; the Henry Luce Foundation; the Doris Duke Foundation; The Wallace H. Coulter Foundation; The Dirk and Charlene Kabcenell Foundation; The Long Family Foundation; Lu-Hebert Fund; Gee Family Foundation; Joseph Cotchett; the Julian Abdey and Sabrina Moyle Charitable Fund; and Nanci Nishimura.

We would also like to thank the Leaders Forum for its thought leadership and valuable assistance in helping make this survey possible.

The strategic communications campaign used to promote the research was made possible with generous support from the Doris Duke Foundation.

Terminology

The terms Asian, Asians living in the United States, U.S. Asian population and Asian Americans are used interchangeably throughout this report to refer to U.S. adults who self-identify as Asian, either alone or in combination with other races or Hispanic identity.

Ethnicity and ethnic origin labels, such as Chinese and Chinese origin, are used interchangeably in this report for findings for ethnic origin groups, such as Chinese, Filipino, Indian, Japanese, Korean or Vietnamese. For this report, ethnicity is not nationality. For example, Chinese in this report are those self-identifying as of Chinese ethnicity, rather than necessarily being a current or former citizen of the People’s Republic of China. Ethnic origin groups in this report include those who self-identify as one Asian ethnicity only, either alone or in combination with a non-Asian race or ethnicity.

Less populous Asian origin groups in this report are those who self-identify with ethnic origin groups that are not among the six largest Asian origin groups. The term includes those who identify with only one Asian ethnicity. These ethnic origin groups each represent about 2% or less of the overall Asian population in the U.S. For example, those who identify as Burmese, Hmong or Pakistani are included in this category. These groups are unreportable on their own due to small sample sizes, but collectively they are reportable under this category.

The terms Asian origins and Asian origin groups are used interchangeably throughout this report to describe ethnic origin groups.

Immigrants in this report are people who were not U.S. citizens at birth – in other words, those born outside the U.S., Puerto Rico or other U.S. territories to parents who are not U.S. citizens. Immigrant, first generation and foreign born are used interchangeably to refer to this group.  

Naturalized citizens are immigrants who are lawful permanent residents who have fulfilled the length of stay and other requirements to become U.S. citizens and who have taken the oath of citizenship.

U.S. born refers to people born in the 50 U.S. states or the District of Columbia, Puerto Rico or other U.S. territories.

Second generation refers to people born in the 50 states or the District of Columbia, Puerto Rico or other U.S. territories with at least one first-generation (immigrant) parent.

Third or higher generation refers to people born in the 50 states or the District of Columbia, Puerto Rico or other U.S. territories with both parents born in the 50 states, D.C., Puerto Rico or other U.S. territories.

The nation’s Asian population is fast growing and diverse. Numbering more than 23 million, the population has ancestral roots across the vast, ethnically and culturally rich Asian continent. For Asians living in the United States, this diversity is reflected in how they describe their own identity. According to a new, nationwide, comprehensive survey of Asian adults living in the U.S., 52% say they most often use ethnic labels that reflect their heritage and family roots, either alone or together with “American,” to describe themselves. Chinese or Chinese American, Filipino or Filipino American, and Indian or Indian American are examples of these variations.

There are other ways in which Asians living in the U.S. describe their identity. About half (51%) of Asian adults say they use American on its own (10%), together with their ethnicity (25%) or together with “Asian” as Asian American (16%) when describing their identity, highlighting their links to the U.S.

And while pan-ethnic labels such as Asian and Asian American are commonly used to describe this diverse population broadly, the new survey shows that when describing themselves, just 28% use the label Asian (12%) on its own or the label Asian American (16%).

The survey also finds that other labels are used by Asian Americans. Some 6% say they most often prefer regional terms such as South Asian and Southeast Asian when describing themselves.
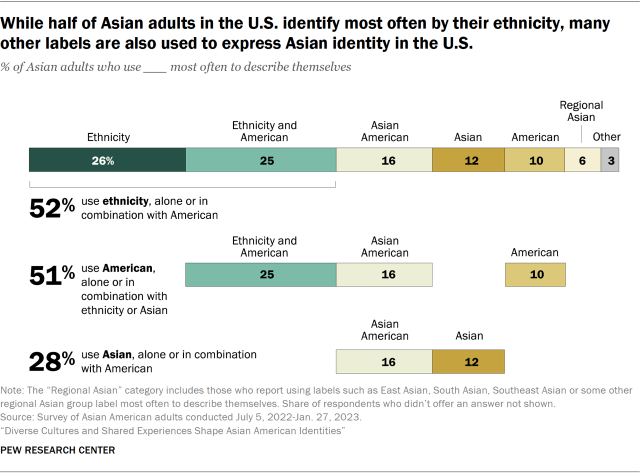
Bar chart showing while half of Asian adults in the U.S. identify most often by their ethnicity, many other labels are also used to express Asian identity in the U.S.

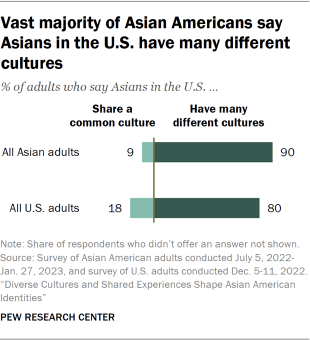
Asian adults see more cultural differences than commonalities across their group as well. When asked to choose between two statements – that Asians in the U.S. share a common culture, or that Asians in the U.S. have many different cultures – nearly all (90%) say U.S. Asians have many different cultures. Just 9% say Asians living in the U.S. share a common culture. This view is widely held across many demographic groups among Asian Americans, according to the survey.

The view that Asian Americans have many different cultures is also one held by the general public, according to another Pew Research Center survey of U.S. adults, conducted in December 2022. Among all U.S. adults, 80% say Asians in the U.S. have many different cultures, while 18% say they share a common culture.1

Bar chart showing despite diverse origins, many Asian Americans report shared experiences in the U.S. and feel connected to other Asians in the U.S.

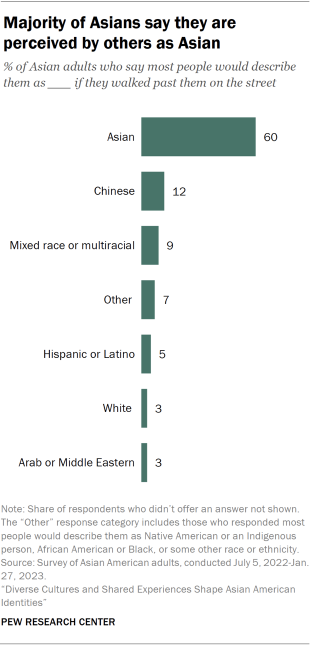
Though Asian Americans’ identities reflect their diverse cultures and origins, Asian adults also report certain shared experiences. A majority (60%) say most people would describe them as “Asian” while walking past them on the street, indicating most Asian adults feel they are seen by others as a single group, despite the population’s diversity. One-in-five say they have hidden a part of their heritage (their ethnic food, cultural practices, ethnic clothing or religious practices) from others who are not Asian, in some cases out of fear of embarrassment or discrimination. Notably, Asian adults ages 18 to 29 are more likely to say they have done this than Asians 65 and older (39% vs. 5%).

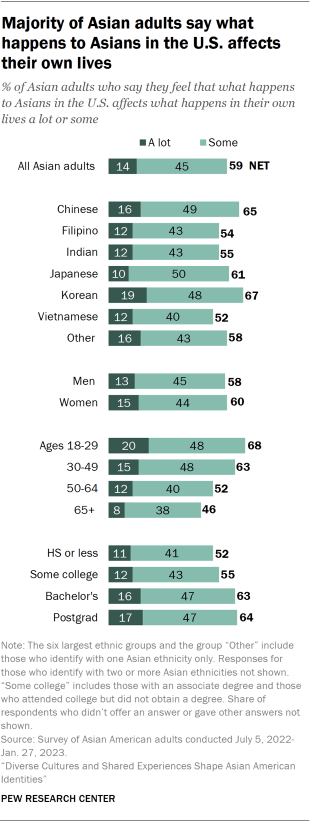
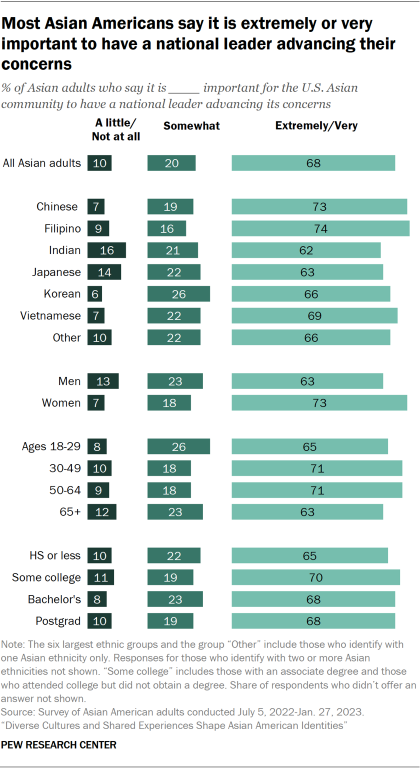
Asian adults in the U.S. also feel connected with other Asian Americans. About six-in-ten (59%) say that what happens to Asians in the U.S. affects their own lives, at least to some extent.2 And about two-thirds (68%) of Asian Americans say it is extremely or very important to have a national leader advocating for the concerns and needs of the Asian population in the U.S.

The new survey also shows that large majorities of Asian adults share similar views on what it takes to be considered truly American. And they consider many of the same factors to be important in their views of the American dream.

These are among the key findings from Pew Research Center’s new survey of Asian American adults, conducted by mail and online from July 5, 2022, to Jan. 27, 2023. This is the largest nationally representative survey of its kind to date that focused on Asian Americans. The survey was conducted in English and five Asian languages, among a representative sample of 7,006 Asian adults living in the United States. 

Asian Americans are 7% of the U.S. population, according to a Pew Research Center analysis of the 2021 American Community Survey. Their population is diverse, with roots in more than 20 countries in East Asia, Southeast Asia and the Indian subcontinent. About 54% of the national Asian population are immigrants. The six largest origin groups (Chinese, Filipino, Indian, Japanese, Korean and Vietnamese), a focus of this survey and report, together account for 79% of all Asian Americans.

Overall, about 34% of Asian Americans are the U.S.-born children of immigrant parents, and another 14% are of third or higher generation (meaning their parents were born in the U.S. as well), according to a Pew Research Center analysis of the 2022 Current Population Survey, March Annual Social and Economic Supplement.

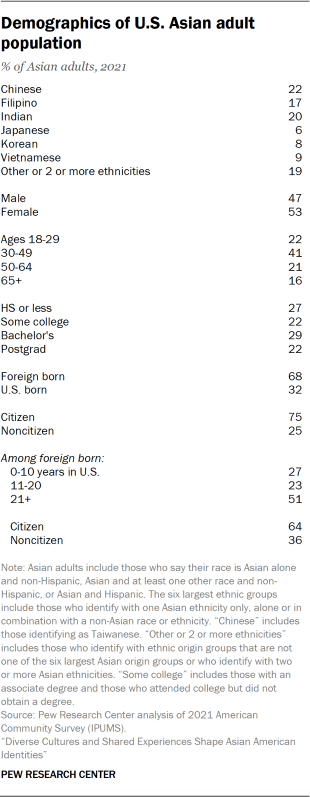
This survey and report focus on Asian adults in the U.S. The six largest origin groups together account for 81% of Asian adults. And 68% of Asian American adults are immigrants, according to Center analysis of the 2021 American Community Survey. Additionally, 25% are the U.S.-born children of immigrant parents and 10% are of third or higher generation, according to Center analysis of government data.

The making of Asian American identity and knowledge of Asian history in the U.S.

The pan-ethnic term “Asian American” emerged in Berkeley, California, in the 1960s as part of a political movement to organize the diverse U.S. Asian population. The creation of an Asian American identity was in reaction to a long history of exclusion of Asians in the country, including the 1882 Chinese Exclusion Act and a pair of Supreme Court cases in the 1920s clarifying that Asians, including South Asians, are not “free White persons” and therefore were excluded from becoming naturalized U.S. citizens.3 Subsequently, the term was adopted by the federal government and today is the principal identity label used by media, academics, researchers and others to describe today’s diverse Asian American population.

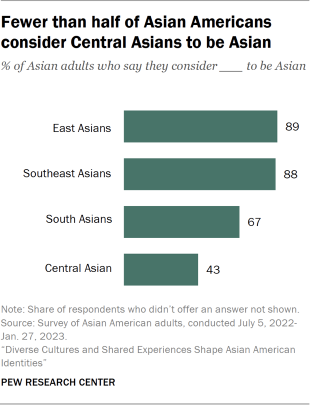
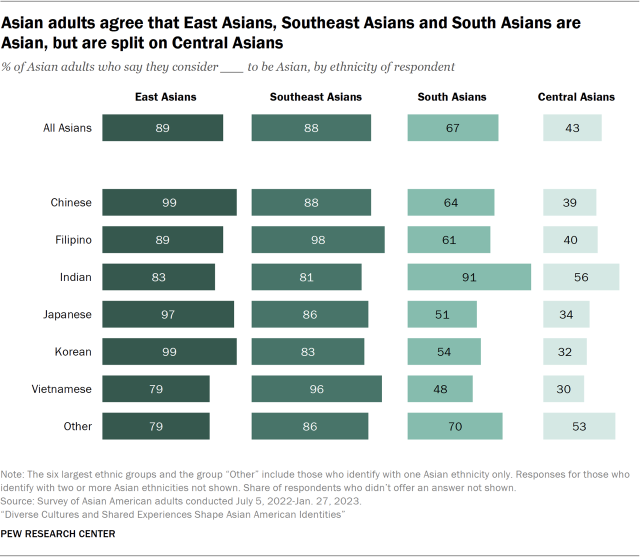
In most cases today, someone is considered Asian or Asian American if they self-identify as such. But Asian Americans do not necessarily agree on which regional or ethnic groups from the Asian continent they consider to be Asian, according to the new survey. The vast majority of Asian adults say they consider those from East Asia, such as Chinese or Koreans (89%); Southeast Asia, such as Vietnamese or Filipinos (88%); and to a lesser extent South Asia such as Indians or Pakistanis (67%) to be Asian.

But Asian adults are split on whether they consider Central Asians such as Afghans or Kazakhs to be Asian (43% of Asian adults say they are). While about half of Indian adults (56%) say they would include Central Asians in the category Asian, fewer than half of Filipino (40%), Chinese (39%), Japanese (34%), Korean (32%) and Vietnamese (30%) adults consider them Asian.

Few Asians say they are knowledgeable about U.S. Asian history

Asian Americans have a long history in the United States. From Chinese laborers who helped build the first transcontinental railroad, to Japanese immigrants who arrived as plantation workers in what is now the state of Hawaii, to the incarceration of Japanese Americans during World War II, to Filipinos being treated as U.S. nationals while the Philippines was a U.S. territory, the Asian American experience has been a part of U.S. history.

Bar chart showing one-in-four Asian Americans are extremely or very informed about the history of Asians in the U.S

With the passage of the landmark Immigration and Nationality Act of 1965, a new wave of immigrants from Asia began arriving in the United States, creating a new, contemporary U.S. Asian history. The Vietnam War and other conflicts in Southeast Asia brought Vietnamese and other Southeast Asian refugees to the U.S., first with the passage of the 1975 Indochina Migration and Refugee Assistance Act and then with the Refugee Act of 1980. The 1990 Immigration Act raised immigration ceilings and set in place processes that allowed the flows of Asian immigrants, particularly of high-skilled immigrants, to continue and expand. The U.S. technology boom of the 1990s and 2000s attracted many high-skilled immigrants, particularly from India and China, to tech centers around the country.

This rich history, however, is little-known to Asian adults, according to the new survey. One-in-four (24%) say they are very or extremely informed about history of Asians in the United States, while an equal share (24%) say they are little or not at all informed.

The majority of those very or extremely informed about the history of Asians in the U.S. say they learned about this history through informal channels: internet (82%), media (76%) and family and friends (70%). In contrast, 49% learned about it from college or university courses and 39% from elementary through high school.

Immigrant ties shape Asian Americans’ identities and their life in the U.S.

Immigration experiences, connections with home countries, and how long someone has lived in the U.S. shape many Asian Americans’ identities. Among Asian adults in the U.S., immigrants are more likely than those who are U.S. born to describe their identity most often with their ethnic labels, either alone or together with the label American (56% vs. 41%).

Bar chart showing place of birth shapes Asian American identities and life in America

Meanwhile, Asian immigrants are less likely than U.S.-born Asians (46% vs. 65%) to say they most often describe themselves as American in some way – whether by their ethnic label combined with American, as Asian American, or simply as American. Still, nearly half of Asian immigrants describe themselves in one of these three ways.

When it comes to identifying with the label Asian – either alone or as Asian American – immigrant and U.S.-born Asians are about equally likely to say they do so (28% and 29% respectively). Immigrant Asians are less likely than U.S.-born Asians to identify most often as Asian American (14% vs. 21%).

On the question of seeing themselves more as a “typical American” or “very different from a typical American,” Asian immigrant adults are far less likely than those born in the U.S. to think of themselves as a typical American (37% vs. 69%).

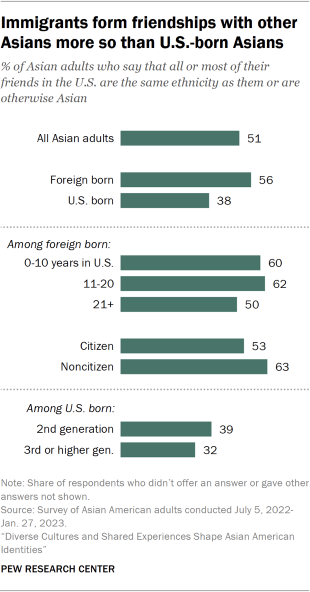
Nativity is also tied to how Asians in the U.S. develop their friendships. Those who immigrated to the U.S. are more likely to have friends who are Asian or of the same ethnicity as them than are U.S.-born Asians (56% vs. 38%).

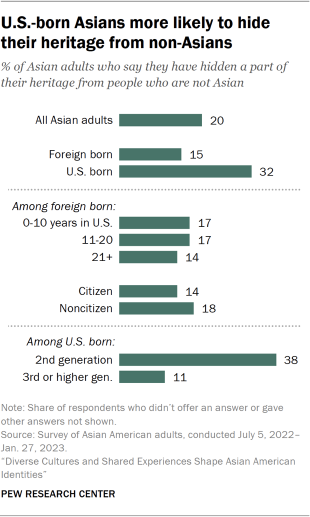
Asian immigrants (15%) are also less likely than U.S.-born Asians (32%) to have ever hidden a part of their heritage from people who are not Asian. When asked in an open-ended question to explain why they hide aspects of their culture, some U.S.-born respondents mentioned phrases such as “fear of discrimination,” “being teased” and “embarrassing.”

Views of identity among Asian American immigrants are often tied to time spent in the U.S.

Bar chart showing among Asian American immigrants, recent arrivals are more likely than longtime residents to use their ethnicity alone to describe themselves

How long Asian immigrants have lived in the U.S. also shapes their identity and experiences. Those who arrived in the U.S. in the past 10 years are more likely than those who arrived more than 20 years ago to say they most often use their ethnicity, such as Filipino or Vietnamese, to describe themselves. And about two-thirds (65%) of those who arrived in the U.S. in the past decade describe their identity most often with their ethnicity’s name, either alone or combined with American, compared with 54% among those who have been in the country for more than two decades.

Roughly half (54%) of those who have arrived in the past 10 years say they most often use only their ethnicity to describe themselves, compared with just 21% of those who arrived more than two decades ago who say the same.

On the other hand, just 17% of Asian immigrants who arrived in the country in the past 10 years describe themselves most often as American, by their ethnic label combined with American, or as Asian American, while 59% of those who arrived more than 20 years ago do so.

When it comes to their circle of friends, 60% of Asian immigrants who arrived in the past 10 years say most or all of their friends are also Asian Americans, while 50% of those who arrived more than 20 years ago say the same.

And when asked if they think of themselves as typical Americans or not, Asian immigrants who arrived in the U.S. in the past decade are substantially less likely than those who arrived more than two decades ago to say they are typical Americans (20% vs. 48%).

Asians in the U.S. share similar views among themselves and with the U.S. public on what it means to be American

The new survey also explored the views Asian Americans have about traits that make one “truly American.” Overall, Asian Americans and the general U.S. population share similar views of what it means to be American. Nearly all Asian adults and U.S. adults say that accepting people of diverse racial and religious backgrounds (94% and 91%), believing in individual freedoms (92% and 94%) and respecting U.S. political institutions and laws (89% and 87%) are important for being truly American.

Similarly, Asian Americans and the U.S. general population share in their views about the American dream. They say having freedom of choice in how to live one’s life (96% and 97% respectively), having a good family life (96% and 94%), retiring comfortably (96% and 94%) and owning a home (both 86%) are important to their view of the American dream. Smaller shares of Asian and U.S. adults (30% and 27%) say owning a business is important to their view of the American dream.

Here are other survey findings highlighting the diverse views and attitudes of Asian adults living in the U.S.:

  • Indian adults are the most likely of the six largest Asian origin groups to say they most often use their ethnicity, without the addition of “American,” to describe themselves. About four-in-ten Indian adults (41%) say they do this. By comparison, smaller shares of Korean (30%), Filipino (29%), Chinese (26%) and Vietnamese (23%) adults do the same. Japanese adults (14%) are the least likely among the largest groups to use their ethnic identity term alone.
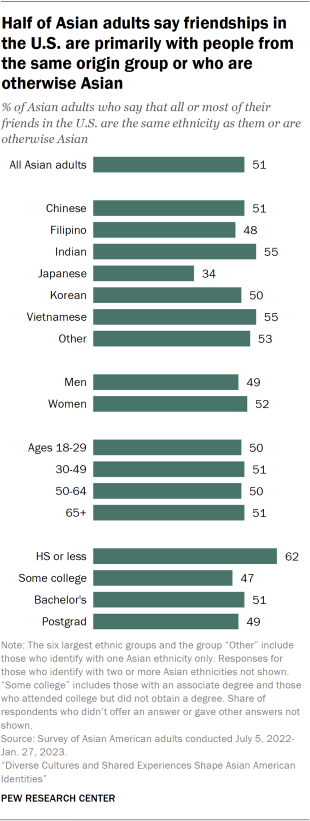
  • Japanese adults are the least likely among the largest Asian origin groups to say they have friendships with other Asians. About one-in-three Japanese adults (34%) say most or all their friends share their own ethnicity or are otherwise Asian. By contrast, about half of all Indian (55%), Vietnamese (55%), Chinese (51%), Korean (50%) and Filipino (48%) respondents say the same.
  • One-in-four Korean adults (25%) say they have hidden part of their heritage from people who are not Asian. Some 20% of Indian, 19% of Chinese, 18% of Vietnamese, 16% of Filipino and 14% of Japanese adults say they have done the same.
  • Across the largest ethnic groups, about half or more say that what happens to Asians in the U.S. affects what happens in their own lives. About two-thirds of Korean (67%) and Chinese (65%) adults say this. By comparison, 61% of Japanese, 54% of Filipino, 55% of Indian and 52% of Vietnamese adults say they are impacted by what happens to Asians nationally.
  • Most Asian adults among the largest ethnic origin groups say a national leader advancing the U.S. Asian community’s concerns is important. Roughly three-in-four Filipino (74%) and Chinese (73%) adults say it is very or extremely important to for the U.S. Asian community to have a national leader advancing its concerns. A majority of Vietnamese (69%), Korean (66%), Japanese (63%) and Indian adults (62%) says the same.  
  • About half of Vietnamese registered voters (51%) identify with or lean to the Republican Party. In contrast, about two-thirds of Indian (68%), Filipino (68%) and Korean (67%) registered voters identify with or lean toward the Democratic Party. And 56% of Chinese registered voters also associate with the Democratic Party. 
1. Asian identity in the U.S.

Asians in the United States trace their origins to a vast continent that spans more than 20 countries in East and Southeast Asia and the Indian subcontinent. This geographic diversity translates into multiple ways Asians in the U.S. personally describe their own identities. Some choose to identify with their ethnic origins such as Filipino or Korean or Chinese, some with the pan-ethnic label Asian, some with a regional identity such as South Asian and others with an American identity. Asians in the U.S. also sometimes chose to combine their racial or ethnic identities with American, such as Asian American or Vietnamese American respectively.

In the new Pew Research Center survey, Asian adults were asked about how they describe their identity most often. They were also asked which regional groups from the continent of Asia they would consider to be Asian. In addition, the survey explored how others would describe them when walking past them on the street.

How Asians in the U.S. describe their identity

Asians living in the U.S. are often described as a single group, often with the pan-ethnic label Asian American. However, when asked how they describe themselves, U.S. Asian adults place greater emphasis on their ethnic origins rather than pan-ethnic or regional labels, according to the new survey.

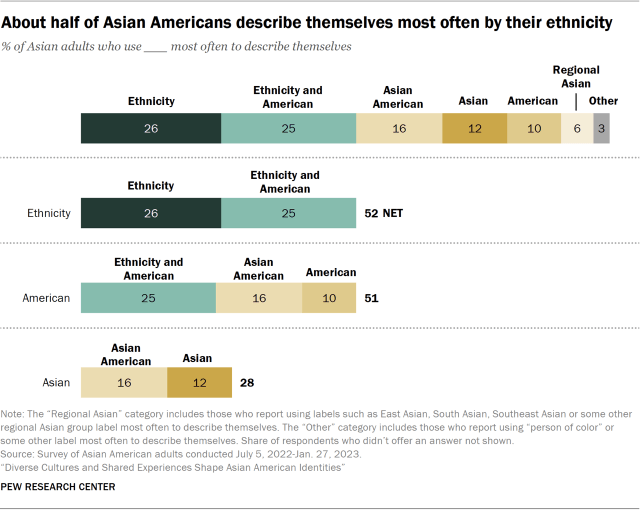
Bar chart showing about half of Asian Americans describe themselves most often by their ethnicity

About half (52%) of Asian adults say they describe themselves most often by their ethnic origin, either alone (26%) such as Japanese or Korean or in combination with American (25%) such as Vietnamese American.

Still, some Asian adults use pan-ethnic labels. According to the survey, 28% say they describe themselves most often using the pan-ethnic label Asian, either alone (12%) or as Asian American (16%).

And while just 10% say they most often use American on its own to describe their identity, 25% use their ethnic origin combined with American and 16% use Asian American. Altogether, about half (51%) of Asian adults use American one of these three ways when describing their identity.  

Another 6% say they use a regional Asian pan-ethnic label such as South Asian or Southeast Asian to describe themselves most often.

Use of ethnic origin labels among the largest origin groups

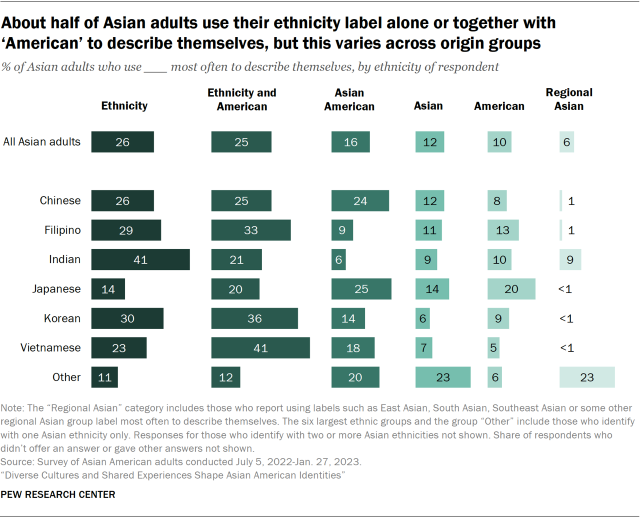
About half or more of adults from five of the six largest Asian origin groups use their ethnic label, either alone or together with American, most often to describe their identity. About two-thirds of Korean (66%) and Vietnamese (64%) adults say they do so, while about six-in-ten Indian and Filipino adults do (62% and 61% respectively). About half of Chinese adults (51%) say the same. By contrast, just 34% of Japanese adults say they use Japanese or Japanese American to describe their identity.

Bar chart showing about half of Asian adults use their ethnicity label alone or together with ‘American’ to describe themselves, but this varies across origin groups

But these broad results mask some important patterns. Indians in the U.S. are the most likely of the largest Asian groups to say they most often use their ethnic identity term, without the addition of American, to describe themselves. Some 41% of Indian adults do this, calling themselves most often Indian. By contrast, Japanese adults (14%) are least likely of the six most populous Asian ethnic groups to describe themselves by ethnicity alone.

Meanwhile, about four-in-ten Vietnamese adults (41%) say they most often describe their identity with their ethnic origin and the label American. Just one-in-five Indian (21%) and Japanese (20%) adults say they do the same.

Use of pan-ethnic and regional Asian labels

Japanese and Chinese adults are more likely than other large Asian origin groups to use the pan-ethnic labels Asian or Asian American. Some 39% of Japanese adults say they do so, as do 35% of Chinese adults. These are higher shares than among Vietnamese (25%), Filipino (20%), Korean (20%) or Indian (15%) adults.

When it comes to describing their identity regionally (such as East Asian, South Asian or Southeast Asian), Indian adults (9%) are more likely to identify this way compared with the other five most populous Asian groups.

The less populous Asian origin groups, those categorized as “Other” in this report, are more likely than Asian adults overall to say they describe themselves most often as Asian (23% vs. 12%).4 And one-in-five Asian adults (20%) in these less populous Asian origin groups use the term Asian American most often to describe themselves, while 16% of Asian adults overall say the same.

The less populous Asian origin groups are also more likely to describe themselves using a regional Asian identity (such as Southeast Asian) when compared with all Asian adults (23% vs. 6%).

Use of ethnic identity labels falls as Asian immigrants spend more time in the U.S.

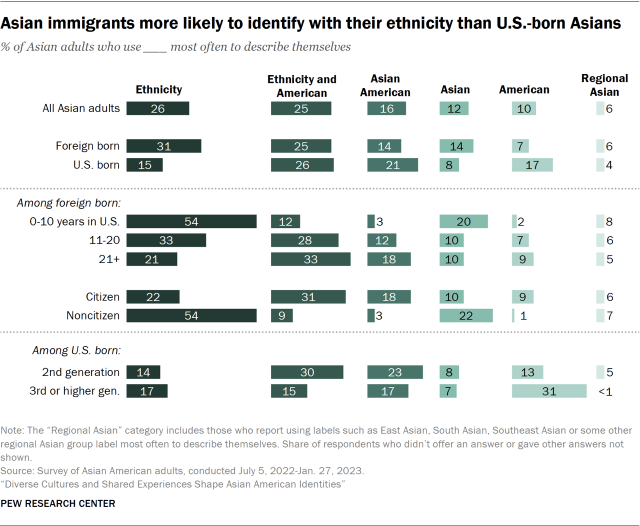
Nativity is an important factor in explaining differences in the terms Asian adults use to describe their identity. The majority of Asian immigrants (56%) either describe themselves most often with their ethnicity alone (31%) or ethnicity in combination with American (25%), according to the new survey. By comparison, fewer Asian adults born in the U.S. (41%) use their ethnicity in either of these ways, with 15% saying they most often use their ethnicity on its own to describe themselves and another 26% saying they use their ethnic label and American together.

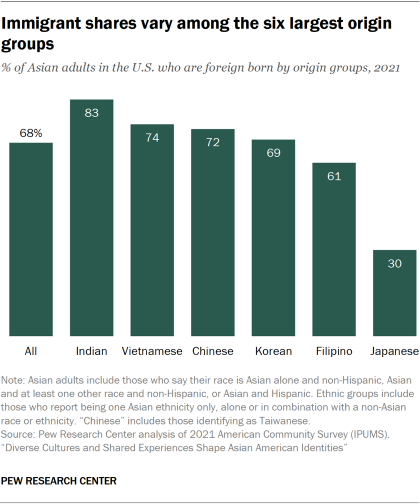
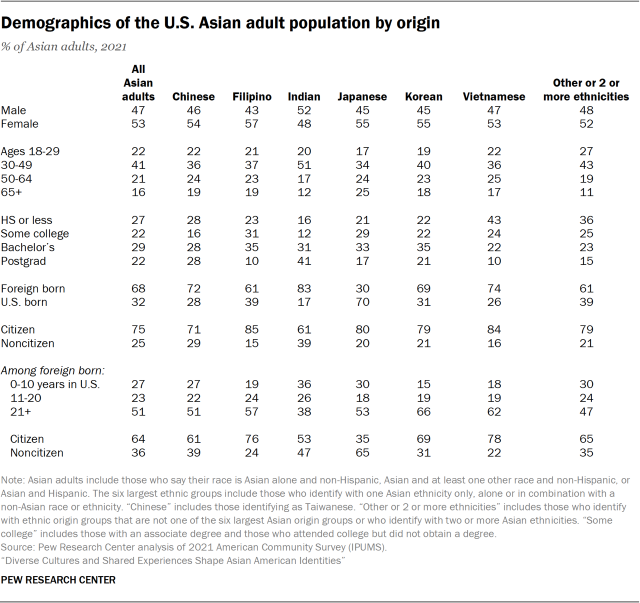
Overall, about two-thirds (68%) of Asian adults are immigrants, according to a Pew Research Center analysis of 2021 U.S. government data. Among adults in the largest six origin groups, Indians (83%) have the highest share who are immigrants, while Japanese adults (30%) have the lowest share. Japanese adults are also the only group among the largest six who are majority U.S. born.

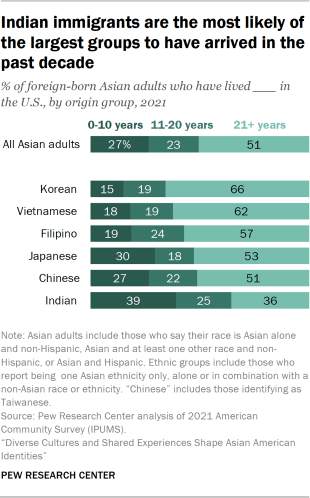
In the new survey focused on Asian Americans, the use of ethnicity to describe their identity decreases among Asian immigrants the longer they live in the United States. About 54% of those who have been in the U.S. for 10 years or less use their ethnicity alone to describe their identity most often, compared with 21% of those who have been in the U.S. for 21 years or more.

Bar chart showing Asian immigrants more likely to identify with their ethnicity than U.S.-born Asians

The use of ethnic origin identities decreases across immigrant generations as well, according to the survey. For example, Asian adults’ use of ethnicity combined with American to describe themselves decreases from 30% among the second generation (those born in the U.S. to at least one immigrant parent) to 15% among the third or higher generations (born in the U.S. to U.S.-born parents).

Additionally, 44% of second-generation Asian adults describe themselves with their ethnicity alone or in combination with American, and 32% of third- and higher-generation Asian adults say the same.

As use of ethnic origin terms decreases across immigrant generations, the use of terms describing American identity increases. Third- and higher-generation Asian adults are more likely to say they describe themselves most often as American alone (31%) than those who are second generation (13%) or are immigrants (7%).

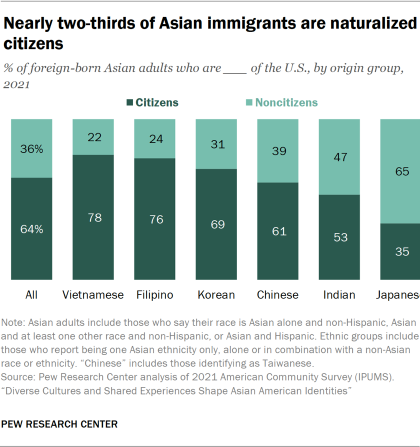
Among Asian immigrants, those who acquired U.S. citizenship through naturalization (9%) are more likely than those who do not have U.S. citizenship (1%) to most often describe themselves as American alone. Asian immigrants who are naturalized U.S. citizens are also more likely than non-U.S. citizens to use the terms Asian American (18% vs. 3% respectively) or their ethnicity in combination with American (31% vs. 9%).

The pan-ethnic term Asian American rises in use among immigrants the longer they live in the country. Only 3% of those who immigrated within the last 10 years describe themselves as Asian American, compared with 18% of those who have been in the U.S. for 21 years or more.

In their own words: Qualitative research findings related to how Asians in the U.S. describe themselves

In a 2021 Pew Research Center qualitative research study of Asian Americans, the following findings were related to some of the survey findings on how Asians in the U.S. identify:

  • Many Asian Americans shared how the pan-ethnic Asian label doesn’t necessarily fit them. They described the Asian label as too broad or too ambiguous, and said it lumps many diverse groups together. Others mentioned that the label Asian can be interpreted as specific to origin groups from East Asia, rather than other groups from across Asia.
  • For Indians in the U.S., some focus group participants mentioned how they used the South Asian label to avoid confusion with Native Americans.
  • Asian Americans from smaller ethnic groups said they default to “Asian” since their groups are less recognizable.
  • There are several reasons why Asian adults would identify as American, including acquiring citizenship, being born in the U.S., and culturally feeling American.

Asian adults and the general public agree: U.S. Asians have many different cultures

Bar chart showing vast majority of Asian Americans say Asians in the U.S. have many different cultures

The vast majority of Asian Americans (90%) say Asians in the U.S. have many different cultures, rather than share a common culture. This is 10 percentage points higher than the share of the U.S. general public (80%) who say the same. On the other hand, only 9% of Asian adults say Asians in the U.S. share a common culture, which is a lower share than among the public overall (18%).

Whom do U.S. Asians consider Asian?

Bar chart showing fewer than half of Asian Americans consider Central Asians to be Asian

The pan-ethnic label Asian encompasses a diversity of geographic origins and ethnic groups, and it has different meanings for different people. In the new survey, Asian adults were asked if they considered each of the following groups to be Asian: East Asians (for example, Chinese or Koreans), South Asians (such as Indians or Pakistanis), Southeast Asians (for instance, Vietnamese or Filipinos) and Central Asians (such as Afghans or Kazakhs).

The vast majority of Asian adults say they consider East Asians (89%) and Southeast Asians (88%) to be Asian, while a smaller majority (67%) say the same for South Asians. On the other hand, only 43% of Asians in the U.S. consider Central Asians to be Asian.

Are Central Asians considered Asian?

Prior to the 2020 decennial census, Central Asians, such as Afghans and Kazakhs, were not categorized as Asian by the U.S. Census Bureau. Beginning with the 2020 census and the 2020 American Community Survey, the bureau revised the list of origins included in the definition of Asian. Before, the westernmost country that was considered “Asia” was Pakistan. Under the new classifications, Afghans and Central Asians (Kazakhs, Kyrgyz, Tajiks, Turkmen and Uzbeks) are considered Asian. Previously, individuals with these origins had been considered White. People from other Asian countries west of the Caspian Sea – Azerbaijan, Armenia and Georgia – are still coded as White by the Census Bureau, as are Iranians and others with origins in Southwest Asia (such as Lebanon and Saudi Arabia).

About half of Indian adults consider Central Asians as Asian, and nearly all see South Asians as Asian

Roughly half of Indian adults (56%) consider Central Asians to be Asian. They are the most likely to say this among the six largest Asian origin groups. A similar share of Asian adults from less populous origin groups (53%) say they consider Central Asians to be Asian.

Bar chart showing Asian adults agree that East Asians, Southeast Asians and South Asians are Asian, but are split on Central Asians

When it comes to whether South Asians are part of the broader Asian category, Indian adults (91%) are more likely than the other groups to consider South Asians to be Asian. Smaller majorities of Chinese (64%) and Filipino (61%) adults say the same. And about half of Korean (53%), Japanese (51%) and Vietnamese (48%) adults consider South Asians to be Asian.

A majority of Asian adults say others would describe them as Asian when walking past them on the street

Bar chart showing majority of Asians say they are perceived by others as Asian

Asian adults were asked in the survey how most people would describe them if, for example, they walked past them on the street.5 Six-in-ten Asian adults say most people would describe them as Asian. About one-in-ten Asian adults (12%) say people would describe them as Chinese, and 9% say they would be considered mixed race or multiracial.

Differences by origin groups in being perceived as Asian

Korean (79%) and Vietnamese adults (75%) are the most likely of the six largest Asian groups to say people would describe them as Asian if walking past them on the street.

Meanwhile, Filipino, Indian and Japanese adults are the most likely to say they would be seen as a different race or ethnicity than Asian. Filipino adults (15%) are more likely than other groups to say they would be described as Hispanic or Latino. Indian adults are more likely to say they would be described by others as of some other race or ethnicity (16%), Arab or Middle Eastern (6%), or African American or Black (2%). And about one-in-ten Japanese adults (8%) say they would be seen as White.

Bar chart showing being perceived as Asian by others declines across immigrant generations

Japanese and Filipino adults are the most likely of the six largest Asian origin groups – at 20% and 14% respectively – to say they would be described as mixed race or multiracial.

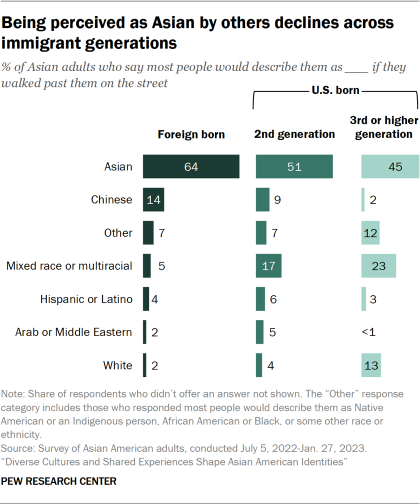
Asian immigrants (64%) are more likely than later immigrant generations to say people would describe them as Asian when walking past them on the street. Among U.S.-born Asian adults, about half (51%) who are second generation (the children of immigrant parents) and 45% of those who are third generation or higher say the same.

2. Asian Americans and life in America

Life for Asians living in the United States is shaped by the relationships they form here, their cultural heritage, and their group’s history in the U.S. Their lives in America are also shaped by the connections they have with other Asian Americans and their views of representation and politics.

For many Asian adults, where they were born shapes friendships formed in the U.S.

Bar chart showing half of Asian adults say friendships in the U.S. are primarily with people from the same origin group or who are otherwise Asian

Life for Asians living in the United States can look quite different depending on where they were born. Those born outside the U.S. are often older, having experienced a larger share of their formative years in other places. And they often have stronger ties to their origin group than those born in the U.S. do. These differences contribute to the types of social relationships formed by U.S. Asians.

Overall, about half (51%) of Asian Americans say all or most of their friends in the United States share their own ethnicity or are otherwise Asian. The extent to which Asian Americans form friendships with other Asians is similar across most of the largest origin groups. At least half of all Vietnamese (55%), Indian (55%), Chinese (51%) and Korean (50%) respondents say all or most of their friends in the U.S. share their ethnicity or are otherwise Asian, compared with 34% for Japanese respondents.

Bar chart showing immigrants form friendships with other Asians more so than U.S.-born Asians

Some of the largest differences among Asian Americans are driven by the experiences of those born outside the United States. More than half of Asian immigrant adults (56%) say all or most of their friends share their ethnicity or are Asian. Among immigrants, those who came to the U.S. in the last 10 years are more likely to indicate this about their friends than those who have lived in the U.S. for 21 years or more (60% and 50% respectively).

By comparison, 38% of U.S.-born Asian adults say all or most of their friends share their ethnicity or are otherwise Asian. Among the U.S. born, about four-in-ten (39%) who are second generation say all or most of their friends share their same ethnicity or are Asian, compared with 32% of those who are third generation or higher who say the same. Immigrants are more likely than U.S.-born adults to say that all or most of their friends are of the same ethnicity (45% vs. 19%). Conversely, U.S.-born Asians (25%) are slightly more likely than Asian immigrants (19%) to say all or most of their friends are not of their ethnicity, but still Asian.

Most Asian adults are comfortable with intermarriage

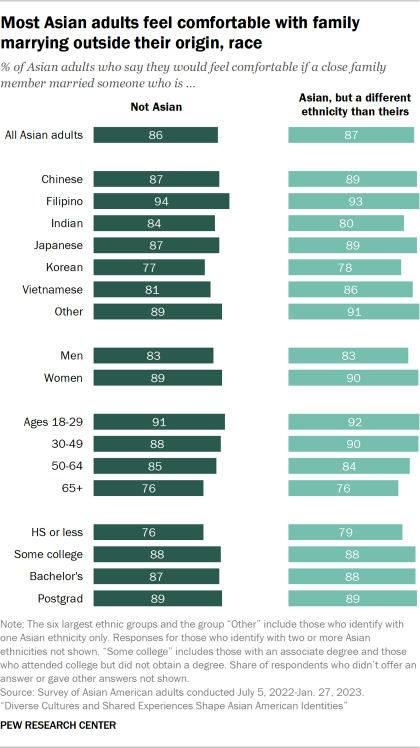
Bar chart showing most Asian adults feel comfortable with family marrying outside their origin, race

When it comes to marriage, nearly all Asian adults say they would be comfortable if a close family member married someone who is not Asian (86%) or married someone who is Asian but from a different ethnic group (87%).

Historically, Asian Americans have some of the highest intermarriage rates among U.S. adults. In 2021, 23% of Asian newlyweds were married to someone who is not Asian, according to a Pew Research Center analysis of government data. These rates have changed little since the 1990s.

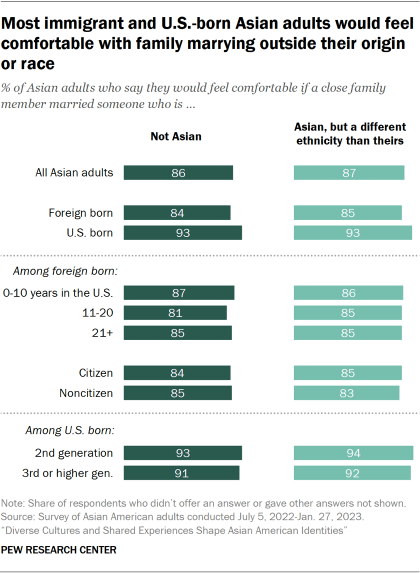
Bar chart showing most immigrant and U.S.-born Asian adults would feel comfortable with family marrying outside their origin or race

Although large majorities across Asian origin groups say they are comfortable with a close relative marrying outside their racial or ethnic group, Filipino adults stand out on this measure. Nearly all Filipino respondents say they would feel comfortable with a close family member marrying someone who is not Asian (94%) or is Asian but not Filipino (93%).

Interestingly, while Asian adults born in the U.S. differ from those born elsewhere when it comes to forming friendships, more than 80% of both groups say they are comfortable with a close family member marrying outside their race or ethnicity.

Asian women are more comfortable than Asian men with intermarriage in their family, both with marrying someone who is not Asian (89% vs. 83%) and someone who is of a different Asian ethnicity (90% vs. 83%). One large gender gap is by immigrant status: U.S.-born Asian women are the most comfortable with a close family member marrying outside their race (95%), foreign-born men are least comfortable (82%), and U.S.-born men (89%) and foreign-born women (87%) are in the middle. Similarly, nearly all U.S.-born women (96%) report being comfortable with a close relative marrying someone who is Asian but of a different ethnicity, followed by U.S.-born men (90%).

Younger Asian American adults are also slightly more comfortable with intermarriage than older Asian adults, with those ages 18 to 29 more likely to say they are comfortable with a close family member marrying outside their race (91%) than those 50 to 64 (85%) and 65 and older (76%). Those ages 18 to 29 are also more likely to say they are comfortable with a close relative marrying someone who is Asian outside of their ethnicity (92%) than older Asian adults (84% among ages 50 to 64, and 76% among ages 65 and older).

Some Asians say they have hidden their heritage

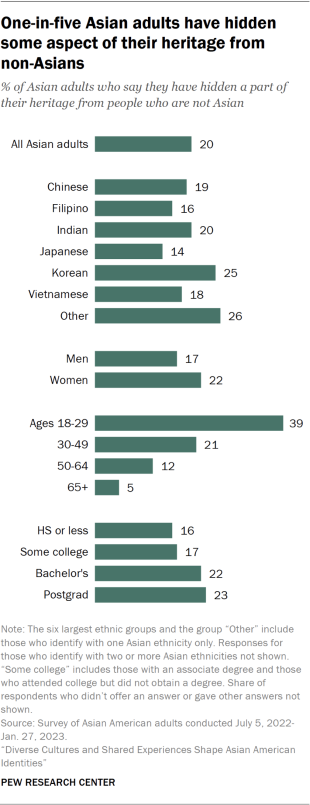
Bar chart showing one-in-five Asian adults have hidden some aspect of their heritage from non-Asians

An experience that some Asian Americans have in the U.S. is feeling singled out or “othered” due to their identity. In the new survey, Asian adults were asked if they have ever hidden a part of their heritage (such as food, cultural practices, clothing or religious practices) from people who are not Asian. Overall, one-in-five Asian Americans report doing so. The extent to which U.S. Asians say they have had such experiences varies across several demographic characteristics including age, nativity, education, ethnicity and gender.

Among the largest Asian origin groups, 25% of Korean adults say they have hidden some aspect of their heritage from non-Asians, while slightly smaller shares of Chinese (19%), Filipino (16%), Vietnamese (18%) and Japanese adults (14%) have also done so.

The experience of having to hide some aspect of their heritage from others is one that younger Asian adults are more likely to report than older Asians. Indeed, 39% of U.S. Asians ages 18 to 29 report they have hidden some aspect of their culture or heritage, compared with just 12% among those 50 to 64 and 5% of those 65 and older.

In addition, there are differences between men and women, with a slightly higher share of women than men saying they have had to hide their heritage (22% vs. 17%). Finally, a larger share of Asian adults with a bachelor’s (22%) or postgraduate degree (23%) report having hidden some aspect of their culture or heritage compared with those with some college (17%) or a high school diploma or less (16%).

Another large difference is among Asian adults born in the U.S. and those born in another country. U.S.-born respondents were twice as likely as Asian immigrants to report having hidden some aspect of their culture (32% vs. 15%). And one of the largest gaps between groups of Asian adults is generational, with 38% of second-generation Asians saying they have hidden some aspect of their culture or heritage compared with 11% of third generation or higher.

Reasons for hiding heritage vary by nativity

Bar chart showing U.S.-born Asians more likely to hide their heritage from non-Asians

Asian American adults who said they had hidden some aspects of their culture were asked to share their reasoning for doing so in an open-ended question. The responses from those who answered the question highlighted several different situations ranging from fear of being embarrassed to wanting to avoid awkward questions or having to explain themselves, and even concern of potential discrimination.

In addition, there were differences in the words and phrases U.S.-born Asian Americans used compared with Asian immigrants. Here, pointwise mutual information identified the words and phrases more likely to be included in responses from U.S.-born Asian adults compared with foreign-born Asian adults (and vice versa).6 Responses from U.S.-born respondents included terms such as “lack [of] understanding,” which often referred to dealing with non-Asians having a general lack of knowledge of their heritage. Other words and phrases more likely to be included by U.S.-born respondents were ones that related to fears such as “fear [of] discrimination” or avoiding other negative experiences such as being “bullied,” “teased” or “mocked.”

The reasons given by Asian immigrants for hiding aspects of their heritage highlighted similar themes in their open-ended responses but included distinctive words and phrases unique to their own immigrant experiences. For example, responses from foreign-born Asians were more likely to include phrases like “want [to] explain,” which was often in reference to the extra effort sometimes needed to explain aspects of their heritage to non-Asians. Similarly foreign-born respondents were more likely to include the phrase “American culture.” Other terms more likely to be included by those born in another country related to fears of or a desire to avoid “prejudice” or situations that would make them “[feel] uncomfortable.”

Overall, many of these open-ended responses echoed some of the experiences described by participants in Pew Research Center’s 2021 focus group research. Among the topics covered, participants shared their experiences about how they think about their identity as well as their interactions with others. Some of the themes that emerged from these focus group discussions highlighted the general lack of knowledge or familiarity during interactions with others (non-Asians and Asians alike), as well as the experience of focus group participants frequently having to explain themselves and their heritage to others.

Connections with other Asian Americans, politics and political parties

Bar chart showing Majority of Asian adults say what happens to Asians in the U.S. affects their own lives

Aside from questions on personal and perceived identities, Asian adults were asked about how connected they feel with Asians living in the U.S. Overall, the majority (59%) of Asian adults say that what happens to Asians living in the U.S. affects what happens in their own lives.

National Asian connections

Across the six largest Asian origin groups, about half or more say that what happens to Asians in the U.S. has an impact on their own lives. But this view varies by origin group, with Korean (67%) and Chinese (65%) adults having a stronger sense of connection to what happens to other Asians in the country compared with Indian (55%), Filipino (54%) and Vietnamese (52%) adults.

In addition, about two-thirds (68%) of Asian adults ages 18 to 29 say that what happens to other Asians in the U.S. affects their lives at least some, a higher share than among Asians 65 and older (46%). And higher shares of those with a college degree compared with those with some college or less say what happens to U.S. Asians affects their own lives a lot or some.

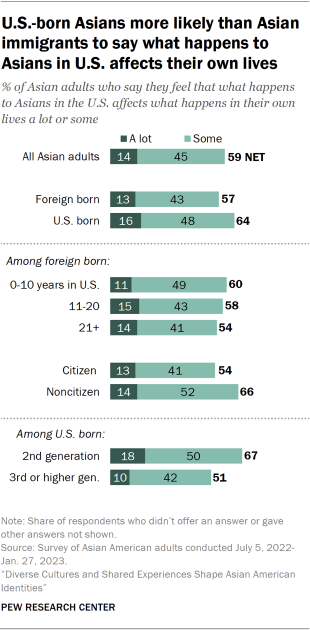
Bar chart showing U.S.-born Asians more likely than Asian immigrants to say what happens to Asians in U.S. affects their own lives

Feelings about shared fates with other U.S. Asians extend across immigrant generations. U.S.-born Asian adults are more likely than Asian immigrants to say that what happens to Asians in the U.S. overall affects what happens in their own lives (64% vs. 57%). This linkage is even stronger for second-generation Asian adults, with about two-thirds saying the same (67%). However, feelings of shared fates with other U.S. Asians fall to about half (51%) among third- and higher-generation Asian adults. 

Among Asian immigrants, non-U.S. citizens (66%) are more likely than naturalized U.S. citizens (54%) to say that what happens to Asians in the U.S. affects their own lives, though majorities of both groups hold this view. This connection with other Asians in the U.S. declines for immigrants who have been in the U.S. for more than 20 years when compared with those who arrived within the last 10 years (54% vs. 60% respectively).

Need for a national leader advancing the concerns of Asian Americans

Bar chart showing most Asian Americans say it is extremely or very important to have a national leader advancing their concerns

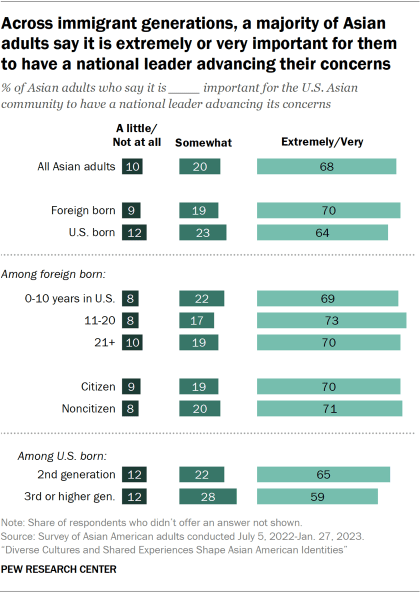
About two-thirds of Asian Americans (68%) say it is extremely or very important for the U.S. Asian community to have a national leader advancing its concerns, while just 10% say it is a little or not at all important.

Most Asian adults among all the largest ethnic groups say a national leader is important. Roughly three-in-four Filipino (74%) and Chinese (73%) adults say it is very or extremely important for the U.S. Asian community to have a national leader advancing its concerns. Majorities of Vietnamese (69%), Korean (66%), Japanese (63%) and Indian adults (62%) say the same.

Bar chart showing across immigrant generations, a majority of Asian adults say it is extremely or very important for them to have a national leader advancing their concerns

A higher share of Asian American women (73%) than men (64%) say having a national leader is extremely or very important, though large majorities of both groups say so.

In addition, 70% of immigrant Asian adults say having a national leader advancing Asian community concerns is at least very important, a slightly higher share than among U.S.-born Asian adults (64%).

Asian American registered voters and political party

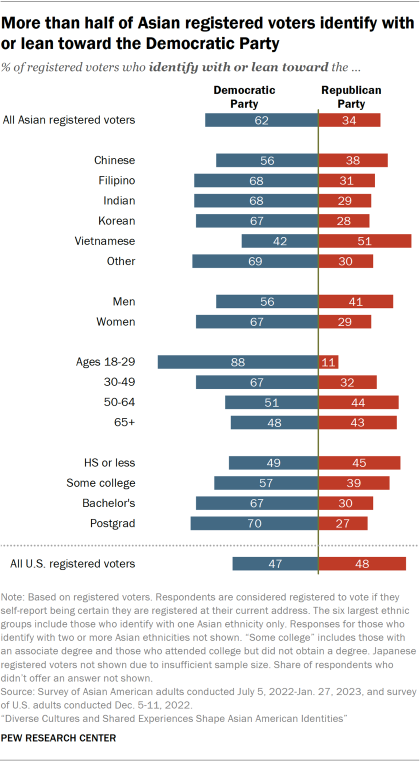
Bar chart showing more than half of Asian registered voters identify with or lean toward the Democratic Party

When it comes to political life, Asian Americans represent some of the fastest growing parts of the electorate across the country. A majority of Asian adults who are registered to vote think of themselves as Democrats or lean Democratic (62%) rather than as Republicans or Republican leaners (34%).

In contrast, U.S. registered voters overall are about evenly split between Democrats (47%) and Republicans (48%).

Across origin groups, about two-in-three Filipino (68%), Indian (68%) and Korean (67%) registered voters identify with or lean toward the Democratic Party. A slightly smaller majority of Chinese registered voters (56%) identify as or lean Democratic, while about half of Vietnamese registered voters (51%) identify with or lean to the Republican Party.
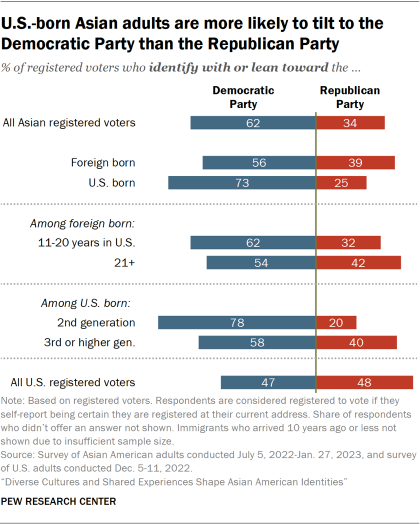
Bar chart showing U.S.-born Asian adults are more likely to tilt to the Democratic Party than the Republican Party

The extent to which Asian voters associate with each of the major parties also varies across other demographic characteristics such as gender, age and education. Indeed, a greater share of Asian women (67%) who are registered to vote identify as Democrats when compared with Asian men (56%). There are also wide differences by educational attainment, with 70% of Asian voters with a postgraduate degree identifying as or leaning Democratic compared with about half (49%) of those with a high school education or less.

About six-in-ten of those who have spent 11 to 20 years in the U.S. (62%) identify as Democratic, compared with 54% among those who have lived in the U.S. for more than 20 years. There also are generational differences among Asian voters born in the U.S., with a larger share of second-generation Asians associating with the Democratic Party (78%) compared with those who are third or higher generation (58%).

About one-quarter of Asian adults say they are informed about U.S. Asian history

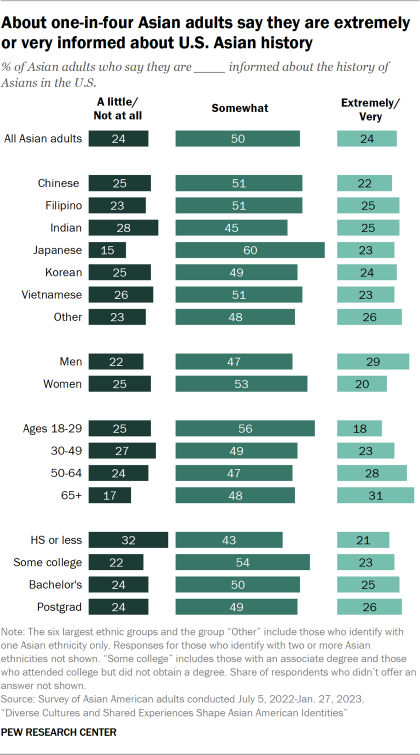
Bar chart showing about one-in-four Asian adults say they are extremely or very informed about U.S. Asian history

Asian Americans have a history in the United States that spans the nation’s lifetime. This history includes Chinese laborers who helped build the first transcontinental railroad and the subsequent Chinese Exclusion Act, Japanese incarceration during World War II, as well as Filipinos entering as U.S. nationals during the exclusion era, the influx of refugees following wars in Southeast Asia, and since 1960, the arrival of more than 14.7 million immigrants from Asia.

Yet just about one-in-four Asian adults (24%) say they are extremely or very informed about U.S. Asian history, according to the new survey of Asian Americans. Half say they are somewhat informed about U.S. Asian history, while another quarter (24%) say they are little or not at all informed.

The new survey shows there are differences in Asian adults’ knowledge of U.S. Asian history by several demographic characteristics such as age, gender, immigrant status and years since arrival in the U.S.

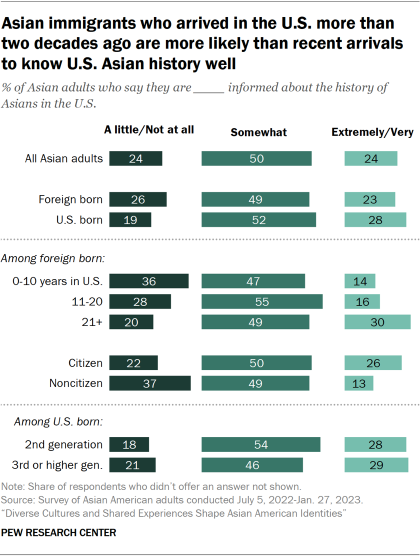
Bar chart showing Asian immigrants who arrived in the U.S. more than two decades ago are more likely than recent arrivals to know U.S. Asian history well

Asian adults ages 65 and older are more likely than those 18 to 29 to say they are extremely or very informed about U.S. Asian history (31% vs. 18%). And Asian men are more likely than Asian women to say they are very or extremely informed (29% vs. 20%). Meanwhile, U.S.-born Asian adults (28%) are slightly more likely than those who are immigrants (23%) to say they are substantially informed about Asian history in the U.S. Among immigrants, how many years they have lived in the U.S. is also related to differences in knowledge of U.S. Asian history.

Bar chart showing Asian adults most likely to learn about U.S. Asian history from the internet and media

Three-in-ten Asian immigrants who have been in the country for more than two decades say they are extremely or very informed about U.S. Asian history, higher than the share among those who have been in the country 10 years or less (14%). And Asian immigrants who are U.S. citizens (26%) are more likely than noncitizen Asian immigrants (13%) to say they are extremely or very informed.

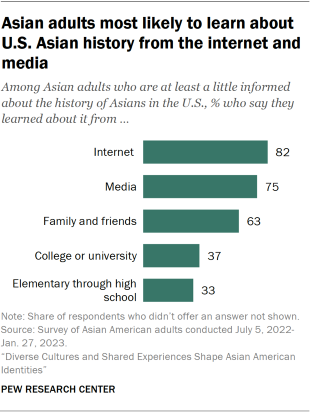
Among those who say they are at least a little informed about U.S. Asian history, most say they learned it from the internet (82%) or media (75%), while 63% say they learned from family and friends. Fewer Asian adults say they learned about it in a classroom setting, with 37% saying they learned in their college or university years and 33% while they attended elementary through high school.

What being ‘truly American’ means to U.S. Asians

Bar chart showing nearly all Asian adults say accepting racial and religious diversity and belief in individual freedoms are important for being truly American

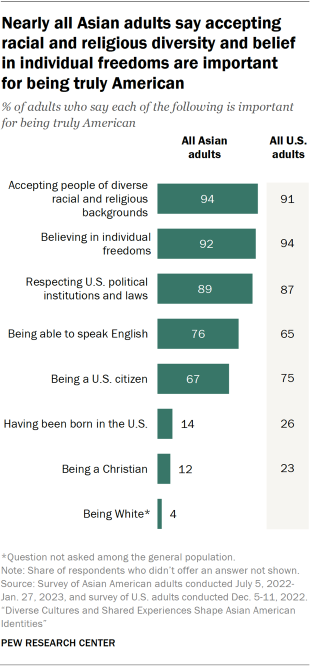
When it comes to being “truly American,” most Asian adults agree acceptance of people of diverse racial and religious backgrounds (94%), believing in individual freedoms (92%) and respecting U.S. political institutions (87%) are important.

Meanwhile, just 14% say having been born in the U.S. is important for being truly American and 12% say the same about being Christian.

Asian Americans’ views about what is important for being truly American are similar to those of the general U.S. adult population. Almost all U.S. adults say accepting diverse backgrounds (91%), believing in individual freedoms (94%) and respecting U.S. political institutions (87%) are important for being truly American.

Still, differences between Asian Americans and the general population do emerge on other traits. For example, Asian Americans are more likely than the general population to say being able to speak English is important for being truly American (76% vs. 65%) but less likely to say that being a U.S. citizen is important (67% vs. 75%). Meanwhile, the general public is more likely than Asian Americans to say it is important to be born in the U.S. or to be Christian to be considered truly American. For example, 26% of U.S. adults say being born in the U.S. is important to be truly American. Just 14% of Asian Americans say the same.

Fewer than half of U.S. Asians consider themselves typical Americans

Bar chart showing U.S.-born Asian adults more likely than Asian immigrants to say they think of themselves as typical Americans

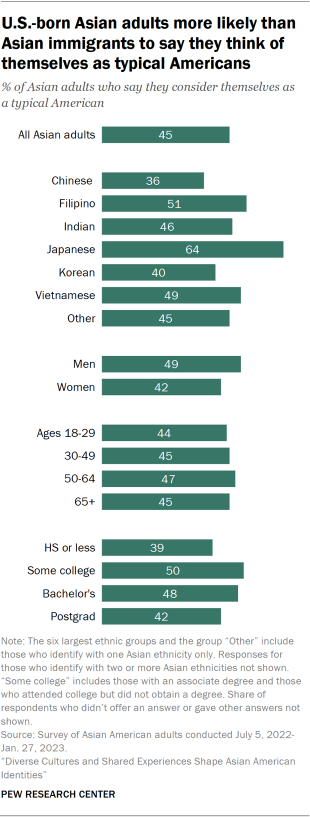
Asian Americans are split on whether they see themselves as typical Americans. Slightly fewer than half (45%) of Asian adults say they consider themselves “a typical American,” while 52% say they are “very different from a typical American.”

Among the largest Asian American ethnic groups, Japanese adults (64%) are more likely than Asian adults in general to say they think of themselves as typical Americans. By comparison, about half of Filipino (51%), Vietnamese (49%) and Indian (46%) adults say they think of themselves this way. And fewer than half of Korean (40%) and Chinese (36%) adults say the same. Meanwhile, about half of Asian men (49%) say they consider themselves typical Americans, a higher share than among women (42%).

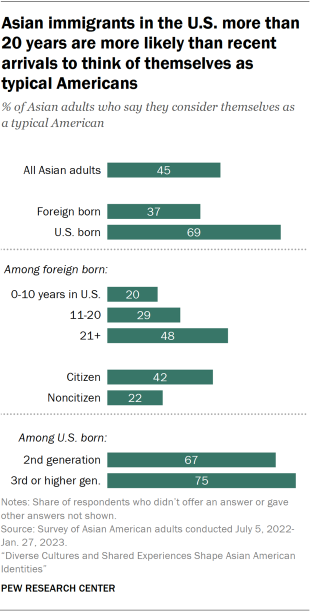
Overall, U.S.-born Asians (69%) are more likely than those who are immigrants (37%) to say they are typical Americans.

Bar chart showing Asian immigrants in the U.S. more than 20 years are more likely than recent arrivals to think of themselves as typical Americans

Among immigrants, about half of Asian adults who have been in the U.S. more than 20 years (48%) say they consider themselves typical Americans. This is more than double the share saying this among those who arrived in the past 10 years (20%). Naturalized citizens are also more likely than noncitizens to say they think of themselves as typical Americans (42% vs. 22%).  

What do Asian Americans view as important for the American dream?

Bar chart showing Asian adults broadly agree freedom of choice, a good family life, comfortable retirement and opportunity for children are part of the American dream

Nearly all Asian adults (96%) say that having freedom of choice to live one’s life, having a good family life and retiring comfortably are important to their view of the American dream. Meanwhile, far fewer say becoming wealthy (60%) or owning a business (30%) are important.

Compared with Asian adults, similar shares of the general U.S. adult population say freedom of choice (97%), a good family life (94%) and retiring comfortably (94%) are important to their view of the American dream.

And when it comes to the milestone of owning a home, Asian adults and the general population are just as likely to say it is important (86% each).

However, the general population is less likely than Asian Americans to say having a successful career (79%) and making valuable contributions to their community (72%) are important to their view of the American dream, though large majorities of both groups hold these views.

Most Asian adults say the American dream is within reach, but about a quarter say they will never achieve it

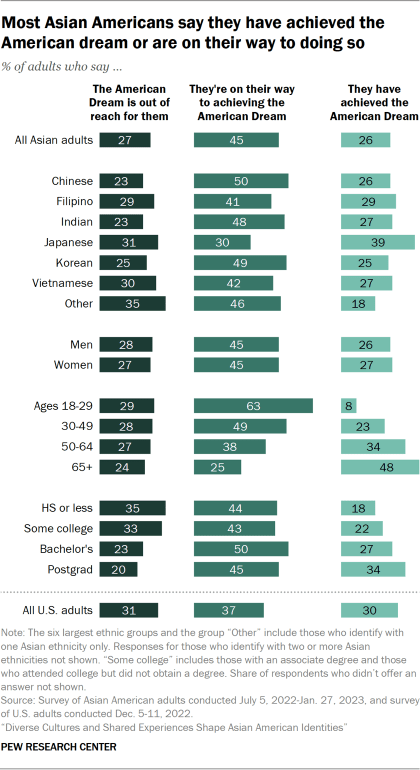
Bar chart showing most Asian Americans say they have achieved the American dream or are on their way to doing so

About seven-in-ten Asian adults (72%) believe they are on their way to achieving the American dream (45%) or that they have already achieved it (26%). Yet 27% say the American dream is out of reach for them.

Among the largest ethnic origins, Japanese adults (39%) are the only group that is more likely than Asian Americans overall to say they have achieved the American dream. Still, large majorities of each of the largest ethnic origin groups say they either have achieved the American dream or are on their way to doing so.

There are other important differences among U.S. Asians. Older Asian adults are more likely than younger Asian adults to say they have achieved the American dream. About half (48%) of those ages 65 and older say they have achieved the American dream, a higher share than for all other age groups among Asian adults. And while those 18 to 29 are the least likely to say they have achieved the American dream (8%), they are the most likely age group to say that they are on their way to achieving it (63%).

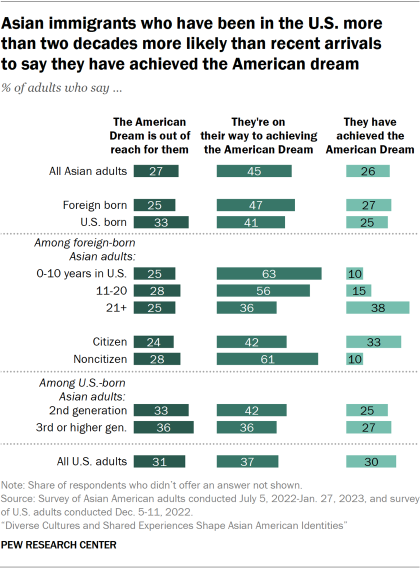
Bar chart showing Asian immigrants who have been in the U.S. more than two decades more likely than recent arrivals 
to say they have achieved the American dream

Asian immigrants are slightly more likely than those born in the U.S. to say they’re on their way to achieving the American dream – 47% vs. 41%. At the same time, those born in the U.S. (33%) are more likely than those born abroad (25%) to say it is out of reach for them.  

Among Asian immigrants, 38% of those who have lived in the U.S. for more than two decades say they have achieved the American dream, while just 10% of those who arrived in the past 10 years say the same. At the same time, 63% of those who have been in the U.S. 10 years or less say they are on their way to achieving it.

When compared with the general U.S. adult population, Asian Americans differ slightly in their views of the American dream and in achieving it. U.S. adults overall are slightly more likely than Asian adults to say they have achieved the American dream (30%) or that it is out of reach for them (31%) but less likely to say they are on their way to achieving it (37%).

Acknowledgments

Pew Research Center is a subsidiary of The Pew Charitable Trusts, its primary funder. The Center’s Asian American portfolio was funded by The Pew Charitable Trusts, with generous support from The Asian American Foundation; Chan Zuckerberg Initiative DAF, an advised fund of the Silicon Valley Community Foundation; the Robert Wood Johnson Foundation; the Henry Luce Foundation; the Doris Duke Foundation; The Wallace H. Coulter Foundation; The Dirk and Charlene Kabcenell Foundation; The Long Family Foundation; Lu-Hebert Fund; Gee Family Foundation; Joseph Cotchett; the Julian Abdey and Sabrina Moyle Charitable Fund; and Nanci Nishimura.

We would also like to thank the Leaders Forum for its thought leadership and valuable assistance in helping make this survey possible.

The strategic communications campaign used to promote the research was made possible with generous support from the Doris Duke Foundation.

This report was written by Neil G. Ruiz, head of new research initiatives and associate director of race and ethnicity research; Luis Noe-Bustamante, research associate; and Sono Shah, computational social scientist.

Many individuals contributed to this study’s design, data collection and methodology. This survey and the subsequent reports from it would not be possible without Senior Methodologist Ashley Amaya, who designed the survey’s methodology, managed the long fielding period with Westat, and helped with the questionnaire development. The entire project was expertly managed by Luis Noe-Bustamante. Noe-Bustamante also managed a team that carried out the survey’s data processing and included temporary Research Associate Abby Budiman, Research Assistant Carolyne Im, Research Methodologist Arnold Lau and Research Assistant Lauren Mora.

Ruiz and former Research Associate Sunny Shao led the development of the survey questionnaire with help from Amaya, Research Associate Khadijah Edwards, Research Assistant Mohamad Moslimani, Mora and Noe-Bustamante. Senior Demographer Jeffrey Passel provided advice on the demographic analysis. Pew Research Center is also grateful to Westat’s Mike Brick, Ismael Flores Cervantes, Eric Jodts and Hanna Popick for their many contributions to this project.

Director of Race and Ethnicity Research Mark Hugo Lopez provided editorial guidance over the project, including the survey questionnaire, report and related products. The report was number-checked by Im, Mora and Moslimani. The tabulation plan was developed by Im, Mora, Moslimani and Noe-Bustamante with guidance from Panel Manager Dorene Asare-Marfo, Research Methodologist Anna Brown and Associate Panel Manager Dana Popky. Senior Copy Editor David Kent copy edited the report. The report was produced by Digital Producer Shannon Greenwood.

The communications and outreach strategy for the report was led by Communications Manager Hannah Klein, with help from Communications Manager Tanya Arditi and Communications Associates Mimi Cottingham, Gar Meng Leong and Julia O’Hanlon. The charts and illustrations were designed by former Senior Information Graphics Designer Michael Keegan, as well as Budiman, Im, Mora and Noe-Bustamante.

Pew Research Center is grateful to a panel of expert advisers who provided advice at all stages of this survey and report’s development: Yến Lê Espiritu, Distinguished Professor of Ethnic Studies at University of California, San Diego; Devesh Kapur, Starr Foundation Professor of South Asian Studies at Johns Hopkins School of Advanced International Studies; Anthony Christian Ocampo, Professor of Sociology at California State Polytechnic University, Pomona; Karthick Ramakrishnan, Professor of Public Policy at the University of California, Riverside; Janelle Wong, Professor of American Studies and Asian American Studies at the University of Maryland; and Yang Sao Xiong, Assistant Professor at College of Social Sciences at California State University, Fresno.

Find related reports online at www.pewresearch.org/AsianAmericans

Methodology

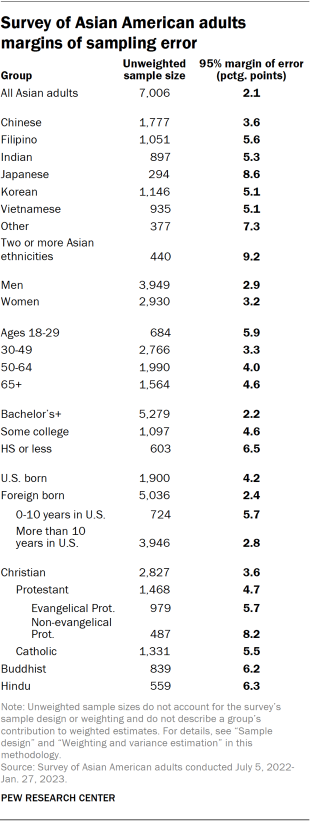
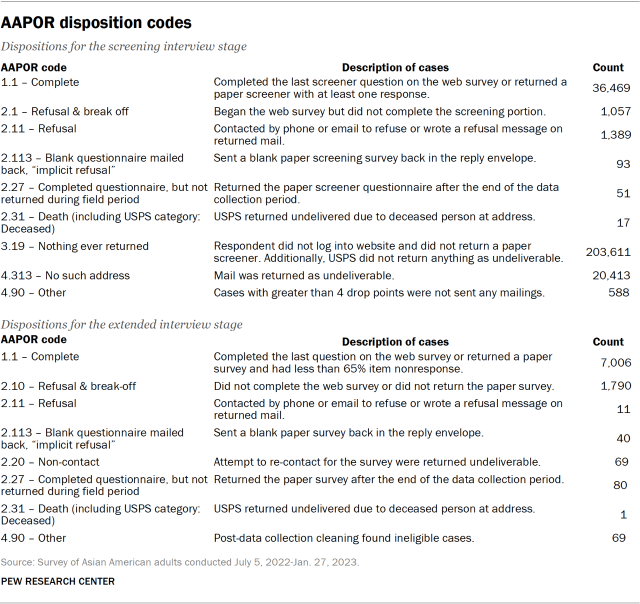
The data in this report is drawn from a national cross-sectional survey conducted for Pew Research Center by Westat. The sampling design of the survey was an address-based sampling (ABS) approach, supplemented by list samples, to reach a nationally representative group of respondents. The survey was fielded July 5, 2022, through Jan. 27, 2023. Self-administered screening interviews were conducted with a total of 36,469 U.S. adults either online or by mail, resulting in 7,006 interviews with Asian American adults. It is these 7,006 Asian Americans who are the focus of this report. After accounting for the complex sample design and loss of precision due to weighting, the margin of sampling error for these respondents is plus or minus 2.1 percentage points at the 95% level of confidence.

Table showing Asian American adults margins of sampling error

The survey was administered in two stages. In the first stage, a short screening survey was administered to a national sample of U.S. adults to collect basic demographics and determine a respondent’s eligibility for the extended survey of Asian Americans. Screener respondents were considered eligible for the extended survey if they self-identified as Asian (alone or in combination with any other race or ethnicity). Note that all individuals who self-identified as Asian were asked to complete the extended survey.

To maintain consistency with the Census Bureau’s definition of “Asian,” individuals responding as Asian but who self-identified with origins that did not meet the bureau’s official standards prior to the 2020 decennial census were considered ineligible and were not asked to complete the extended survey or were removed from the final sample. Those excluded were people solely of Southwest Asian descent (e.g., Lebanese, Saudi), those with Central Asian origins (e.g., Afghan, Uzbek) as well as various other non-Asian origins. The impact of excluding these groups is small, as together they represent about 1%-2% of the national U.S. Asian population, according to a Pew Research Center analysis of the 2021 American Community Survey.

Eligible survey respondents were asked in the extended survey how they identified ethnically (for example: Chinese, Filipino, Indian, Korean, Vietnamese, or some other ethnicity with a write-in option). Note that survey respondents were asked about their ethnicity rather than nationality. For example, those classified as Chinese in the survey are those self-identifying as of Chinese ethnicity, rather than necessarily being a citizen or former citizen of the People’s Republic of China. Since this is an ethnicity, classification of survey respondents as Chinese also includes those who are Taiwanese.
The research plan for this project was submitted to Westat’s institutional review board (IRB), which is an independent committee of experts that specializes in helping to protect the rights of research participants. Due to the minimal risks associated with this questionnaire content and the population of interest, this research underwent an expedited review and received approval (approval # FWA 00005551).

Throughout this methodology statement, the terms “extended survey” and “extended questionnaire” refer to the extended survey of Asian Americans that is the focus of this report, and “eligible adults” and “eligible respondents” refer to those individuals who met its eligibility criteria, unless otherwise noted.

Sample design

The survey had a complex sample design constructed to maximize efficiency in reaching Asian American adults while also supporting reliable, national estimates for the population as a whole and for the five largest ethnic groups (Chinese, Filipino, Indian, Korean and Vietnamese). Asian American adults include those who self-identify as Asian, either alone or in combination with other races or Hispanic identity.
The main sample frame of the 2022-2023 Asian American Survey is an address-based sample (ABS). The ABS frame of addresses was derived from the USPS Computerized Delivery Sequence file. It is maintained by Marketing Systems Group (MSG) and is updated monthly. MSG geocodes their entire ABS frame, so block, block group, and census tract characteristics from the decennial census and the American Community Survey (ACS) could be appended to addresses and used for sampling and data collection.

All addresses on the ABS frame were geocoded to a census tract. Census tracts were then grouped into three strata based on the density of Asian American adults, defined as the proportion of Asian American adults among all adults in the tract. The three strata were defined as:

  • High density: tracts with an Asian American adult density of 10% or higher
  • Medium density: tracts with a density 3% to less than 10%
  • Low density: tracts with a density less than 3%

Mailing addresses in census tracts from the lowest density stratum, strata 3, were excluded from the sampling frame. As a result, the frame excluded 54.1% of the 2020 census tracts, 49.1% of the U.S. adult population, including 9.1% of adults who self-identified as Asian alone or in combination with other races or Hispanic ethnicity. For the largest five Asian ethnic subgroups, Filipinos had the largest percentage of excluded adults with 6.8%, while Indians had the lowest with 4.2% of the adults. Addresses were then sampled from the two remaining strata. This stratification and the assignment of differential sampling rates to the strata were critical design components because of the rareness of the Asian American adult population.

Despite oversampling of the high- and medium-density Asian American strata in the ABS sample, the ABS sample was not expected to efficiently yield the required number of completed interviews for some ethnic subgroups. Therefore, the ABS sample was supplemented with samples from the specialized surnames list frames maintained by the MSG. These list frames identify households using commercial databases linked to addresses and telephone numbers. The individuals’ surnames in these lists could be classified by likely ethnic origin. Westat requested MSG to produce five list frames: Chinese, Filipino, Indian, Korean and Vietnamese. The lists were subset to include only cases with a mailing address. Addresses sampled from the lists, unlike those sampled from the ABS frame, were not limited to high- and medium-density census tracts.

Once an address was sampled from either the ABS frame or the surname lists, an invitation was mailed to the address. The invitation requested that the adult in the household with the next birthday complete the survey.

Data collection

To maximize response, the survey used a sequential mixed-mode protocol in which sampled households were first directed to respond online and later mailed a paper version of the questionnaire if they did not respond online.

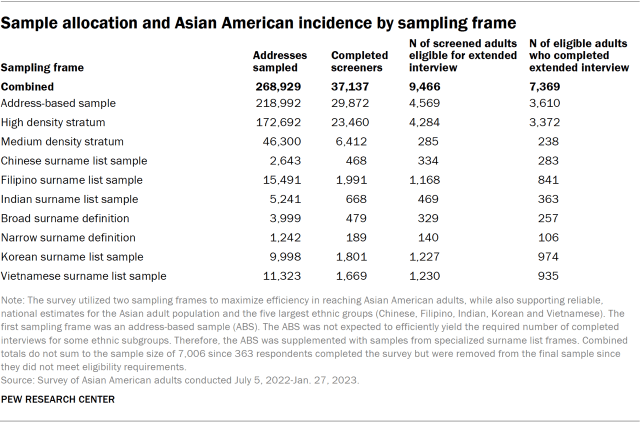
Table showing sample allocation and Asian American incidence by sampling frame

The first mailing was a letter introducing the survey and providing the information necessary (URL and unique PIN) for online response. A pre-incentive of $2 was included in the mailing. This and remaining screener recruitment letters focused on the screener survey, without mentioning the possibility of eligibility for a longer survey and associated promised incentive, since most people would only be asked to complete the short screening survey. It was important for all households to complete the screening survey, not just those who identify as Asian American. As such, the invitation did not mention that the extended survey would focus on topics surrounding the Asian American experience. The invitation was generic to minimize the risk of nonresponse bias due to topic salience bias.

After one week, Westat sent a postcard reminder to all sampled individuals, followed three weeks later by a reminder letter to nonrespondents. Approximately 8.5 weeks after the initial mailing, Westat sent nonrespondents a paper version screening survey, which was a four-page booklet (one folded 11×17 paper) and a postage-paid return envelope in addition to the cover letter. If no response was obtained from those four mailings, no further contact was made.

Eligible adults who completed the screening interview on the web were immediately asked to continue with the extended questionnaire. If an eligible adult completed the screener online but did not complete the extended interview, Westat sent them a reminder letter. This was performed on a rolling basis when it had been at least one week since the web breakoff. Names were not collected until the end of the web survey, so these letters were addressed to “Recent Participant.”

If an eligible respondent completed a paper screener, Westat mailed them the extended survey and a postage-paid return envelope. This was sent weekly as completed paper screeners arrived. Westat followed these paper mailings with a reminder postcard. Later, Westat sent a final paper version via FedEx to eligible adults who had not completed the extended interview online or by paper.

Incentives

A pre-incentive of $2 (in the form of two $1 bills) was sent to all sampled addresses with the first letter, which provided information about how to complete the survey online. This and subsequent screener invitations only referred to the pre-incentive without reference to the possibility of later promised incentives.

Respondents who completed the screening survey and were found eligible were offered a promised incentive of $10 to go on and complete the extended survey. All participants who completed the extended web survey were offered their choice of a $10 Amazon.com gift code instantly or $10 cash mailed. All participants who completed the survey via paper were mailed a $10 cash incentive.

In December 2022 a mailing was added for eligible respondents who had completed a screener questionnaire, either by web or paper but who had not yet completed the extended survey. It was sent to those who had received their last mailing in the standard sequence at least four weeks earlier. It included a cover letter, a paper copy of the extended survey, and a business reply envelope, and was assembled in a 9×12 envelope with a $1 bill made visible through the envelope window.

In the last month of data collection, an additional mailing was added to boost the number of Vietnamese respondents. A random sample of 4,000 addresses from the Vietnamese surname list and 2,000 addresses from the ABS frame who were flagged as likely Vietnamese were sent another copy of the first invitation letter, which contained web login credentials but no paper copy of the screener. This was sent in a No. 10 envelope with a wide window and was assembled with a $1 bill visible through the envelope window.

Languages

The mail and web screening and extended surveys were developed in English and translated into Chinese (Simplified and Traditional), Hindi, Korean, Tagalog and Vietnamese. For web, the landing page was displayed in English initially but included banners at the top and bottom of the page that allowed respondents to change the displayed language. Once in the survey, a dropdown button at the top of each page was available to respondents to toggle between languages.

The paper surveys were also formatted into all six languages. Recipients thought to be more likely to use a specific language option, based on supplemental information in the sampling frame or their address location, were sent a paper screener in that language in addition to an English screener questionnaire. Those receiving a paper extended instrument were sent the extended survey in the language in which the screener was completed. For web, respondents continued in their selected language from the screener.

Weighting and variance estimation

Household-level weighting

The first step in weighting was creating a base weight for each sampled mailing address to account for its probability of selection into the sample. The base weight for mailing address k is called BWk and is defined as the inverse of its probability of selection. The ABS sample addresses had a probability of selection based on the stratum from which they were sampled. The supplemental samples (i.e., Chinese, Filipino, Indian, Korean and Vietnamese surname lists) also had a probability of selection from the list frames. Because all of the addresses in the list frames are also included in the ABS frame, these addresses had multiple opportunities for these addresses to be selected, and the base weights include an adjustment to account for their higher probability of selection.

Each sampled mailing address was assigned to one of four categories according to its final screener disposition. The categories were 1) household with a completed screener interview, 2) household with an incomplete screener interview, 3) ineligible (i.e., not a household, which were primarily postmaster returns), and 4) addresses for which status was unknown (i.e., addresses that were not identified as undeliverable by the USPS but from which no survey response was received).

The second step in the weighting process was adjusting the base weight to account for occupied households among those with unknown eligibility (category 4). Previous ABS studies have found that about 13% of all addresses in the ABS frame were either vacant or not home to anyone in the civilian, non-institutionalized adult population. For this survey, it was assumed that 87% of all sampled addresses from the ABS frame were eligible households. However, this value was not appropriate for the addresses sampled from the list frames, which were expected to have a higher proportion of households as these were maintained lists. For the list samples, the occupied household rate was computed as the proportion of list cases in category 3 compared to all resolved list cases (i.e., the sum of categories 1 through 3). The base weights for the share of category 4 addresses (unknown eligibility) assumed to be eligible were then allocated to cases in categories 1 and 2 (known households) so that the sum of the combined category 1 and 2 base weights equaled the number of addresses assumed to be eligible in each frame. The category 3 ineligible addresses were given a weight of zero.

The next step was adjusting for nonresponse for households without a completed screener interview to create a final household weight. This adjustment allocated the weights of nonrespondents (category 2) to those of respondents (category 1) within classes defined by the cross-classification of sampling strata, census region, and sample type (e.g., ABS and list supplemental samples). Those classes with fewer than 50 sampled addresses or large adjustment factors were collapsed with nearby cells within the sample type. Given the large variance in the household weights among the medium density ABS stratum, final household weights for addresses within this stratum were capped at 300.

Weighting of extended survey respondents

The extended interview nonresponse adjustment began by assigning each case that completed the screener interview to one of three dispositions: 1) eligible adult completed the extended interview; 2) eligible adult did not complete the extended interview; and 3) not eligible for the extended interview.

An initial adult base weight was calculated for the cases with a completed extended interview as the product of the truncated number of adults in the household (max value of 3) and the household weight. This adjustment accounted for selecting one adult in each household.

The final step in the adult weighting was calibrating the adult weights for those who completed the extended interview so that the calibrated weights (i.e., the estimated number of adults) aligned with benchmarks for non-institutionalized Asian adults from the 2016-2020 American Community Surveys Public Use Microdata Sample (PUMS). Specifically, raking was used to calibrate the weights on the following dimensions:

  1. Ethnic group (Chinese, Filipino, Indian, Japanese, Korean, Vietnamese, other single Asian ethnicities, and multiple Asian ethnicities)
  2. Collapsed ethnic group (Chinese, Filipino, Indian, Korean, Vietnamese, all other single and multiple Asian ethnicities) by age group
  3. Collapsed ethnic group by sex
  4. Collapsed ethnic group by census region
  5. Collapsed ethnic group by education
  6. Collapsed ethnic group by housing tenure
  7. Collapsed ethnic group by nativity
  8. Income group by number of persons in the household

The control totals used in raking were based on the entire population of Asian American adults (including those who live in the excluded stratum) to correct for both extended interview nonresponse and undercoverage from excluding the low-density stratum in the ABS frame.

Variance estimation

Because the modeled estimates used in the weighting are themselves subject to sampling error, variance estimation and tests of statistical significance were performed using the grouped jackknife estimator (JK2). One hundred sets of replicates were created by deleting a group of cases within each stratum from each replicate and doubling the weights for a corresponding set of cases in the same stratum. The entire weighting and modeling process was performed on the full sample and then separately repeated for each replicate. The result is a total of 101 separate weights for each respondent that have incorporated the variability from the complex sample design.7

Response rates

Westat assigned all sampled cases a result code for their participation in the screener, and then they assigned a result for the extended questionnaire for those who were eligible for the survey of Asian Americans. Two of the dispositions warrant some discussion. One is the category “4.313 No such address.” This category is for addresses that were returned by the U.S. Postal Service as not being deliverable. This status indicates the address, which was on the USPS Delivery Sequence File at the time of sampling, currently is not occupied or no longer exists. The second category is “4.90 Other.” This category contains 588 addresses that were never mailed because they had a drop count of greater than four. Drop points are addresses with multiple households that share the same address. The information available in the ABS frame on drop points is limited to the number of drop points at the address, without information on the type of households at the drop point, or how they should be labeled for mailing purposes. In this survey, all drop points were eligible for sampling, but only those with drop point counts of four or fewer were mailed. Westat treated drop point counts of five or more as out of scope, and no mailing was done for those addresses.

Westat used the disposition results to compute response rates consistent with AAPOR definitions. The response rates are weighted by the base weight to account for the differential sampling in this survey. The AAPOR RR3 response rate to the screening interview was 17.0%.8 The RR1 response rate to the extended Asian American interview (77.9%) is the number of eligible adults completing the questionnaire over the total sampled for that extended questionnaire. The overall response rate is the product of the screener response rate and the conditional response rate for the extended questionnaire. The overall response rate for the Asian American sample in the Pew Research Center survey was 13.3% (17.0% x 77.9%).

Table showing AAPOR disposition codes

Identifying ‘distinctive’ language in open-ended responses to hiding heritage from others

As part of the survey, respondents were asked if they have ever hidden a part of their heritage from people who are not Asian. Those who answered yes were asked in a follow-up open-ended question on why they do so. Pointwise mutual information was used to identify the 100 most distinctive terms that distinguish responses from U.S.-born and foreign-born respondents. The terms identified through this method represent the language that characterizes how respondents from either group answered the open-ended question.

Appendix: Demographic profile of Asian American adults

About 17.8 million Asian adults live in the United States, accounting for 7% of the total adult population, according to a Pew Research Center analysis of the 2021 American Community Survey. This population has roughly doubled since 2000, when 8.7 million Asian adults lived in the country.

This demographic profile of Asian Americans focuses on the Asian adult population, matching the population explored by the new survey and report.

Largest origin groups

Chinese adults are the largest Asian American ethnic origin group, accounting for 22% of the total Asian adult population.9 They are followed by Indian (20%) and Filipino (17%) adults, each making up roughly one-in-five Asian American adults. Vietnamese (9%), Korean (8%) and Japanese (6%) adults round up the top six largest Asian ethnic origin groups in the U.S. Together, these six groups make up 81% of all Asian American adults.

Age

In 2021, the median age of Asian American adults was 43 years old. Among the largest six Asian ethnic origin groups, Indian adults were the youngest, with a median age of 40 years old. Meanwhile the median age is similar across Chinese (45 years), Filipino (45 years), Korean (45 years) and Vietnamese (46 years) adults. At a median age of 49 years, Japanese adults are the oldest among the largest groups.

Among all U.S. adults, the median age is 47 years old.

Educational attainment

In terms of educational attainment, about half of Asian American adults (51%) had a bachelor’s degree or higher in 2021. Yet there are wide differences in educational attainment by origin groups. Among the largest six origin groups, Indian Americans have the highest educational attainment, with 72% having a college degree or more. More than half of Korean (56%) and Chinese (55%) adults also hold a bachelor’s degree or more, while lower shares of Japanese (50%) and Filipino (45%) do so. And Vietnamese adults (33%) are the least likely of these groups to hold at least a college degree.

By comparison, 32% of all U.S. adults have a bachelor’s degree or more.

Dot plot showing 51% of U.S. Asian adults have a bachelor’s degree or more education

Immigration status

Column chart showing immigrant shares vary among the six largest origin groups (Indian, Vietnamese, Chinese, Korean, Filipino, and Japanese)

When it comes to nativity, most Asian adults in the U.S. (68%) are immigrants. Among the largest ethnic groups, Indian adults have the highest share who were born abroad (83%), followed by Vietnamese (74%), Chinese (72%), Korean (69%) and Filipino (61%) adults. By contrast, 30% of Japanese adults are immigrants, making them the only group among the largest six to be majority U.S. born (70%).

Among all U.S. adults, 17% are immigrants.

Length of time living in the U.S. among immigrants

Bar chart showing Indian immigrants are the most likely of the largest groups to have arrived in the past decade

Among immigrant adults, about half (51%) have lived in the U.S. more than 20 years. Roughly one-in-four (27%) arrived in the past 10 years and about 23% have lived in the country between 11 and 20 years.

How long Asian immigrants have lived in the U.S. also varies depending on origin. Roughly two-thirds of Korean immigrant adults (66%) arrived in the U.S. over two decades ago, making them the most likely to be long-term residents among the six largest origin groups. Still, about half or more than half of Vietnamese (62%), Filipino (57%), Japanese (53%) and Chinese (51%) immigrants have been in the country more than 20 years. 

On the other hand, Indian adults are the most likely to be recent arrivals. About four-in-ten Indian immigrants (39%) arrived in the U.S. in the past decade, compared with 15% of Korean immigrants – the smallest share among the six largest groups.

Citizenship status among immigrants

Stacked bar chart showing nearly two-thirds of Asian immigrants are naturalized citizens

In addition, 64% of Asian immigrant adults were naturalized U.S. citizens in 2021. The naturalization rate varies among different origin groups, with Vietnamese adults having the highest percentage of naturalized citizens among the largest six at 78%. Filipino and Korean adults also have relatively high naturalization rates, at 76% and 69% respectively. A smaller share of Chinese immigrant adults (61%) are citizens. Meanwhile, Indian and Japanese immigrant adults have the lowest naturalization rates, at 53% and 35% respectively.

By comparison, 55% of all U.S. immigrants are naturalized citizens.

Table showing demographics of U.S. Asian adult population
Table showing demographics of the U.S. Asian adult population by origin