Pew Research Center

FOR RELEASE JANUARY 20, 2022

One-in-Ten Black People Living in the U.S. Are Immigrants

Immigrants – particularly those from African nations – are a growing share of the U.S. Black population

BY Christine Tamir and Monica Anderson

FOR MEDIA OR OTHER INQUIRIES:

Communications Department
202.419.4372
www.pewresearch.org

RECOMMENDED CITATION

Pew Research Center, January 2022, "One-in-Ten Black People Living in the U.S. Are Immigrants"

About Pew Research Center

Pew Research Center is a nonpartisan, nonadvocacy fact tank that informs the public about the issues, attitudes and trends shaping the world. It does not take policy positions. The Center conducts public opinion polling, demographic research, computational social science research and other data-driven research. It studies politics and policy; news habits and media; the internet and technology; religion; race and ethnicity; international affairs; social, demographic and economic trends; science; research methodology and data science; and immigration and migration. Pew Research Center is a subsidiary of The Pew Charitable Trusts, its primary funder.

© Pew Research Center 2026

Table of contents

  • About Pew Research Center
  • One-in-Ten Black People Living in the U.S. Are Immigrants
  • 1. The Caribbean is the largest origin source of Black immigrants, but fastest growth is among African immigrants
  • 2. Over half of Black immigrants arrived in U.S. after 2000
  • 3. A growing share of Black immigrants have a college degree or higher
  • 4. Most Black immigrants live in Northeast, South; New York City has largest Black immigrant population by metro area
  • 5. Household income, poverty status and home ownership among Black immigrants
  • 6. African- and Caribbean-born adults differ on measures of religiosity
  • Acknowledgments
  • Methodology
  • Appendix A: Countries by region and subregion

One-in-Ten Black People Living in the U.S. Are Immigrants

Immigrants – particularly those from African nations – are a growing share of the U.S. Black population

How we did this

The analysis presented in this report about the foreign-born Black population of the United States combines the latest data available from multiple data sources. It is mainly based on data from the U.S. Census Bureau’s 2006-2019 American Community Surveys (ACS) and the following U.S. decennial censuses provided through the Integrated Public Use Microdata Series (IPUMS) from the University of Minnesota: 1980 (5% sample), 1990 (5% sample) and 2000 (5% sample). U.S. Census population projections were used to estimate the size of the single-race Black foreign-born population from 2030 to 2060.

For census years 1980 and 1990, “Black immigrants” and “foreign-born Black population” refer to persons born outside the U.S., Puerto Rico or other U.S. territories whose sole self-identified race is Black, regardless of Hispanic origin. Prior to 2000, respondents to Census Bureau surveys and its decennial census could make only one selection in the race question. In 2000 and later, respondents were able to indicate they were of more than once race.

The ACS is used to present demographic characteristics for each group.

Analysis about the religious beliefs and practices of Black adults is based on the Faith Among Black Americans survey.

Analysis about immigrant generations utilizes the March 2019 Annual Social and Economic Supplement of the Current Population Survey. This data was collected before the COVID-19 pandemic.

Terminology

U.S. Black population and Black population refer to all people who self-identify as Black in the United States. This includes those who say their race is only Black; those who say Black is one of two or more races in their background; and those who say their race is Black, or that one of their races is Black but also indicate they are of Hispanic or Latino or Black origin. The terms Black population and Black people are used interchangeably in this report.

The terms Black immigrants, the Black immigrant population, Black migrants and the foreign-born Black population are used interchangeably throughout the report and refer to persons who were both born outside the United States, Puerto Rico or other U.S. territories to parents neither of whom was a U.S. citizen, and who identify their race as Black. This is inclusive of those who say Black is one of two or more races in their background (regardless of Hispanic origin) in U.S. Census Bureau surveys from 2000 and later. For previous census years (1980 and 1990), “Black immigrants” and “foreign-born Black population” refer to persons born outside the U.S., Puerto Rico or other U.S. territories whose sole self-identified race is Black, regardless of Hispanic origin. Prior to 2000, respondents to Census Bureau surveys and its decennial census could make only one selection in the race question. In 2000 and later, respondents were able to indicate they were of more than once race.

U.S. born refers to those who are U.S. citizens at birth, namely people born in the U.S., Puerto Rico or other U.S. territories and those born abroad to at least one parent who was a U.S. citizen.

U.S. foreign born, U.S. migrants and U.S. immigrants refer to people born outside the U.S., Puerto Rico or other U.S. territories to parents neither of whom was a U.S. citizen. Unless otherwise specified, immigrant population estimates include all immigrants regardless of citizenship or legal status. The terms foreign born, migrant and immigrant are used interchangeably in this report.

Second generation refers to people born in the 50 states, the District of Columbia, Puerto Rico or other U.S. territories with at least one first-generation, or immigrant, parent.

Third generation or higher refers to people born in the 50 states, the District of Columbia, Puerto Rico or other U.S. territories with both parents born in the 50 states, the District of Columbia, Puerto Rico or other U.S. territories.

The lawful immigrant population is defined as naturalized citizens; people granted lawful permanent residence (previously known as legal permanent residence); those granted asylum; people admitted as refugees; and people admitted under a set of specific authorized temporary statuses for longer-term residence and work.

Unauthorized immigrants are all foreign-born noncitizens residing in the country who are not lawful immigrants. These definitions reflect standard and customary usage by the U.S. Department of Homeland Security and academic researchers. The vast majority of unauthorized immigrants entered the country without valid documents or arrived with valid visas but stayed past their visa expiration date or otherwise violated the terms of their admission. Some who entered as unauthorized immigrants or violated terms of admission have obtained work authorization by applying for asylum or adjustment to lawful permanent status, obtaining Temporary Protected Status (TPS) or receiving Deferred Action for Childhood Arrivals (DACA) status. This “quasi-lawful” group could account for as much as 10%-15% of the unauthorized population. Many could also revert to unauthorized status.

In this report, the terms African immigrants, African-born immigrants and immigrants born in Africa are used to describe any immigrants who self-identify as Black and are from any country on the African continent, regardless of sub-region. For a full list of countries in this region, please refer to Appendix A.

In this report, Caribbean immigrants, Caribbean-born immigrants and immigrants born in the Caribbean are any immigrants who self-identify as Black and are from any country in this region. For a full list of countries in this region, please refer to Appendix A.

In this report, the terms Central American immigrants, Central American-born immigrants and immigrants born in Central America are used to refer to any immigrants who self-identify as Black and are from any country in this region. For a full list of countries in this region, please refer to Appendix A.

In this report, the terms South American immigrants, South American-born immigrants and immigrants born in South America are used to refer to any immigrants who self-identify as Black and are from any country in this region. For a full list of countries in this region, please refer to Appendix A.

The Black population of the United States is diverse, growing and changing. The foreign-born segment of this population has played an important role in this growth over the past four decades and is projected to continue doing so in future years.

Bar and line chart showing Black immigrant population climbs to 4.6 million and is projected to reach 9.5 million by 2060

Roughly 4.6 million, or one-in-ten, Black people in the U.S. were born in a different country as of 2019, up from 3% in 1980. By 2060, the U.S. Census Bureau projects that this number will increase to 9.5 million, or more than double the current level (the Census Bureau only offers projections for single race groups).

Between 1980 and 2019, the nation’s Black population as a whole grew by 20 million, with the Black foreign-born population accounting for 19% of this growth. In future years, the Black immigrant population will account for roughly a third of the U.S. Black population’s growth through 2060, according to a new Pew Research Center analysis of U.S. Census Bureau data.

The Black immigrant population is also projected to outpace the U.S.-born Black population in growth. While both groups are increasing in number, the foreign-born population is projected to grow by 90% between 2020 and 2060, while the U.S.-born population is expected to grow 29% over the same time span.

Pie chart showing roughly one-in-five Black people in the U.S. are immigrants or children of Black immigrants

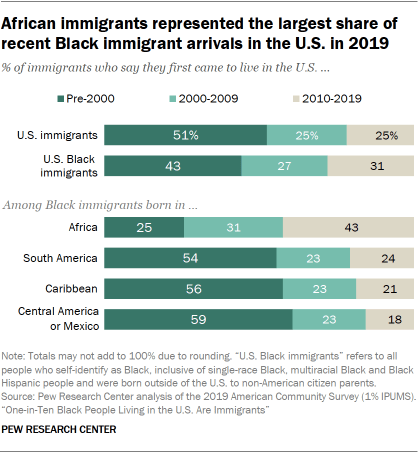
Migration from Africa has fueled the bulk of the growth of the Black foreign-born population from 2000 onward. In 2000, roughly 560,000 African-born Black immigrants lived in the U.S. By 2019, that number had more than tripled to over 1.9 million. And many of these immigrants are newer arrivals to America: 43% of African-born Black immigrants immigrated to the U.S. from 2010 to 2019, higher than the shares among all U.S. immigrants (25%) and Black immigrants from the Caribbean (21%), Central America (18%) and South America (24%) in the same time period.

At the same time, a notable share of Black Americans today are the offspring of immigrants. Roughly 9% of Black people are second-generation Americans – meaning they were born in the U.S., but have at least one foreign-born parent, according to a Center analysis of the March supplement of the Census Bureau’s 2019 Current Population Survey. In total, Black immigrants and their U.S.-born children account for 21% of the overall Black population. 

Bar chart showing Black immigrants differ from U.S.-born Black population, immigrants overall  on income and educational attainment

When it comes to socioeconomic factors, Black immigrants stand out from the U.S.-born Black population and the overall U.S. immigrant population on some measures, such as household income and educational attainment.

For example, a larger share of Black immigrants ages 25 and older have a college degree or higher than does the U.S.-born Black population (31% vs. 22%). However, Black immigrants are about as likely as all U.S. immigrants in the same age group to have a college degree or higher (31% and 33%, respectively).

Households headed by Black immigrants also had a higher median household income in 2019 than those headed by Black Americans born in the U.S. ($57,200 vs. $42,000), but the median household income was higher among all U.S. immigrant-headed households than it was among Black immigrant-headed households ($63,000 vs. $57,200).

Table showing among Black immigrants in 2019, those who were born in an African country are the least likely to have lived in the U.S. for more than two decades

Additionally, there are key differences among Black immigrants born in different regions of the world on measures such as marital status, citizenship, educational attainment and time living in the U.S. For example, over half of Black immigrants born in the Caribbean (56%), Central America or Mexico (59%) and South America (54%) have been in the U.S. 20 years or longer, while just a quarter of Black African immigrants have been in the country for the same time span.

When it comes to religious identity, majorities of both the Black foreign-born and U.S.-born adult populations identify as Protestant, but religious identity and beliefs – such as whether people of faith have a duty to convert nonbelievers – differ among Caribbean- and African-born Black adults.

This report explores the demographic and socioeconomic characteristics of the nation’s Black immigrant population. It also explores the origins of Black immigrants and the history of Black immigration to the U.S., as well as the religious composition of this population.

1. The Caribbean is the largest origin source of Black immigrants, but fastest growth is among African immigrants

The vast majority of Black immigrants are from two regions: the Caribbean and Africa. These two areas accounted for 88% of all Black foreign-born people in the United States in 2019.

Area chart showing Black immigration from Africa to U.S. more than tripled from 2000 to 2019

Black immigrants from Africa have been the primary driver for much of the overall recent growth in the Black immigrant population. Between 2000 and 2019, the Black African immigrant population grew 246%, from roughly 600,000 to 2.0 million. As a result, people of African origin now make up 42% of the overall foreign-born Black population, a substantial increase from 2000 when that share was 23%.

Still, the Caribbean remains the most common region of birth for Black immigrants. Just under half of the foreign-born Black population were born in this region (46%). Jamaica and Haiti are the two largest origin countries, accounting for 16% and 15% of Black immigrants, respectively.

Beyond Africa and the Caribbean, about one-in-ten Black immigrants (8%) were born in South America, Central America, or Mexico, while relatively small shares are from Europe (2%) or Asia (1%).

A brief history of Black immigration to the U.S.

The trans-Atlantic slave trade marked the beginning of the Black population in the U.S., with the first record of an enslaved African person in the U.S. in 1619. The importation of enslaved African people persisted until 1808, when this practice was outlawed. By 1810, there was already a significant U.S. Black population (19% of the overall population, according to the 1810 decennial census). Restrictive immigration policies on non-Western Europeans after the U.S. Civil War slowed the voluntary migration of Black people to the U.S. until the mid-20th century.

The most recent wave of voluntary Black immigration – as well as the arrival of immigrants from Latin America, Asia and the Middle East – is mostly due to changing immigration policies over the 20th century, such as the Immigration and Nationality Act of 1965. The 1965 act marked a departure from the United States’ previous long-standing national origins quota system (which restricted the ability of immigrants from outside Western Europe to move to the U.S.) to a new system that emphasized family reunification and skilled immigrants. Black immigration to the U.S. would later be expanded further with the Refugee Act of 1980.

The 1980 act both created a definition for refugees and created a system for refugee admissions. This act also allowed for the refugee ceiling to be amended in emergency situations, such as the large influx of the refugee situation created by the Vietnam War in the late 1970s. The act also paved the way for refugees from countries such as the Democratic Republic of the Congo, Eritrea and Ethiopia to come to the U.S. in more recent years. A decade later, the Immigration Act of 1990 created the Diversity Immigrant Visa Program to encourage immigration from countries that did not send many people to the U.S. The Diversity Immigrant Visa program increased the number of immigrants from Sudan, Ethiopia and Kenya, among other countries.

Jamaica and Haiti remain top countries of origin for Black immigrants

Table showing top birthplaces for Black immigrants  in U.S., 2000 and 2019

The top 10 countries of origin accounted for 69% of the foreign-born Black population in 2000 and 66% in 2019. All of these countries are in Africa or the Caribbean.

Though there have been some shifts in the top countries of origin for Black immigrants to the U.S., Jamaica and Haiti have been the top two countries, respectively, in both 2000 and 2019. In 2000, those two Caribbean nations accounted for almost four-in-ten (39%) Black immigrants, but in 2019, their collective share had decreased to 31%, indicating a greater diversity of Black immigrants to the U.S. Nigeria and Ethiopia were the top birthplaces for Black African immigrants to the U.S. in 2019, with roughly 390,000 and 260,000 immigrants, respectively.

Some countries of origin have seen large increases since 2000. Kenya has seen the largest increase, with 348% growth, and there has been an almost 300% increase in the number of Ethiopian-born immigrants from 2000 to 2019. The Somali-born population in the U.S. has seen a 205% increase in the population of immigrants to the U.S., while the number of Black immigrants from Nigeria and Ghana have grown almost 200%. There have been similar increases in the number of Black immigrants from the Dominican Republic (144%). Jamaica and Haiti have seen more modest increases, with 42% and 68% increases respectively since 2000.

The legal status of Black immigrants

Black immigrants more likely than immigrants overall to be naturalized U.S. citizens

Bar chart showing Black immigrants more likely than immigrants overall to be U.S. citizens

The Black foreign-born population differs from the nation’s overall immigrant population on several measures, including the share that gained U.S. citizenship through naturalization. A majority of the Black foreign-born population are naturalized U.S. citizens, which is slightly higher than that of all U.S. immigrants (60% vs. 52%)1. Citizenship rates differ among Black immigrants, with South American- and Caribbean -born immigrants having the highest rates (66% and 65%, respectively). Just over half of African-born Black immigrants hold citizenship (55%), while close to half (48%) of Central American or Mexican-born Black immigrants hold U.S. citizenship.

Admissions to the U.S.2

Column chart showing U.S. immigrants from Africa, Caribbean more than twice as likely as immigrants overall to have refugee status

In fiscal year 2019, roughly 144,000 immigrants from the Caribbean and 92,000 from sub-Saharan Africa were admitted to the U.S., but the ways they entered or had their status adjusted varies by region. About one-quarter of sub-Saharan African and Caribbean legal immigrants in fiscal 2019 were admitted as refuges or asylees, compared with 10% of all immigrants. People from the Democratic Republic of the Congo made up the largest group of African-born people who were admitted entry to the U.S. as refugees or asylees that fiscal year, accounting for 24% of sub-Saharan Africa’s refugees and asylees in the U.S. Cuba made up the largest group of refugees and asylees admitted to the U.S. from the Caribbean, accounting for 98% of all Caribbean-born immigrants admitted as refugees or asylees in fiscal year 2019.

There are also substantial differences in admissions through the diversity visa program. While less than 5% of the fiscal 2019 foreign-born population in the U.S. was admitted through the program, this share is 12% among those from sub-Saharan Africa. The single largest source country among diversity visa admissions from Africa is the Democratic Republic of the Congo. Still, family sponsorship is the most common way for immigrants overall – including those from sub-Saharan Africa or the Caribbean – to enter the U.S. or to adjust their status. The Dominican Republic and Nigeria were the two largest sources of family-sponsored entry to the U.S. in fiscal year 2019.

The foreign-born Black population is less likely than U.S. immigrants overall to be in the country without authorization

Foreign-born Black people are less likely to be in the U.S. without authorization than other U.S. immigrants. There were 625,000 Black immigrants living in the U.S. without authorization in 2017, accounting for 14% of all Black immigrants, according to Pew Research Center estimates. By comparison, 23% of the nation’s nearly 45 million immigrants are unauthorized.

2. Over half of Black immigrants arrived in U.S. after 2000

Almost six-in-ten Black foreign-born people living in the United States (58%) immigrated to the U.S. in 2000 or later, according to a Pew Research Center analysis of the 2019 American Community Survey. Roughly three-in-ten (31%) immigrated to the U.S. between 2010 and 2019, and a little over a quarter (27%) immigrated to the country from 2000 to 2009. By contrast, half of U.S. immigrants overall have immigrated to the country since 2o00, with 25% having immigrated from 2000 to 2009 and another quarter immigrating from 2010 to 2019.

Bar chart showing African immigrants represented the largest share of recent Black immigrant arrivals in the U.S. in 2019

Among Black immigrants, year of immigration differs by region of birth. Black immigrants born in the Caribbean, Central America or Mexico, or South America have, on average, come to the U.S. earlier than their African-born counterparts.

African-born Black immigrants stand out for the recentness of their arrival in the U.S. Three-quarters arrived in the country in 2000 or later, with over four-in-ten (43%) having arrived from 2010 to 2019 alone. Fewer than two-in-ten (16%) arrived between 1990 and 1999, and just 10% arrived in the U.S. prior to 1980. By contrast, fewer than half of those born in the Caribbean, Central America or Mexico, or South America (44%, 41% and 46%, respectively) arrived in the U.S. in 2000 or later, meaning that over half of Black immigrants born in these regions arrived in the U.S. before the turn of the 21st century.

Half of the Black immigrant population is age 43 or older

Bar chart showing Black immigrants have highest median age among the U.S. Black population

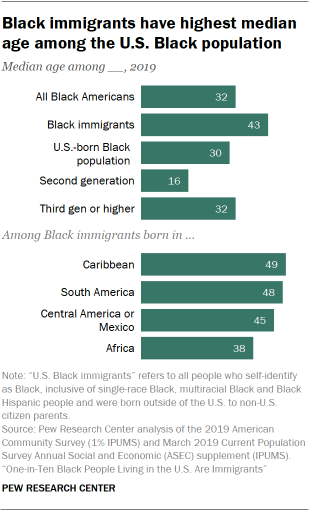
The age structure of the U.S. Black immigrant population has changed since 2000, when the median age was 37, compared with 42 in 2019.

The Black foreign-born population is older than its U.S.-born counterpart. While the median age of the Black immigrant population was 42 in 2019, that of the U.S.-born Black population was 30.

Median ages vary among different generations. Second-generation Black Americans have a median age of 16, making them the youngest generation included in this analysis. Black Americans of third and higher generations have a median age of 32, making this segment of the population younger than Black immigrants.

Age differs among different parts of the Black foreign-born population as well. When it comes to region of origin, the Caribbean-born population has the highest median age, at 49. Black immigrants born in South America have a median age of 48. Those born in Central America or Mexico had a median age of 45, while African-born immigrants had the lowest median age at 38.

Majority of Black immigrants live in family households

Bar chart showing over half of Black immigrants live in a household headed by a married couple

An 80% majority of the Black immigrant population lived in family households in 2019. Overall, just over half (54%) of Black immigrants lived in a household headed by a married couple, while 19% lived in a female-headed household and just 7% lived in a male-headed household.

There are differences among the Black foreign-born population by region of birth. While roughly half or more from the major regions lived in a household headed by a married couple in 2019, the African-born population stands out for having the largest share (58%) who lived in this type of household. Just over half of South American-born immigrants lived in a married-couple household (53%), while roughly half of both Black immigrants born in Central America or Mexico (48%) and those from the Caribbean (50%) lived in a similar household arrangement.

The Black immigrant population differs from the overall U.S. immigrant and U.S.-born Black populations on this measure. Close to two-thirds (65%) of U.S. immigrants lived in a married-couple household in 2019, which is the highest share among population groups included in this analysis. Meanwhile, a six-in-ten majority of the U.S. population lived in a married-couple household as well, while 36% of the U.S.-born Black population lived in this household type.

3. A growing share of Black immigrants have a college degree or higher

Overall, Black immigrants earn college degrees at a similar rate to U.S. immigrants overall. Indeed, 31% of Black immigrants ages 25 and older have a bachelor’s degree or higher  – slightly lower (33%) than the share of the immigrant population in the U.S. with a college degree.

Bar and line chart showing the share of Black foreign-born bachelor’s and advanced degree holders has grown by 10 percentage points since 2000

The share of Black immigrants with at least a bachelor’s degree has risen faster than the share of other populations with a college degree over the same time period. Black immigrants have seen a 10 percentage point increase in the number of bachelor’s degree holders from 2000 to 2019 because of this shift in the makeup of the Black immigrant population. The growth in the number of Black immigrant bachelor’s degree holders is faster than that of the Black U.S.-born population (8 percentage points), the entire U.S.-born population (9 points) and the overall immigration population (9 points) over the same period.

Educational attainment differs by region of origin. All subgroups of the Black immigrant population have seen increases in the share of adults over 25 who have a bachelor’s degree or higher. Caribbean-born and South American-born Black adults saw the largest increases from 2000 to 2019 – a 7 percentage point increase each (16% to 23% for Caribbean-born and 20% to 27% for South American-born Black migrants). Black immigrants from other parts of the world saw more modest increases from 2000 to 2019, including those born in Africa (39% to 41%) and Central America or Mexico (12% to 15%).

Educational attainment varies substantially by region and country of origin

Bar chart showing educational attainment varies among U.S. Black immigrants

Though the rise in educational attainment among foreign-born Black people outpaces that of other populations, having a college degree varies widely by country and region of origin.

Roughly four-in-ten African-born Black adults ages 25 and older (41%) have a bachelor’s degree or higher as of 2019, while roughly a quarter (23%) of Caribbean-born Black adults in the same age range have earned at least a bachelor’s degree.

Black sub-Saharan African immigrants tend to have higher educational attainment than other groups in the U.S. (the region makes up over 40% of the Black African foreign-born population). This is partly due to migratory patterns and mode of entry to the U.S. In general, African-born adults with a college education migrate at higher rates than those with less educational attainment.

Many Black African-born migrants enter the U.S. through the diversity visa program. This program requires recipients to have completed formal courses of elementary and secondary education.

When it comes to countries of origin, 64% of Nigerian-born Black immigrants ages 25 and older have a bachelor’s or advanced degree – more than double the share of the overall Black immigrant population. Roughly half of U.S. Black immigrants from Cameroon and Kenya have a college degree, while that share is about four-in-ten among their Ghanaian counterparts.

By comparison, being a college degree holder is far less common among Black immigrants 25 and older from the Dominican Republic (19%), Haiti (18%) or Somalia (11%).

4. Most Black immigrants live in Northeast, South; New York City has largest Black immigrant population by metro area

The South has the largest share of the Black foreign-born population

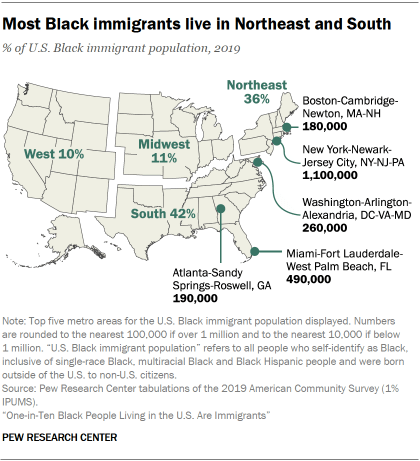
The vast majority of Black immigrants in 2019 lived in either the Northeast or the South (79%). That year, the South was the region with the highest share of the country’s Black immigrant population, with 42% living there. The Northeast had the second-highest share (36%) of the Black immigrant population, while the West and Midwest were each home to roughly one-tenth of this population.

Map showing most Black immigrants live in Northeast and South

Black migrants from different regions of the world settle in different regions of the U.S. For example, the American South was home to the largest share of African-born migrants in 2019 (40%), while roughly one-in-five settled in either the Midwest (22%) or Northeast (20%) and 17% lived in the West. Caribbean-born Black immigrants largely lived in either the Northeast (48%) or the South (47%), with just 3% living in the Midwest and Western regions of the U.S.

Since 2000, the share of African-born Black immigrants who reside in the South has remained about the same, while the share of Caribbean-born Black immigrants who reside in the South has increased by 10 percentage points. The share of Caribbean-born Black immigrants who reside in the Northeast has also fallen over time – in 2000, a 58% majority lived in that region, which dropped to 48% in 2019.

While the populations of Black immigrants in the South, Midwest and West have each at least doubled between 2000 to 2019, the population of Black immigrants in the Northeast has seen a more modest growth of about 41% over the same time span.

More Black immigrants live in New York and Florida than anywhere else in the country

Table showing top 10 states of residence for U.S. Black immigrants

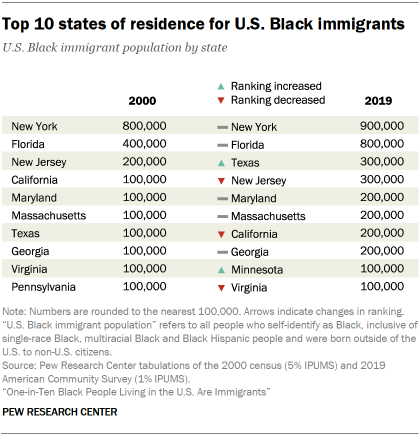
With roughly 900,000 Black immigrants in 2019, New York is home to the largest Black immigrant population in the country and has been since 2000. Florida is home to the second largest population, with roughly 800,000 in 2019. Texas, New Jersey, Maryland and Massachusetts round out the top five states of residence.

Together, the top 10 states of residence for U.S. Black immigrants in 2019 were home to roughly three-quarters of the entire Black immigrant population in the U.S.

In terms of metropolitan areas, New York City has the largest Black immigrant population, with roughly 1.1 million Black immigrants in 2019. The Miami metropolitan area is the second most populous for Black immigrants, with roughly 490,000. The Washington, D.C., area is third for Black immigrants, with a population of roughly 260,000. The Atlanta, Boston, Houston and Dallas areas are among the other top metropolitan areas for Black immigrants in the country.

Some metropolitan areas hold sizable populations of specific nationalities. For example, roughly 260,000 Black Jamaican immigrants live in the New York City metropolitan region as of 2019, equaling 35% of all foreign-born Black Jamaicans in the U.S. The Miami metropolitan area is also home to the nation’s largest Black Haitian immigrant community – more than 35% of Black Haitian immigrants live in this area and account for 4% of the metropolitan area’s population. And roughly 20% of all Ethiopian-born Black immigrants live in the Washington area.

Colorado is the fastest-growing state for Black immigrants in 2019

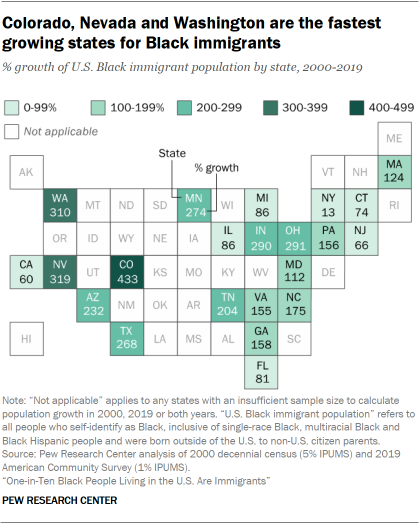
Map chart showing Colorado, Nevada and Washington are the fastest growing states for Black immigrants

Certain states have seen significant growth in their Black immigrant populations since 2000. The state with the fastest growth of the Black immigrant population included in this analysis is Colorado, with over 400% growth from 2000 to 2019, much larger than the state’s general population growth of 34% over the same period.3 Washington, Nevada, Indiana, Ohio, Texas and Minnesota also saw over 250% growth since 2000. Arizona, Tennessee, North Carolina, Georgia, Pennsylvania, Virginia, Maryland and Massachusetts have all seen growth of over 100% for Black immigrants.

Many of the fastest-growing states started off this period with smaller Black immigrant populations. Colorado and Indiana, for example, had Black immigrant populations of less than 10,000 in 2000, but these figures more than doubled by 2019.

The states with the largest shares of Black immigrants, by contrast, might have had lower growth rates over this period but still saw large population growth. New York state’s Black immigrant population growth rate was the lowest among the top 10 states of residence, at just 13%, but the number of Black immigrants increased by almost 110,000. And while Florida’s Black immigrants saw 81% growth from 2000 to 2019, the number living there increased by over 350,000 – making the growth in Florida’s Black immigrant population larger than the entire 2019 Black immigrant populations of Colorado, Arizona, Washington, Nevada, Indiana and Ohio combined.

There has been corresponding population growth in metropolitan areas in the states that experienced significant population growth from 2000 to 2019. In Texas, for example, the Dallas-Fort Worth and Houston-Sugar Land metropolitan areas have seen over 200% growth since 2000. The Minneapolis-St. Paul area in Minnesota has also seen a 249% growth. Other metropolitan areas with notably high population growth rates include Orlando (166%), Atlanta (165%), Philadelphia (121%) and Boston (104%).

5. Household income, poverty status and home ownership among Black immigrants

Household income varies among Black immigrant origin groups

In 2019, Black immigrant-headed households had a lower median income than U.S. immigrant-headed households overall, but a higher median income than households headed by members of the U.S.-born Black population. This pattern has persisted since 2000. That year, the overall immigrant household population’s median income was $58,600, while the Black immigrant household population’s median was $54,700 and the U.S.-born Black household population’s median was $42,500.

The median household income for Black immigrants has slightly increased since 2000 but at a slower pace than that of the overall immigrant population. In 2019, the median household income for the Black immigrant population was $57,200 – lower than the $63,000 U.S. immigrant population household income in 2019 but still higher than the median income in 2000 ($54,700).4 The median income for the entire U.S. immigrant household population increased from 2000 to 2019 ($58,600 to $63,000). When it comes to distribution of income, the overall immigrant population also had a slightly higher share of households earning $50,000 and higher than the Black immigrant population in 2019 (60% vs. 56%).

Table showing Black immigrant household incomes lower than that of the overall U.S. immigrant population but vary among different origin groups, 2019

The household income distribution, however, has changed little since 2000 for the overall Black immigrant population. In 2000 and 2019, similar shares of Black immigrant-headed households (46% and 44%, respectively) made less than $50,000 in 2019 dollars. Roughly three-in-ten in both 2000 and 2019 made $50,000 or more but less than $100,000. The share of Black immigrant households making $100,000 or more was also similar in both 2000 and 2019 (22% and 25%, respectively).

In 2019, household incomes of Black immigrants also differed by region of origin. Households where the household head was born in South America had the highest median income of this population, at $62,000 – the highest among the Black immigrant household population. The median income was next highest among Caribbean-born households ($58,200), followed by those born in Africa ($54,000) and Central America or Mexico ($50,000). Roughly half or more of households headed by someone born in the Caribbean (57%), Africa (55%), South America (59%) and Central America or Mexico (51%) earned at least $50,000 in 2019.

Similar shares of Black immigrants and U.S. immigrants lived below poverty line

Bar chart showing fewer than one-in-five Black immigrants lived below the poverty line in 2019

Some 14% of Black immigrants lived below the poverty line in 2019 (before the COVID-19 pandemic), a rate below that of U.S.-born Black Americans (19%) but higher than the poverty rate among the entire U.S. population (11%).

Roughly similar shares of Black immigrants and all U.S. immigrants lived below the poverty line (14% and 13%, respectively).

Poverty rates within the Black immigrant population vary slightly by region. Fewer than one-in-five African-born (16%) and Central American- or Mexican-born Black immigrants (16%) live below the poverty line, as do 11% and 12% of Caribbean- and South American-born Black immigrants, respectively.

Black immigrant households less likely than overall U.S. immigrant household population to own their homes

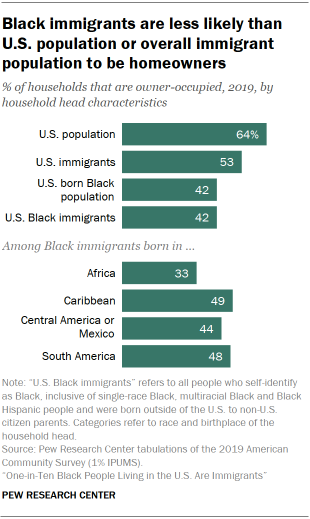
Bar chart showing Black immigrants are less likely than  U.S. population or overall immigrant population to be homeowners

Roughly four-in-ten Black immigrant-headed households (42%) owned their homes in 2019, which matches the rate of home ownership among U.S.-born Black Americans (based on heads of households). However, this share is slightly lower than rate of homeownership among all immigrants (53%) and among the entire U.S. population (64%).

The rate of home ownership varies among Black immigrants from different parts of the world. In 2019, a third of African-born immigrant households owned their homes, while around half of Caribbean immigrant households (49%) owned their homes.

6. African- and Caribbean-born adults differ on measures of religiosity

Although the Census Bureau provides some types of demographic data, it does not collect information on religious identification. However, a Pew Research Center survey of Black adults in the U.S. conducted in 2019-2020 offers some insight into this population’s religious identities.

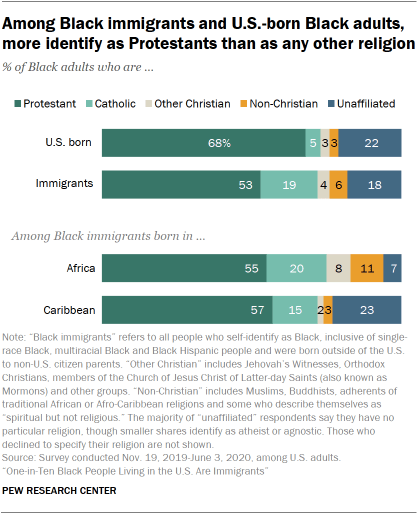
Bar chart showing among Black immigrants and U.S.-born Black adults, more identify as Protestants than as any other religion

While Black adults who are either U.S. born or U.S. immigrants are more likely to identify as Protestant than any other religion, a larger share of the U.S.-born Black population identifies as Protestant. About seven-in-ten Black U.S.-born adults are Protestant (68%), while 53% of the Black immigrant population has this religious affiliation.

A larger share of Black immigrant adults are Catholic than their U.S.-born Black counterparts (19% vs. 5%), and a slightly smaller share are unaffiliated with any religion (18% vs. 22%).

However, religiosity and religious composition vary by origin group among the Black U.S. immigrant population. While many African- and Caribbean-born Black immigrants identify as Protestant (55% and 57%, respectively), Caribbean-born Black immigrants are more likely to be unaffiliated than African-born immigrants (23% vs. 7%).

A similar pattern emerges when it comes to the importance of religion. Large shares of both U.S.-born and immigrant Black adults say that religion is very important to them (59% and 61%, respectively), but there are some differences among African- and Caribbean-born Black adults. While about six-in-ten Caribbean-born Black adults (59%) say religion is very important to them, seven-in-ten (72%) of those born in Africa say the same. African-born Black adults are also significantly more likely than those who are Caribbean born to say that people of faith have a religious duty to try to convert nonbelievers (68% vs. 55%, respectively).

There are less pronounced differences when it comes to whether belief in God is necessary to be moral and have good values. Somewhat similar shares of both U.S.-born and immigrant Black adults say belief in God is necessary to be moral and have good values (54% and 57%, respectively). And over half of both Caribbean-born and African-born adults say it is necessary to believe in God to have good values (59% and 61%).

Acknowledgments

This report was written by Christine Tamir, Research Analyst and Monica Anderson, Associate Director of Research.

Editorial guidance was provided by Neil G. Ruiz, Associate Director of Global Migration and Demography Research; Jeffrey S. Passel, Senior Demographer; Kiana Cox, Research Associate; Tanya Arditi, Communications Manager; Julia O’Hanlon, Communications Associate; and Mark Hugo Lopez, Director of Global Migration and Demography Research.

This report was number-checked by Luis Noe-Bustamante, Research Analyst; Lauren Mora, Research Assistant; and Mohamad Moslimani, Research Assistant. Shannon Greenwood, Digital Producer, produced the report. David Kent, Senior Copy Editor, copy edited the report. Charts were designed by Michael Keegan, Senior Information Graphics Designer. Find related reports online at https://alpha.pewresearch.org/pewresearch-org/topics/race-and-ethnicity/.

Methodology

In this report, we analyzed the detailed demographics and geographic distribution of Black people in the United States. The term “Black” refers to all people who self-identify as Black or African American on census surveys. This report’s analysis is based on Pew Research Center tabulations derived from the following U.S. Census Bureau data: the American Community Survey (2006-2019) and the 2000 U.S. decennial census. U.S. Census population projections were used to estimate the size of the single race Black foreign born population from 2030-2060. Analysis about the religious beliefs and practices of Black adults is based on the Faith Among Black Americans survey.

Detailed demographic and geographic data

Analysis of the detailed demographic and geographic distribution of the Black population in 2019 is based on data from the American Community Survey (ACS), the largest household survey in the United States, with a sample of more than 3 million addresses. It covers the topics previously covered in the long form of the decennial census. The ACS is designed to provide estimates of the size and characteristics of the nation’s resident population, which includes persons living in households and group quarters. For details about the ACS, including its sampling strategy and associated error, see the yearly ACS Accuracy Statement provided by the U.S. Census Bureau.

This report employs public use samples of the U.S. population in the 50 states and Washington D.C. – 1% samples from the 2019, 2015, 2010 and 2006 ACS and samples of the following censuses, all provided through Integrated Public Use Microdata Series (IPUMS) from the University of Minnesota:

1980 census (5% sample)
1990 census (5% sample)
2000 census (5% sample)

IPUMS assigns uniform codes, to the extent possible, to data collected by the decennial census and the ACS from 1850 to 2019. For more information about IPUMS, including variable definition and sampling error, please visit the “IPUMS Documentation and User Guide.”

Appendix A: Countries by region and subregion