Latinos See U.S. as Better Than Place of Family’s Ancestry for Opportunity, Raising Kids, Health Care Access
Most Latino immigrants say they would come to the U.S. again
Pew Research Center conducted this study to understand the views of Hispanics living in the 50 states and the District of Columbia about life in the United States compared with the origin places of their Hispanic ancestors (including Puerto Rico) on a number of dimensions; and whether Hispanics born in Puerto Rico or another country would choose to come to the U.S. again.
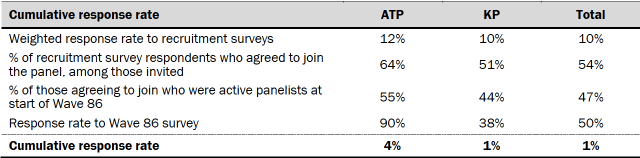
For this analysis we surveyed 3,375 U.S. Hispanic adults in March 2021. This includes 1,900 Hispanic adults on Pew Research Center’s American Trends Panel (ATP) and 1,475 Hispanic adults on Ipsos’ KnowledgePanel. Respondents on both panels are recruited through national, random sampling of residential addresses. Recruiting panelists by phone or mail ensures that nearly all U.S. adults have a chance of selection. This gives us confidence that any sample can represent the whole population (see our Methods 101 explainer on random sampling), or in this case the whole U.S. Hispanic population.
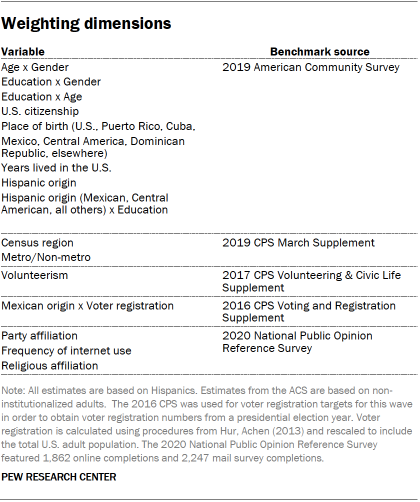
To further ensure the survey reflects a balanced cross-section of the nation’s Hispanic adults, the data is weighted to match the U.S. Hispanic adult population by age, gender, education, nativity, Hispanic origin group and other categories. Read more about the ATP’s methodology. Here are the questions used for our survey of Hispanic adults, along with responses, and its methodology.
The terms Hispanic and Latino are used interchangeably in this report.
U.S. born refers to persons born in the 50 states or the District of Columbia and those born in other countries to parents of whom at least one was a U.S. citizen.
Born in Puerto Rico or another country refers to persons born in Puerto Rico or born outside of the United States to parents of whom neither was a U.S. citizen. Although individuals born in Puerto Rico are U.S. citizens by birth, they are grouped with those born in another country for the purposes of this report for a variety of reasons: They are born into a Spanish-dominant culture, and on many points their attitudes, views and beliefs are much closer to those of Hispanics born outside the U.S. than of Hispanics born in the 50 states or the District of Columbia, even when compared with those who identify themselves as being of Puerto Rican origin.
The phrases place of origin of their ancestors, origin place of their ancestors, ancestors’ place of origin and family’s place of ancestry refer to Puerto Rico and to countries outside the United States where respondents trace their Hispanic family’s roots.
Second generation refers to people born in the 50 states or the District of Columbia, with at least one parent born in Puerto Rico or another country.
Third and higher generation refers to people born in the 50 states or the District of Columbia, with both parents born in the 50 states or the District of Columbia.
Skin color is self-assessed based on a 10-step scale, ranging from lightest (1) to darkest (10). Latinos with lighter skin color selected 1-4 on the scale while Latinos with darker skin color skin selected 5-10. For more, see this report.
For many Latinos, the United States offers a chance at a better life than the place their Latino ancestors came from in several ways. A strong majority say the U.S. provides more opportunities to get ahead than their ancestors’ place of origin. Majorities also say the U.S. has better conditions for raising kids, access to health care and treatment of the poor, according to a Pew Research Center national survey of 3,375 Latino adults conducted in March 2021.

Hispanics hold these positive views of the U.S. whether they were born in Puerto Rico, in another country, or in the 50 states or the District of Columbia.
However, Latinos do not see the U.S. as better on all measures. About half of Latino adults (48%) see family ties as better in the origin place of their ancestors (Puerto Rico or another country) than in the United States. About another quarter (27%) say the strength of family ties is about the same in both places, while 22% say family ties are better in the U.S.
Hispanics are split on whether the U.S. or the origin place of their Hispanic ancestors treats immigrants better. About one-third (34%) say immigrants are treated better in the U.S., while 38% say there is no difference between the treatment of immigrants in the U.S. and their treatment in Puerto Rico or another country. Another quarter (25%) of Hispanics say immigrants are treated better in the place of their Hispanic ancestors.
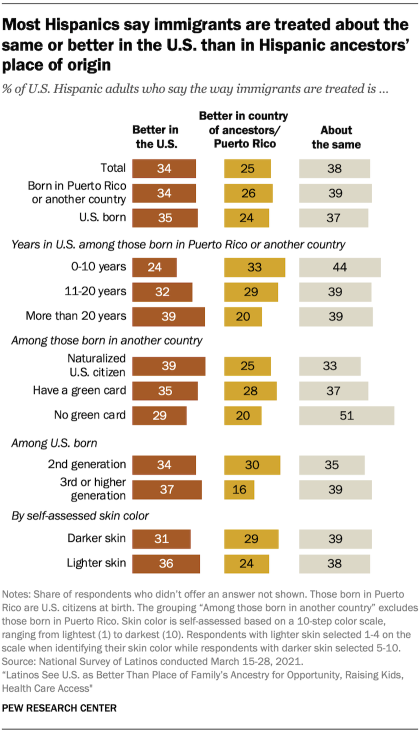
Hispanics hold similar views about the treatment of immigrants whether they are U.S. born or not. However, views vary depending on how long those born in Puerto Rico or another country have lived in the 50 states or the District of Columbia. For example, among those who arrived in the last 10 years, 33% say immigrants are treated better in the place of their birth than in the U.S., a greater share than the 24% who say the opposite. On the other hand, nearly four-in-ten (39%) of those who arrived more than 20 years ago say immigrants are treated better in the U.S. Views also vary depending on legal status among those born in another country – roughly half (51%) of Hispanic immigrants who are neither U.S. citizens nor hold a green card (and are likely in the country without authorization) say the treatment of immigrants is about the same in the U.S. as in their place of ancestry.
Among U.S.-born Latinos, three-in-ten second-generation Latinos – the U.S.-born children of immigrants or Puerto Rico-born parents – say immigrants are treated better in Puerto Rico or the birth country of their parents. By comparison, 16% of third or higher-generation Latinos say the same.
The survey also asked Hispanics born in Puerto Rico or another country about discrimination based on race or skin color in the U.S. and their place of origin. Four-in-ten (40%) say there is no difference on this measure between the U.S. and their place of origin. Another 26% indicate discrimination based on race and skin color is not an issue in the place of their birth. However, some Hispanics born in Puerto Rico or another country see differences between their place of origin and the U.S. – 17% say this type of discrimination is better in their place of origin than in the U.S., while 15% say it is worse.
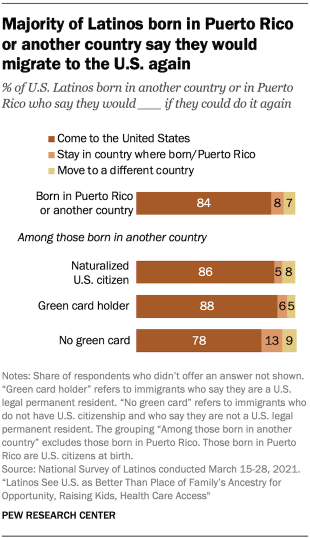
Despite these mixed views about life in the U.S., most Latinos born in either Puerto Rico or another country (84%) say that if they had to make the choice again, they would migrate to the U.S. Mostly similar shares also say so across immigrant groups by legal status, including 78% of those who are not U.S. citizens and do not have a green card.
Much smaller shares of Hispanics born in Puerto Rico or another country say they would not come to the U.S. again. Some 8% say they would stay where they were born, and another 7% say they would migrate to someplace other than the U.S. Among Hispanic immigrants who do not hold U.S. citizenship or a green card, a group likely in the country without authorization, 13% say they would stay in their home country if they had to do it again.
Latinos born in another country were also asked whether they had considered leaving the United States since the start of the coronavirus outbreak in February 2020. About nine-in-ten Latino immigrants (88%) say they have not considered this. Meanwhile, 5% say they did consider returning to their home country and 4% thought about leaving the U.S. for another country.
The arrival of millions of immigrants from Latin America over the past half century, and an ongoing migration from Puerto Rico, continues to shape the demographics of the U.S. Hispanic population. In 2019, 19.8 million Hispanics living in the U.S. were born in another country, accounting for one-third (33%) of the U.S. Hispanic population. The share of Hispanics born in another country rises to 45% among Hispanics ages 18 and older, according to Pew Research Center tabulations of the U.S. Census Bureau’s American Community Survey. In addition, 1.9 million people born in Puerto Rico were living in the 50 states or the District of Columbia in 2019, making up 3% of all Hispanics and 4% of Hispanic adults.
Since 1965, people from Latin America have accounted for about half of the 59 million immigrants who have come to the United States from around the world. In 2019, Hispanic immigrants living in the U.S. made up 44% of the nation’s 44.7 million immigrants. A quarter of the U.S. immigrant population, or 11.4 million, is from Mexico alone, far more than any other country. And over the past decade, growing numbers of immigrants have arrived from countries like Venezuela, Guatemala, Honduras, El Salvador and the Dominican Republic. More recently, many immigrants from Central America and elsewhere have arrived seeking asylum, with border crossings reaching half-decade highs in the past year.
Hispanics say the opportunity to get ahead is better in the U.S. than in place of ancestry
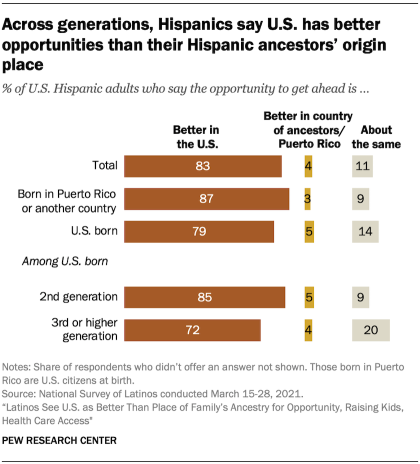
About eight-in-ten U.S.-born Hispanics (79%) say the opportunity to get ahead is better in the U.S. than in their ancestors’ place of origin, with large majorities across generations saying so. The share rises to 87% among Hispanics born in Puerto Rico or another country.
Among the U.S. born, 85% of second-generation Hispanics say the U.S. provides better opportunities than Puerto Rico or their ancestors’ home country, a similar share to Hispanics born in Puerto Rico or another country. Meanwhile, third- or higher-generation Hispanics are less likely than other groups to say opportunity is better in the U.S. than in the origin place of their ancestors. Even so, nearly three-quarters (72%) hold this view.
Latinos see U.S. as better for raising kids than origin place of ancestors
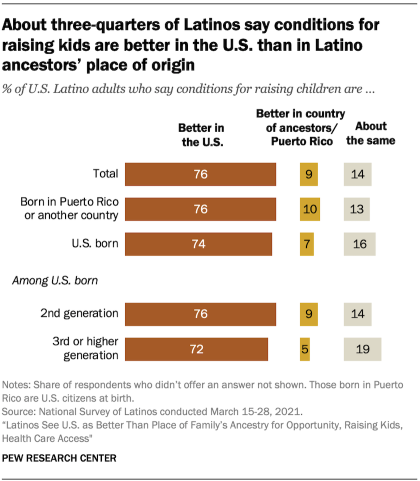
About three-quarters of Latino adults (76%) say the U.S. has better conditions for raising children than the origin place of their ancestors. Another 14% say conditions are about the same, and about one-in-ten (9%) say conditions are better in their place of ancestry. Latinos share this view regardless of birthplace or immigrant generation.
A majority of Hispanics say access to health care is better in the U.S. than in their family’s place of ancestry
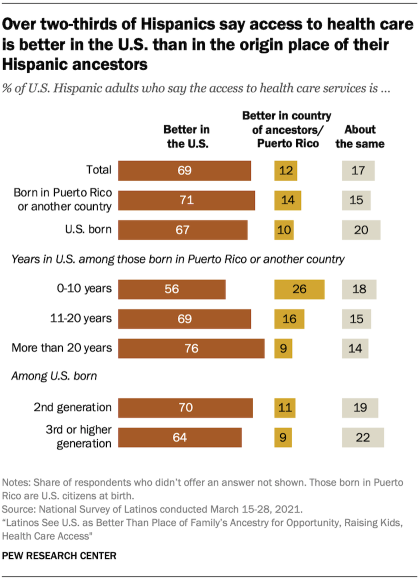
Over two-thirds of U.S. Hispanic adults (69%) say access to health care services is better in the U.S. than in the origin place of their ancestors. Meanwhile, about one-in-ten (12%) say access to health care services is better in the place of their family’s ancestry than in the U.S., while 17% say that access is about the same in both places.
A majority of Latinos share this view no matter their nativity. Some 71% of Latinos born in Puerto Rico or another country say health care access is better in the U.S. than in the place of their ancestry, while 67% of U.S.-born Latinos say the same. Views vary only slightly across generations. A higher share of second-generation Latinos than third- or higher-generation Latinos say that access to health care is better in the U.S. (70% vs. 64%).
Regardless of when they arrived, a majority of Hispanics who came from Puerto Rico or another country says the U.S. is better for access to health care. However, only 56% of those who arrived 10 years ago or less say this, compared with 76% of those who arrived over 20 years ago. About a quarter (26%) of more recent arrivals, 10 years or less, say health care is better in their origin place. This view is shared by only 9% of those who arrived over 20 years ago and 16% of those who arrived between 11 and 20 years ago.
These findings come amid the COVID-19 pandemic, which has had a large personal and health impact on the lives of U.S. Hispanics.
Among Latinos, those born in Puerto Rico or another country are more likely than the U.S. born to say the poor are treated better in the U.S.
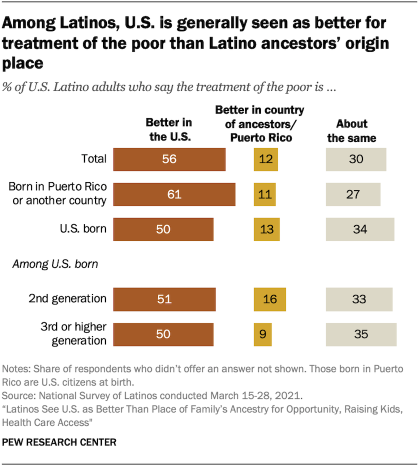
More than half of all Hispanic adults (56%) say treatment of the poor is better in the U.S. than their family’s place of ancestry, while 30% say it is about the same and 12% say it is better in Puerto Rico or in the country of their ancestors.
Hispanics born in Puerto Rico or another country are more likely than those born in the U.S. to say treatment of the poor is better in the U.S. than in the place of their ancestors (61% vs. 50%).
Hispanics say strength of family ties is better in ancestors’ place of origin than in U.S.
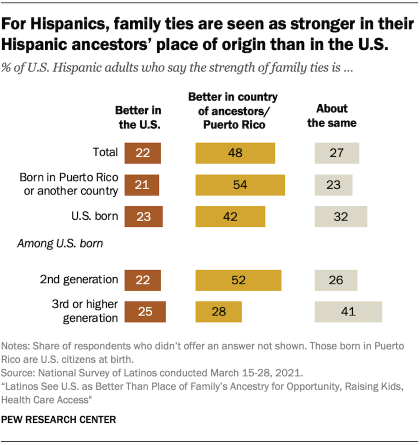
Nearly half (48%) of U.S. Hispanics say the strength of family ties is better in their family’s place of ancestry than in the U.S. Large shares of both Hispanics born in Puerto Rico or another country and Hispanics born in the 50 states or D.C. hold this view, though those born in Puerto Rico or another country are more likely to do so (54% vs. 42%).
Notably, only 28% of third- or higher-generation Hispanics say family ties are better in the origin place of their ancestors than in the U.S., significantly less than the share of second-generation Hispanics and Hispanics born in another country or Puerto Rico who say the same (52% and 54% respectively).