Pew Research Center

FOR RELEASE MAY 14, 2021

Black and Hispanic Americans See Their Origins as Central to Who They Are, Less So for White Adults

About half of Americans see their identity reflected very well in census race and ethnicity questions

BY D’Vera Cohn, Anna Brown and Mark Hugo Lopez

FOR MEDIA OR OTHER INQUIRIES:

Communications Department
202.419.4372
www.pewresearch.org

RECOMMENDED CITATION

Pew Research Center, May 2021, "Black and Hispanic Americans See Their Origins as Central to Who They Are, Less So for White Adults"

About Pew Research Center

Pew Research Center is a nonpartisan, nonadvocacy fact tank that informs the public about the issues, attitudes and trends shaping the world. It does not take policy positions. The Center conducts public opinion polling, demographic research, computational social science research and other data-driven research. It studies politics and policy; news habits and media; the internet and technology; religion; race and ethnicity; international affairs; social, demographic and economic trends; science; research methodology and data science; and immigration and migration. Pew Research Center is a subsidiary of The Pew Charitable Trusts, its primary funder.

© Pew Research Center 2026

Table of contents

  • About Pew Research Center
  • Black and Hispanic Americans See Their Origins as Central to Who They Are, Less So for White Adults
  • 1. Americans’ origins and connections to their families’ roots
  • 2. Only about half of Americans say census questions reflect their identity very well
  • 3. Hispanic identity and immigrant generations
  • Acknowledgments
  • Methodology

Black and Hispanic Americans See Their Origins as Central to Who They Are, Less So for White Adults

About half of Americans see their identity reflected very well in census race and ethnicity questions

How we did this

Pew Research Center conducted this study to better understand how Americans think of their own racial and ethnic identities and how that maps onto the race and ethnicity questions that appeared on the 2020 census.

For this analysis, we surveyed 3,535 U.S. adults in January 2020. The adults who were surveyed are members of Ipsos Public Affairs’ KnowledgePanel, an online survey panel that is recruited through national, random sampling of residential addresses and landline and cellphone numbers. KnowledgePanel provides internet access for those who do not have it and, if needed, a device to access the internet when they join the panel. To ensure that the results of this survey reflect a balanced cross section of the nation, the data is weighted to match the U.S. adult population by gender, age, education, race and ethnicity and other categories. The survey was conducted in English and Spanish.

Here are the questions used for this report, along with responses, and its methodology.

Six-in-ten Americans say they are very familiar with their origins. Black and Hispanic adults feel more connected to roots than White adults

Most Americans say they are very familiar with their roots, but the strength of their attachment to them varies by race and Hispanic origin, according to a Pew Research Center survey conducted to explore themes of self-identity ahead of last year’s U.S. decennial census. Black and Hispanic adults were more likely than White adults to say their origins are central to their identity and that they feel a strong connection to their family’s cultural roots.

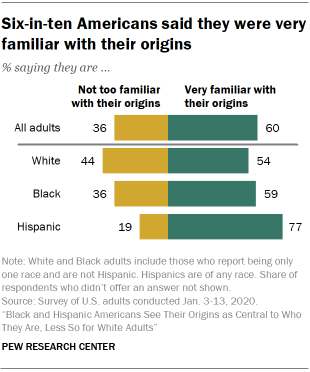
Overall, six-in-ten U.S. adults said they are very familiar with their origins, according to the survey. But not quite half (46%) said they feel a strong connection to their family’s cultural roots. And only a third said their origin is central to their identity.

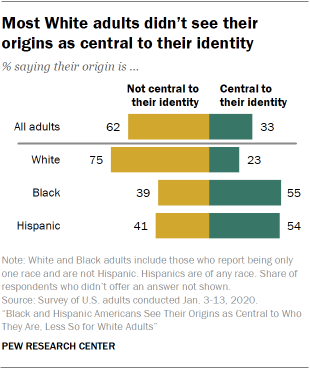
However, Hispanic adults, especially immigrants, were more likely to be familiar with their origins than single-race Black or White adults. A majority of Hispanic and Black respondents, but not of Whites, said they feel a strong connection to their roots. And about half or more of Hispanic and Black respondents said their origin is central to their identity, but only about a quarter of Whites said so.

The online survey of 3,535 adults conducted in January 2020 included Americans of all races, but results are shown separately only for White, Hispanic and Black adults, as well as for all non-Hispanic respondents who checked more than one racial category. As with many surveys of this size, there are too few respondents who identify as Asian American, Native American or in other racial groups to draw statistically sound conclusions.

Since that survey was conducted, Pew Research Center has begun to implement plans to expand its work on race and ethnicity to better represent the diversity of people and voices in the United States. Our recent publications include a statistical portrait of Asian Americans and key Asian origin groups and other research that can be accessed on our Asian American topic page. By expanding the Asian American sample in later 2020 surveys, Pew Research was able to report specific results for that population in reports about violence and discrimination, racial reckoning and the financial impact of the coronavirus pandemic.

Terminology

Racial and ethnic groups are based on how respondents self-identified in the race and ethnicity questions on the January 2020 survey that were identical to the ones asked on the 2020 census. Unless otherwise noted, references to White and Black adults include only those who are not Hispanic and identify as only one race. Hispanics are of any race.

U.S. born refers to individuals who are U.S. citizens at birth, including people born in the 50 U.S. states, the District of Columbia, Puerto Rico or other U.S. territories, as well as those born elsewhere to at least one parent who is a U.S. citizen.

The terms foreign born and immigrant are used interchangeably in this report. They refer to people who are not a U.S. citizen at birth – in other words, those born outside the U.S., Puerto Rico or other U.S. territories and whose parents are not U.S. citizens.

Second generation refers to people born in the 50 states, the District of Columbia, Puerto Rico or other U.S. territories with at least one first-generation, or immigrant, parent.

Third and higher generation refers to people born in the 50 states, the District of Columbia, Puerto Rico or other U.S. territories with both parents born in the 50 states, the District of Columbia, Puerto Rico or other U.S. territories.

References to those with some college education include those with an associate degree and those who attended college but did not obtain a degree.

The survey was conducted in part to explore the impact of a change in how Americans were asked to self-identify their racial and ethnic backgrounds on the 2020 decennial census. For the first time in a U.S. census, respondents who say they are White or Black could indicate their origins in a write-in box, an outgrowth of a Census Bureau research project to improve accuracy of race and ethnicity data. Bureau officials said the write-in boxes would produce data that users have asked for about detailed population groups.

At the same time, Americans also are exploring their origins in other ways, via exploration of family roots in records from past censuses or in the growing industry offering at-home DNA tests. A Pew Research Center survey in 2019 found that about one-in-four adults who had taken a DNA test said they were surprised by what it showed about the racial or ethnic backgrounds of their ancestors. And 15% of those who used mail-in tests said it changed their view of their own race or ethnic identity.

About half of U.S. adults say census questions reflect own identity very well

The January 2020 survey asked respondents to answer the two questions about Hispanic origin and race that would be on the 2020 census. Most adults who checked the White or Black box did provide an origin, from Irish to African American. However, only about half (49%) of adults in the survey said the census questions reflected the way they see their own race and origin very well.

The Census Bureau research project that led to the change on the 2020 questionnaire also made two broader recommendations intended to allow people to see their own identity better reflected on government data collections such as the census. One would have created a new category for people of Middle Eastern and North African origin. The other would have combined the two questions on the form – about race and Hispanic origin – so that Hispanics or other groups that often do not see themselves in traditional racial categories would not be required to select one. Neither change was implemented for 2020.

Hispanic immigrants most likely to feel connected to their origins

Black and Hispanic adults are more likely than White adults to say origins central to their identity

The survey findings about familiarity and connection to one’s origins are closely related. Those who were familiar with their origins were far more likely to feel strong connections to their roots and see their origins as central to their identity, and the reverse was also true.

Hispanic adults’ greater familiarity and connection with their origins may be linked in part to the immigrant experience. About eight-in-ten Hispanic immigrants said they are very familiar with their origins (83%) and they feel a strong connection to family cultural origins (81%), both higher shares than for U.S.-born Hispanics or other groups of Americans. Among Hispanic adults, 45% were immigrants in 2019, compared with 11% of non-Hispanic adults, according to Pew Research Center tabulations of the American Community Survey.

Meanwhile, many White adults say they are not familiar with or connected to their origins, according to the survey. Some researchers have argued that ethnicity may be seen as “optional” by certain groups whose ancestors arrived in the U.S. generations ago and intermarried, such as some White Americans with long-ago European roots.

The survey findings that origins are central for a higher share of Black and Hispanic adults than White adults squares with other research that race plays a more important role in identity for Asian, Black and Hispanic adults than for White adults. In a survey conducted in 2019, most Asian, Black and Hispanic adults said that their race is very or extremely important to how they see themselves. This consciousness stretches back to childhood in many cases. Black adults especially (but also Asian Americans and Hispanics) were more likely than White adults to say their families spoke with them when they were growing up about the challenges or advantages they might face because of their race or ethnicity.

Multiracial adults have distinctive responses when it comes to their views of identity

The number of Americans who identify with more than one race is growing faster than those who check a single race, according to Census Bureau estimates. Previous research also has found that multiracial Americans have a more fluid racial identity than single-race Americans, and were among several smaller racial groups that were more likely to have changed their racial identity from one census to another.

Similarly, Pew Research Center survey findings from 2015 indicate a “multiracial identity gap” – that is, many Americans of multiracial backgrounds do not identify as such, especially if their ancestors are particularly remote. The share of adults who could be considered multiracial ranges from 1.4% (people who say they themselves are of more than one race) to 13.1% (if the races of great-grandparents and earlier biological ancestors are included). About nine-in-ten of the most distant group do not consider themselves to be multiracial, and survey findings suggest that is often because they never met a relative of a different race.

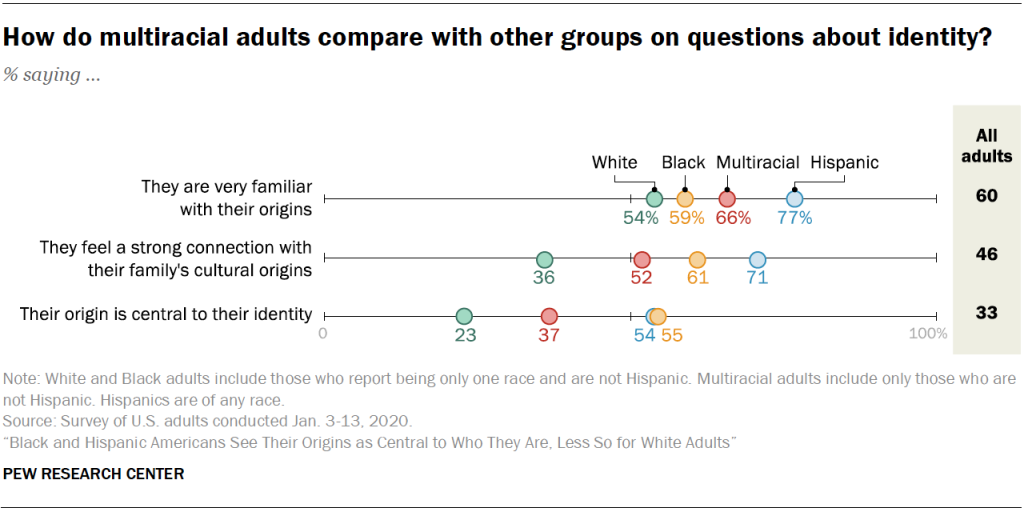
How do multiracial adults assess their familiarity with and strength of their family origins in the 2020 survey? Among non-Hispanics, two-thirds of multiracial adults (66%) said they were very familiar with their origins, a higher share than for single-race White adults and about the same as single-race Black adults. Non-Hispanic multiracial adults were less likely than all Hispanic adults (77%) to be very familiar with their origins.
How do multiracial adults compare with other groups on questions about identity?

On questions about the strength or centrality of their origins, non-Hispanic multiracial adults had responses stating stronger connections than non-Hispanic single-race White adults and weaker ones than all Hispanic adults. For example, 37% said their origin is central to their identity, compared with 23% of single-race non-Hispanic White adults and about half or more of non-Hispanic single-race Black adults (55%) and all Hispanic adults (54%).

The two different ways we asked about race and ethnicity

Most adults provided an origin in responding to questions like those asked on the census

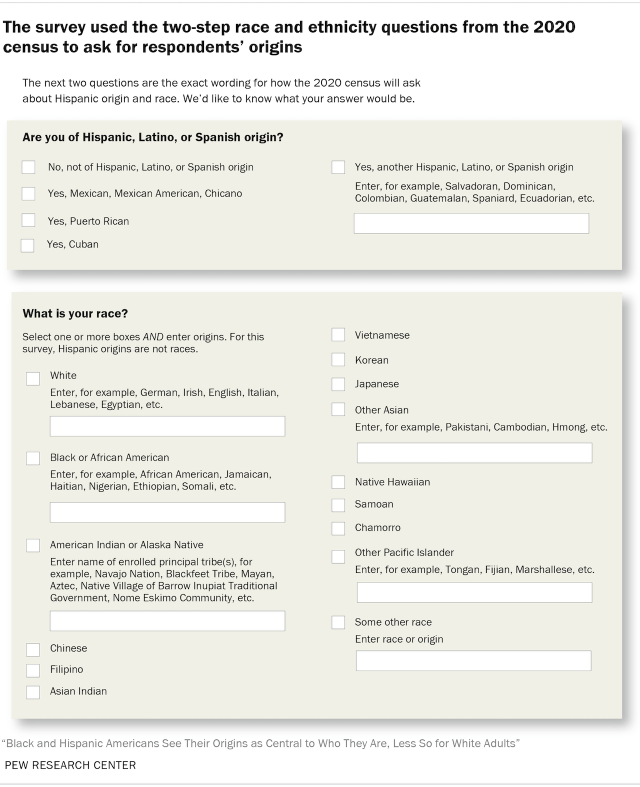
The census two-step process first asked respondents whether they are Hispanic or Latino or of Spanish origin, and to specify which one, such as Mexican or Cuban. The next question asked respondents to identify their race from a list of categories, with more than one selection possible. Respondents who selected any race category had an opportunity to write in their origins, replicating the 2020 decennial census form and its addition of a write-in for White and Black origins with examples such as German or Ethiopian.1

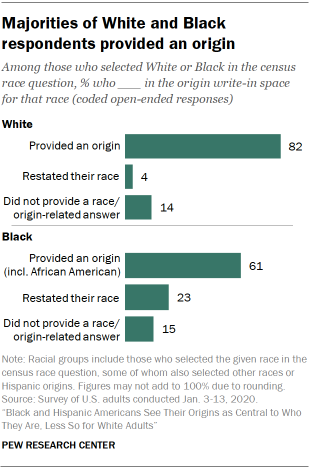
On the Pew Research Center survey’s 2020 census questions, about nine-in-ten adults (88%) provided an origin as requested. Among Black and White respondents, who were only offered write-in areas, more White (82%) than Black respondents (61%) provided them. (About one-in-five who provided a usable White origin offered more than one, while only 2% of those who provided a usable Black origin did so.) Another 4% of White respondents and 23% of Black respondents provided a variation of “White” or “Black.” The rest did not answer. These White and Black respondents included some who were multiracial or Hispanic or both.

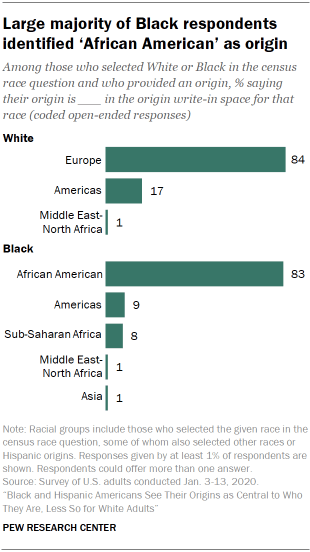
A variety of European origins dominated among respondents who selected White on the census race question and provided a usable response, with English, German or similar ancestries chosen by 84%. Among all Black respondents to the census race question and those who provided a usable response in the survey, 83% chose African American as their origin, rather than a specific country.

On the survey’s question from the 2020 census about Hispanic origin, 95% of Hispanics provided one, such as Mexican, Cuban or Salvadoran. In most cases it was a national origin.

The Census Bureau questions are not intended to measure the strength of Americans’ ties to their backgrounds. Consistent with this, even among those in the Pew Research Center survey who are very familiar with their origins, about a third (34%) said they do not feel a strong connection to them. For example, among White adults who are very familiar with their roots, 44% said they do not feel a strong connection.

Census question origin responses generally match self-descriptions, except among Hispanics

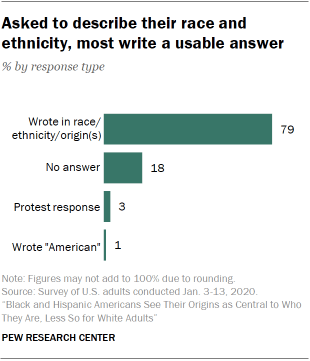
When asked to describe their race and ethnicity in their own words, about eight-in-ten respondents provided answers that could be mapped into standard Census Bureau categories. These included geography-based answers such as English, Chinese or Mexican, as well as racial or ethnic responses such as White/Caucasian, Native American or Hispanic.

But 18% of respondents did not provide an answer to the write-in race and ethnicity question, and smaller shares gave a protest response (see Chapter 2 text box) such as “none of your business.”

Among respondents who provided usable information, most gave answers to the self-description write-in and census questions that matched (90%) or partly matched (10%). But there were notable differences by demographic groups, with Hispanic respondents (who identified that way in the census questions) less likely to offer matched answers than single-race White or Black respondents.

Only about half of Hispanics had matched self-descriptions and responses to census questions

About half of Hispanics who gave valid answers to both sets of questions (53%) had responses that matched, and about half (47%) provided answers that only partly matched. For example, some respondents described their race or ethnicity in the self-description question as “White” alone, but then indicated Hispanic in the census Hispanic question and White in the census race question. One cause of the partial match may have been that respondents were following survey directions. The race question similar to that asked on the 2020 census had asked respondents to provide their race and instructed: “For the purposes of this question, Hispanic origins are not races.”

This tracks other research that has found that many people consider their Hispanic heritage to be their race. Census Bureau research concluded that most Hispanics would not check a race category if offered a single question about race and Hispanic origin that did not require them to select a race. On the Pew Research Center survey, Hispanics also were less likely than White respondents to say that the census race and ethnicity questions reflect very well how they see their own race and identity. Fewer than half (44%) did, compared with about half of White (51%) and Black (52%) respondents.
1. Americans’ origins and connections to their families’ roots

Many Americans are familiar with their ethnic origins, but the extent to which they feel a connection to these roots varies widely by race and ethnicity. Black and Hispanic adults were more likely than White adults to see their origin as central to their identity and to feel connected to their family’s cultural origin.

When survey respondents were asked to specify their origins in questions identical to the ones that appeared on the 2020 decennial census about their race and ethnicity, a large majority did so. Most of those who selected White as their race gave a European nationality, and most who selected Black wrote in African American.

Six-in-ten Americans said they were very familiar with their origins

Black and Hispanic adults see their origins as more central to their identity and feel more connected to their roots than White adults

A majority of Americans across racial and ethnic groups said they were very familiar with their origins. Hispanics were the most likely to say this, compared with smaller shares of non-Hispanic, single-race Black and White adults.

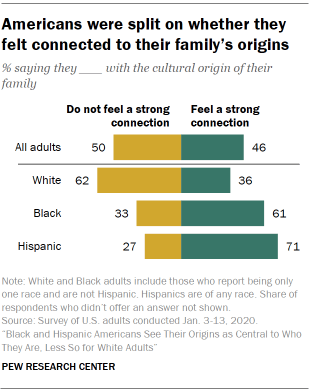
Americans were split on whether they felt connected to their family’s origins

Consistently across racial and ethnic groups, older adults were more likely to report being very familiar with their origins. About two-thirds of all adults 50 and older (65%) did so, compared with 55% of those younger than 50. Those with at least some college education were also more likely than those who did not attend college to be familiar with their family’s roots (62% vs. 56%).

Most White adults didn’t see their origins as central to their identity

Just under half of U.S. adults (46%) said they felt a strong connection with their family’s cultural origin, and a smaller share (33%) said their origin was central to their identity. Reflecting previous research, Black and Hispanic adults were much more likely than White adults to say they felt a strong connection and to see their origins as central to their identity. Foreign-born Hispanics were particularly likely to say they felt their origins were important in these ways.

The findings from these questions were closely intertwined – those who are familiar with their origins were far more likely to feel strong connections to their roots and to see their origins as central to their identity, and vice versa.

The survey used the two-step race and ethnicity questions from the 2020 census to ask for respondents' origins

Most survey respondents provide an origin when asked

The two-step race and ethnicity questions used in the 2020 census asked respondents to write their origins in a provided write-in response area if they said their race was White, Black or African American, American Indian or Alaska Native, Other Asian, Other Pacific Islander or “some other race,” or if they said they had a Hispanic origin other than the ones provided.2 They also included check boxes for specific Asian, Pacific Islander, and Hispanic origins, such as Chinese, Native Hawaiian and Mexican. In the 2020 Pew Research Center survey, respondents were shown the same questions that appeared on the 2020 census form and asked for their origins, with the same examples provided on the census form.

Majorities of White and Black respondents provided an origin

In all, 88% of survey respondents provided an origin on the census questions – either by selecting a check box for an origin such as Korean or Puerto Rican in the race or ethnicity questions, or by selecting a race such as White or Black and specifying a valid origin in the write-in box.

The survey found that most of those who checked White or Black in the race question did provide an origin. Among those who selected White (regardless of whether they also selected any other races or said they were Hispanic), most (82%) provided at least one geographic origin such as German, Irish or European.3 A small share (4%) restated their race as their origin (“White”) and 14% either left the write-in space blank or provided an answer that was not related to their race or origin.4

Meanwhile, among those who said they were Black in the census question (again, regardless of any other races or ethnicities selected), 61% provided an origin such as African American or a country of origin. About a quarter restated their race (“Black”), and 15% did not give a relevant answer or left the write-in response area blank.

Among the 7% of respondents who checked “some other race,” 78% provided an origin, 1% stated a race and 22% gave an irrelevant answer or no answer at all.

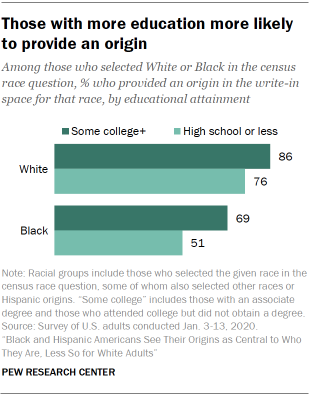
Those with more education more likely to provide an origin

Higher levels of education and being more familiar with one’s origins were associated with being more likely to provide an origin. Among those who checked White and those who checked Black in the race question, adults with more education were more likely to have provided an origin. For the White write-in space, 86% of those with at least some college experience provided an origin, compared with 76% of those with a high school diploma or less education. Meanwhile, in the Black write-in space, 69% of respondents with some college education or more provided an origin, vs. 51% of those who did not attend college. In both write-in spaces, those with lower levels of education were more likely to restate their race (“White” or “Black”) as their origin than those with more education. (The sample size for those who checked “some other race” is too small to analyze subgroups.)

Whether or not people provide an origin seems to be more related to their knowledge about their family’s origins than to how attached they feel to these origins. While those who said they were familiar with their origins were more likely to provide an answer, those who said their origins were central to their identity were no more likely to do so than those who said their origins weren’t central.

Leading origins were European for those who selected White in the race question and African American for those who selected Black

Large majority of Black respondents identified ‘African American’ as origin

Among adults who reported that they were White (some of whom were multiracial or Hispanic) and provided a geographic origin, European origins such as English, German or Scandinavian were the most common by far, with 84% offering this type of response. An additional 17% gave an origin from the Americas, such as “American” or Canadian, and 1% gave a Middle Eastern or North African origin. (Respondents could offer more than one answer, so the total adds to more than 100%.)

Among those who selected Black on the census question (on its own or in addition to another race or Hispanic origin), 83% said their origin was African American. Smaller shares said their origins lay in the Americas (9%), Sub-Saharan Africa (8%), the Middle East or North Africa, or Asia (1% each).

Many of those who selected “some other race” in the census race question may have done so because they consider their Hispanic identity to be their race, while the census treats this as a separate question. In fact, 80% of those who selected “some other race” also indicated that they were Hispanic in the census question about Hispanic ethnicity. Nearly all the respondents of “some other race” who provided an origin said their origin was in the Americas (96%), while 5% said Europe and 1% said the Middle East or North Africa.5

Among those who did provide an origin, 21% provided more than one origin group for the White write-in space. By comparison, just 2% provided more than one origin in the Black write-in space and 8% did so in the write-in space for “some other race.”

2. Only about half of Americans say census questions reflect their identity very well

When Americans were asked to describe their race and ethnicity in their own words, most provided answers that correspond to standard Census Bureau categories. And when they answered questions about their race and ethnicity similar to those asked in the 2020 census, most respondents chose categories that matched their self-description, according to the Pew Research Center survey.

But only about half of Americans said the census question reflects how they see their own race and origin “very well.” The share who did not think so was higher for Hispanic adults than for White or Black adults.

The 2020 census asked for new details from White and Black respondents

How the 2020 census asked about Hispanic origin and race

The 2020 census asked about Hispanic origin and race in a two-part format, similar to that in use since 1980. First, respondents were asked whether or not they were Hispanic or Latino, and to check or write in their origin if so. Next, they were asked to mark one or more boxes to identify their race and to fill in origin information if it was not included among the options. On the 2020 questionnaire, White and Black respondents were offered a write-in box for origin detail for the first time.

Every census since the first one in 1790 has asked about race, in ways that varied with the times. Starting in 1960, respondents could choose the racial categories that describe them on the census and in census surveys, rather than have census workers do it for them. The information from statistics on race and Hispanic origin is used in administering government programs and devising policies to carry out laws related to equal opportunity, design programs for specific groups and analyze social change.

Nearly one-in-five did not answer when asked to describe their race or ethnicity

Some respondents push back against being asked about their race or ethnicity

When asked to describe their race or ethnicity in their own words, a small share of respondents (3%) gave answers that directly or indirectly questioned the question.

Some protested that “we shouldn’t even have to answer this question” or “I believe that is the cause of most racism in the world, having to be segregated into groups” or “stupid question.” Others framed it as “I am a human like everyone else” or “To me, everybody is equal.” Some gave irrelevant responses such as “taxpayer” or “great.”

On census forms and surveys, the Census Bureau considers these answers “uncodable,” so they are not included in categories that are analyzed.

Other researchers have found that asking questions about race and ethnicity can be sensitive for some respondents.

Race and Hispanic origin data are on the census, according to the Census Bureau, because they are required in order to help federal agencies enforce civil rights laws. Due to protests, though, the Census Bureau has researched eliminating some questions that respondents do not like to answer, especially if there are other sources of this information. For example, a question about flush toilets was dropped from the agency’s American Community Survey in 2016. Another question, asking respondents what time they leave for work, was modified to be less intrusive.

When asked in the January 2020 Pew Research Center survey to describe their race or ethnicity in their own words, about eight-in-ten survey respondents gave responses that fit into categories on the two-part Census Bureau question about Hispanic origin and race.

Asked to describe their race and ethnicity, most write a usable answer

However, a notable share – 18% – did not fill in an answer. And 3% provided answers, ranging from “human race” to “no” to “none of your business,” which could be construed as a protest of the question.

Younger respondents were most likely not to provide any answer when asked to describe their race or ethnicity: 20% of those ages 18 to 49 said nothing, compared with 14% of those ages 50 and older.

Another 1% of respondents wrote in “American,” which the Census Bureau does not code as a standard race or ethnicity response, but which makes up a growing share of responses to questions about ancestry or ethnicity on its surveys. As the Census Bureau acknowledges, “There are many reasons why people may report their ancestors as American.”

Respondents who answered the two-part Census Bureau question by saying they were single-race non-Hispanic White (83%) were more likely than Hispanic respondents (78%) to provide an answer on the self-description question that corresponded to an official census category. Eight-in-ten Black respondents (80%) provided a self-description that corresponded to a census category.

Did answers to both questions match?

For most U.S. adults who took part in the survey, their self-description of their race and Hispanic origin matched how they answered the two-step Census Bureau ethnicity and race questions.

Among respondents who offered usable answers to both questions, 90% had responses that matched entirely. An additional 10% gave answers that partially matched, for example, describing themselves with multiple races in one question but one race in another. A small share, about 1%, gave responses that did not match. (Numbers add to more than 100% due to rounding of underlying data.)

White and Black respondents were more likely than Hispanics to have matched responses to the two sets of questions. Among those who gave usable responses to both sets of questions, all White respondents and 97% of Black respondents provided totally matched answers, compared with 53% of Hispanic respondents.

Hispanic respondents were more likely than White or Black respondents to have a partial match. This may be because the 2020 census form instructed respondents that Hispanic origins are not a race, and required everyone to select a race, but many Hispanics consider Hispanic to be their race.

Respondents who checked a single race on the census question (92%) were more likely than those who checked multiple races (55%) to have their answers match exactly with their self-descriptions. Those who checked multiple races were more likely to have a partial match (43% vs. 8%).

Most respondents had matched answers to both the self-description and census questions even when counting those who provided no response or a response that could not be coded into a census category. Among all respondents, 70% gave matching answers to both questions and 8% gave answers that partially matched.

An additional 22% did not provide a usable response to the self-description question or the two-part census question, meaning that they did not offer an answer that could be categorized into a standard race or ethnicity group. (This included about 2% of respondents who did not answer the census race question and 3% who did not answer the census Hispanic-origin question.)

A small fraction, less than 1%, provided answers that did not match, such as providing one race in the self-description and another in the census question.

Demographic differences in views of how census questions reflect identity

About half of U.S. adults say census questions reflect own identity very well

In all, about half of Americans (49%) said the two questions similar to those in the 2020 census asked in the survey reflect how they see their race and origin very well. Roughly a third (32%) said the questions do so somewhat well. The remaining 17% said the census questions reflect their self-identity not too well (12%) or not at all well (5%).

About half of White and Black adults said the census questions describe them very well. Among Hispanic adults, 44% did. Hispanic respondents were more likely than White or Black respondents to say the questions describe them “not too well” or “not well at all.”

However, foreign-born Hispanic respondents were more likely than U.S.-born Hispanics to say the questions reflect their race and origin very well (52% to 38%). There was no difference in attitudes about the census questions between single-race and multiple-race respondents.

Views about the census questions also differed by age, with 54% of Americans ages 50 and older saying the census questions reflect their identity very well, compared with 45% of younger age groups.

Not surprisingly, those whose self-description entirely matched their answers to the two questions asked on the census were more likely to say the questions aligned with how they thought of themselves. But even among those with total matches, only 54% said the questions reflect “very well” how they saw their race and origin. Among those with partial matches or no match, only 40% said so. Those who said the census question described them “not too well” or “not at all well” were more likely to offer a protest answer to the self-description question: 4% did. This group also was the most likely to leave the self-description blank: 24% did.

3. Hispanic identity and immigrant generations

For U.S. Hispanics, racial and ethnic identity can have many dimensions. Nearly two decades of Pew Research Center surveys of Hispanics show some identify most often with the country of origin of their ancestors, such as indicating they are Mexican, Dominican or Cuban or even American. Others choose pan-ethnic identities like Hispanic, Latino or even Latinx.

For others, their Hispanic identity is part of their racial identity. Others may indicate they have a Hispanic ancestor, yet they do not self-identify as Hispanic. Across all these findings, a consistent pattern emerges: The more generations removed someone is from their family’s immigrant roots, the less likely they are to identify with the origins of their immigrant ancestors, or even to identify as Hispanic.

For Hispanics, importance of origins slips across immigrant generations

Overall, 77% of Hispanics said they were very familiar with their origins, according to the 2020 survey. This share varied by immigrant generation, though majorities of all groups said they were very familiar with their origins. Some 83% of immigrant Hispanics said they were very familiar with their origins, a higher share than among second-generation or third- or higher-generation Hispanics. Still, Hispanics across all three generations were more likely than White adults (54%) to say they were very familiar with their origins. And immigrant Hispanics were more likely than Black adults (59%) to say this.

The majority of Hispanics also feel a strong cultural connection to their family’s origins. About seven-in-ten Hispanics (71%) said this in the survey. Among immigrants, 81% said they felt a strong cultural connection to their family’s origins, a higher share than that among second-generation (71%) and third- or higher-generation (63%) Hispanics. All three groups of Hispanics were more likely to say they felt strong cultural connections to their family’s origins than White adults (36%). And immigrant Hispanics were more likely than Black adults (61%) to feel strong family cultural connections.

Hispanics are more likely to be immigrants than non-Hispanics. Some 45% of Hispanic adults were born in another country, while 11% of non-Hispanic adults were born outside the U.S., according to Pew Research Center tabulations of the 2019 American Community Survey.

While many Hispanics said they are familiar with their origins, only 54% said their origins are central to their identity. Here too there is a link to immigrant generations. About six-in-ten immigrant Hispanics (61%) said their origins are central to their identity, while 51% of second-generation and 47% of third- or higher-generation Hispanics said the same. By comparison, 55% of Black adults indicate their origins are central to their identity, and just 23% of White adults say so.

Hispanics and their race and ethnicity

There are many ways to ask about racial and ethnic identities or origins. The choices that Hispanics make to describe their racial or ethnic identity can vary depending on how the question is asked and who is asking it.

The open-end approach to asking about race and ethnicity

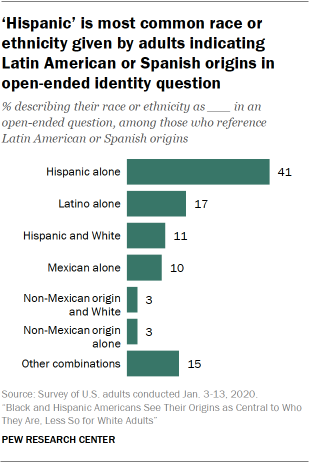
In an open-ended question asking respondents to describe their race or ethnicity, 11% of U.S. adults mentioned an origin with roots in Latin America or Spain. These responses included pan-ethnic terms like Hispanic, Latino and (less commonly) Latinx. They also included references to countries, like Mexico or the Dominican Republic.

‘Hispanic’ is most common race or ethnicity given by adults indicating Latin American or Spanish origins in open-ended identity question

Among these adults, the single most common response was Hispanic. Some 41% described their identity this way with no mention of other origins or backgrounds. Another 17% wrote Latino but with no mention of other identities or origins; 11% described their race or ethnicity as “Hispanic and White,” and 10% wrote Mexican as their race or ethnicity with no other origin mentioned. These responses in total accounted for about eight-in-ten (79%) of open-ended answers given by adults who indicated an origin in Spanish-speaking Latin America or Spain.

“Hispanic” was mentioned alone or along with other races or origins in 58% of responses that referenced some Latin American or Spanish origin, mostly without the mention of any other identity. Meanwhile Latino was mentioned in 25% of responses and White was mentioned in 19%.

The 2020 decennial census approach to asking about race and ethnicity

Later in the survey, respondents were asked about their Hispanic and racial identity in the format used by the Census Bureau in the 2020 decennial census. First, respondents were asked if they were “Hispanic, Latino or of Spanish origin” and instructed to write in their origin. Overall, 16% of survey respondents self-identified as Hispanic, Latino or of Spanish origin, a higher share than the 11% who indicated a Latin American or Spanish origin in the open-ended question about race and ethnicity. Notably, two-thirds (67%) of survey respondents who say they are Hispanic in the Census Bureau question also provided a Latin American or Spanish origin in the open-end, but one-third (33%) did not.

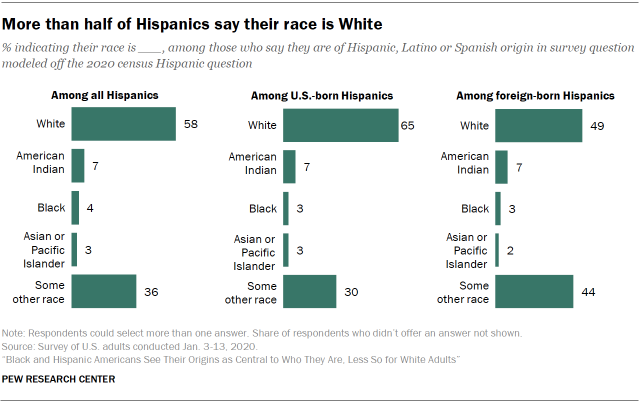
More than half of Hispanics say their race is White

Second, respondents were asked their race and instructed that for the purposes of the race question, “Hispanic origins are not races.” Respondents could select more than one race. Among self-identified Hispanics, 58% indicated their race is White (either alone or along with other races), 36% indicated “some other race,” 7% indicated American Indian or Alaska Native and 4% indicated Black or African American (also either alone or along with other races).6

Responses to the Census Bureau race question varied by immigrant generation among self-identified Hispanics. About half (49%) of Hispanic immigrants indicated their race is White, a share that rose to about two-thirds among second- and third- or higher-generation Hispanics. Similarly, the share that indicated their race is “some other race” varied across immigrant generations: 44% of immigrant Hispanics indicated their race as some other race, while 30% of second-generation and 25% of third- or higher-generation Hispanics did so.

Among Hispanics, matches and mismatches in responses about race and ethnicity

Because the survey asked about race and ethnicity in two ways, it is possible to compare responses to the open-ended question with those of the closed-ended Census Bureau two-step question.

According to the survey, responses to the two methods for asking about race and ethnicity did not always match. Some 53% of self-identified Hispanics (based on the 2020 census Hispanic question) gave an answer in the open-ended question about race and ethnicity that matched what they indicated in the two-step closed-ended decennial census question, among those who gave valid answers to both questions. However, for 47%, there was not a complete match.

Similarly, among the 11% of adults who described their race or ethnicity in the open-ended question as indicating a Latin American or Spanish origin, 59% of responses matched selections in the decennial census two-question race and ethnicity method. Another 41% gave open-ended responses that partially match responses to the two-question race and ethnicity method. Less than 1% of open-ended responses among those indicating a Latin American or Spanish origin did not match responses given to the two-question race and ethnicity method of the decennial census.

One possible reason for this mismatch of responses is the instruction in the Census Bureau’s race question – for the purposes of this question, Hispanic origins are not races. Survey respondents may have been following those instructions, resulting in different responses in the race and ethnicity open-end question and the Census Bureau’s two-question race and ethnicity format.

While it is not clear which method is best or why there is a mismatch in responses among Hispanics, the survey did ask respondents about how well the Census Bureau’s two-question race and ethnicity method reflects their identity. About three-quarters (77%) of Hispanics said the census two-question method reflects how they see their identity and origins “very well” (44%) or “somewhat well” (32%), while 23% said it reflects their identity and origins “not too well” (17%) or “not at all” (5%). Immigrant Hispanics were more likely than U.S.-born Hispanics to say the census race and ethnicity questions reflect how they see identity and origins “very well” – 52% versus 38%.

Acknowledgments

This report is a collaborative effort based on the input and analysis of the following individuals. Find related reports online at pewresearch.org/pewresearch-org/social-trends/

D’Vera Cohn, Senior Writer/Editor
Anna Brown, Research Associate
Mark Hugo Lopez, Director, Race and Ethnicity Research
Kim Parker, Director, Social Trends Research
Juliana Horowitz, Associate Director, Research
Jesse Bennett, Research Assistant
Deja Thomas, Former Research Assistant
Stella Sechopoulos, Research Assistant
Luis Noe-Bustamante, Research Analyst
Rachel Minkin, Research Associate
Jeffrey S. Passel, Senior Demographer
Nick Bertoni, Senior Panel Manager
Tanya Arditi, Communications Manager
Gar Meng Leong, Communications Associate
Julia O’Hanlon, Communications Associate
Michael Keegan, Senior Infographics Designer
David Kent, Senior Copy Editor
Shannon Greenwood, Digital Producer

Methodology

The analysis in this report is based on a nationally representative online survey conducted by Pew Research Center Jan. 3-13, 2020, among a sample of 3,535 adults 18 years of age or older residing in the United States. This included an oversample of 175 U.S.-born Hispanics and 243 foreign-born Hispanics. The survey was conducted by Ipsos Public Affairs in English and Spanish using KnowledgePanel, its nationally representative online research panel.

Weighting dimensions

KnowledgePanel members are recruited through probability sampling methods and include both those with internet access and those who did not have internet access at the time of their recruitment (KnowledgePanel provides internet access for those who do not have it and, if needed, a device to access the internet when they join the panel). A combination of random-digit dialing (RDD) and address-based sampling (ABS) methodologies have been used to recruit panel members (in 2009 KnowledgePanel switched its sampling methodology for recruiting panel members from RDD to ABS). The panel includes households with landlines and cellular phones, including those only with cellphones, and those without a phone. Both the RDD and ABS samples were provided by Marketing Systems Group.

KnowledgePanel continually recruits new panel members throughout the year to offset panel attrition as people leave the panel. All active adult members of the Ipsos panel were eligible for inclusion in this study. In all, 5,797 panelists were invited to take part in the survey, for a study completion rate of 61.2%. All sampled members received an initial email to notify them of the survey and provide a link to the survey questionnaire. Additional follow-up reminders were sent to those who had not yet responded as needed.

The cumulative response rate accounting for nonresponse to the recruitment surveys and attrition is 4.0%. The break-off rate among panelists who logged onto the survey and completed at least one item is 5.4%.

The data were weighted in a multistep process that begins with a base weight incorporating the respondents’ original selection probability. The next step in the weighting uses an iterative technique that aligns the sample to population benchmarks on the dimensions listed in the accompanying table.

Sampling errors and test of statistical significance take into account the effect of weighting. Interviews are conducted in both English and Spanish.

In addition to sampling error, one should bear in mind that question wording and practical difficulties in conducting surveys can introduce error or bias into the findings of opinion polls.

The following table shows the unweighted sample sizes and the error attributable to sampling that would be expected at the 95% level of confidence for different groups in the survey:

Unweighted sample sizes and the error attributable to sampling

Sample sizes and sampling errors for other subgroups are available upon request.

Coding of open-ended origin responses

Origins provided in the write-in boxes for those who selected White, Black or “some other race” were coded into five geographic regions according to the country they corresponded with, under the following framework. Mentions of “African American” were coded separately. Up to two mentions of a geographic region were coded, so the totals may add to greater than 100%.

Americas

American
Anguilla
Antigua and Barbuda
Aruba
Bahamas
Barbados
British Virgin Islands
Caribbean Netherlands
Cayman Islands
Cuba
Curacao
Dominica
Dominican Republic
Grenada
Guadeloupe
Haiti
Jamaica
Martinique
Montserrat
Puerto Rico
Sint Maarten
St. Barthelemy
St. Kitts and Nevis
St. Lucia
St. Martin
St. Vincent and the Grenadines
Trinidad and Tobago
Turks and Caicos Islands
U.S. Virgin Islands
Belize
Costa Rica
El Salvador
Guatemala
Hispanic
Honduras
Latino
Mexico
Nicaragua
Panama
Argentina
Bolivia
Brazil
Chile
Colombia
Ecuador
Falkland Islands (Malvinas)
French Guiana
Guyana
Paraguay
Peru
Suriname
Uruguay
Venezuela
Bermuda
Canada
Greenland
St. Pierre and Miquelon
United States

Asia

Azerbaijan
Kazakhstan
Kyrgyzstan
Tajikistan
Turkmenistan
Uzbekistan
Brunei
Burma (Myanmar)
Cambodia
China
Hong Kong
Indonesia
Japan
Laos
Macao
Malaysia
Mongolia
North Korea
Papua New Guinea
Philippines
Singapore
South Korea
Taiwan
Thailand
Timor-Leste
Vietnam
American Samoa
Australia
Cook Islands
Federated States of Micronesia
Fiji
French Polynesia
Guam
Kiribati
Marshall Islands
Nauru
New Caledonia
New Zealand
Niue
Northern Mariana Islands
Palau
Samoa
Solomon Islands
Tokelau
Tonga
Tuvalu
Vanuatu
Wallis and Futuna
Afghanistan
Bangladesh
Bhutan
India
Maldives
Nepal
Pakistan
Sri Lanka

Europe

Albania
Armenia
Belarus
Bosnia-Herzegovina
Bulgaria
Caucasian
Croatia
Czech Republic
Estonia
Georgia
Hungary
Kosovo
Latvia
Lithuania
Moldova
Montenegro
North Macedonia
Poland
Romania
Russia
Serbia
Slovakia
Slovenia
Ukraine
Andorra
Austria
Belgium
Channel Islands
Cyprus
Denmark
Faeroe Islands
Finland
France
Germany
Gibraltar
Greece
Iceland
Ireland
Isle of Man
Italy
Liechtenstein
Luxembourg
Malta
Monaco
Netherlands
Norway
Portugal
San Marino
Spain
Sweden
Switzerland
United Kingdom
Vatican City

Middle East-North Africa

Algeria
Libya
Morocco
Sudan
Tunisia
Western Sahara
Bahrain
Egypt
Iran
Iraq
Israel
Jordan
Kuwait
Lebanon
Oman
Palestinian territories
Qatar
Saudi Arabia
Syria
Turkey
United Arab Emirates
Yemen

Sub-Saharan Africa

Angola
Benin
Botswana
Burkina Faso
Burundi
Cameroon
Cape Verde
Central African Republic
Chad
Comoros
Democratic Republic of the Congo
Djibouti
Equatorial Guinea
Eritrea
Ethiopia
Gabon
Gambia
Ghana
Guinea
Guinea-Bissau
Ivory Coast
Kenya
Lesotho
Liberia
Madagascar
Malawi
Mali
Mauritania
Mauritius
Mayotte
Mozambique
Namibia
Niger
Nigeria
Republic of the Congo
Reunion
Rwanda
Sao Tome and Principe
Senegal
Seychelles
Sierra Leone
Somalia
South Africa
South Sudan
Swaziland
Tanzania
Togo
Uganda
Zambia
Zimbabwe