Pew Research Center

FOR RELEASE NOVEMBER 3, 2016

Size of U.S. Unauthorized Immigrant Workforce Stable After the Great Recession

Declines in eight states and increases in seven since 2009

BY Jeffrey S. Passel and D’Vera Cohn

FOR MEDIA OR OTHER INQUIRIES:

Communications Department
202.419.4372
www.pewresearch.org

RECOMMENDED CITATION

Pew Research Center, November 2016, "Size of U.S. Unauthorized Immigrant Workforce Stable After the Great Recession"

About Pew Research Center

Pew Research Center is a nonpartisan, nonadvocacy fact tank that informs the public about the issues, attitudes and trends shaping the world. It does not take policy positions. The Center conducts public opinion polling, demographic research, computational social science research and other data-driven research. It studies politics and policy; news habits and media; the internet and technology; religion; race and ethnicity; international affairs; social, demographic and economic trends; science; research methodology and data science; and immigration and migration. Pew Research Center is a subsidiary of The Pew Charitable Trusts, its primary funder.

© Pew Research Center 2026

Table of contents

  • About Pew Research Center
  • Size of U.S. Unauthorized Immigrant Workforce Stable After the Great Recession
  • 1. Industries of unauthorized immigrant workers
  • 2. Occupations of unauthorized immigrant workers
  • Acknowledgments
  • Methodology
  • Appendix A: References
  • Appendix B: Additional Charts
  • Appendix C: Additional map
  • Appendix D: Detailed tables

Size of U.S. Unauthorized Immigrant Workforce Stable After the Great Recession

Declines in eight states and increases in seven since 2009

There were 8 million unauthorized immigrants in the U.S. working or looking for work in 2014, making up 5% of the civilian labor force, according to new Pew Research Center estimates using government data. The number was unchanged and the share was down slightly since 2009, the year the Great Recession officially ended.1
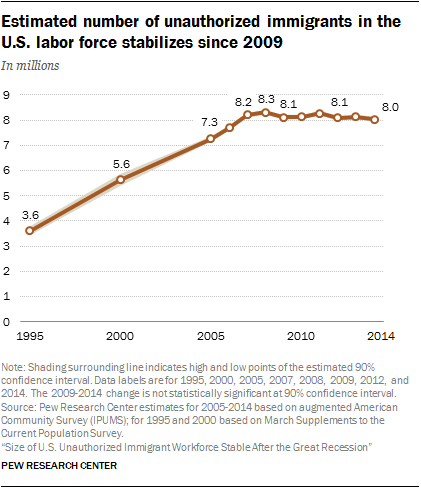
Estimated number of unauthorized immigrants in the U.S. labor force stabilizes since 2009

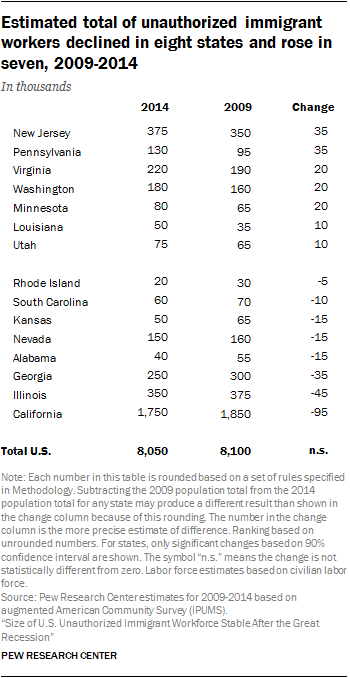
The recent stability in the trend for unauthorized immigrants in the U.S. workforce echoes that for the unauthorized immigrant population overall. Both groups had grown rapidly during the 1990s and early 2000s. Compared with their sizes at the start of the recession in 2007, the unauthorized immigrant workforce was slightly smaller in 2014 and the overall unauthorized immigrant population was markedly smaller. From 2009 to 2014, when the number of unauthorized immigrant workers was stable, eight U.S. states – Alabama, California, Georgia, Illinois, Kansas, Nevada, South Carolina and Rhode Island – had statistically significant declines in the number of unauthorized immigrants in their workforces. Seven U.S. states – Louisiana, Minnesota, New Jersey, Pennsylvania, Utah, Virginia and Washington – had increases in the number of unauthorized immigrants in their workforces.2
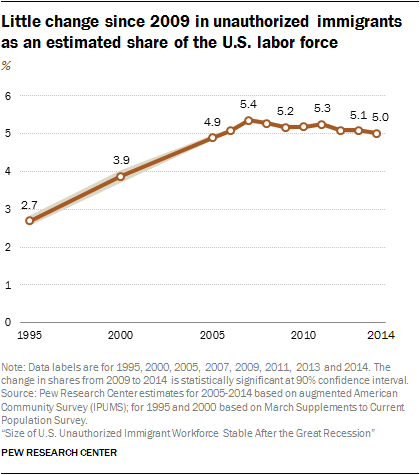
Little change since 2009 in unauthorized immigrants as an estimated share of the U.S. labor force

Most states that experienced change in their unauthorized immigrant workforces also experienced change in their total unauthorized immigrant populations. In 12 states, both the total number of unauthorized immigrants and the number of unauthorized immigrants in the civilian labor force changed in the same direction from 2009 to 2014. In three states where the unauthorized immigrant workforce changed from 2009 to 2014 – Minnesota, Rhode Island and Utah – unauthorized immigrant populations overall did not change during the period.

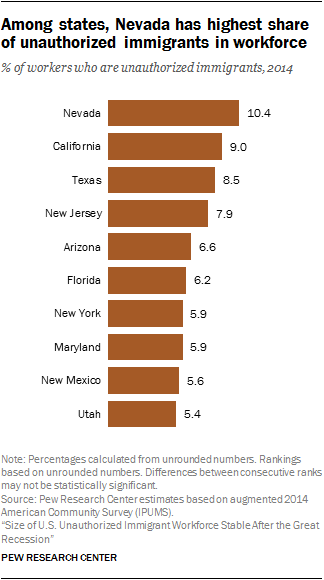
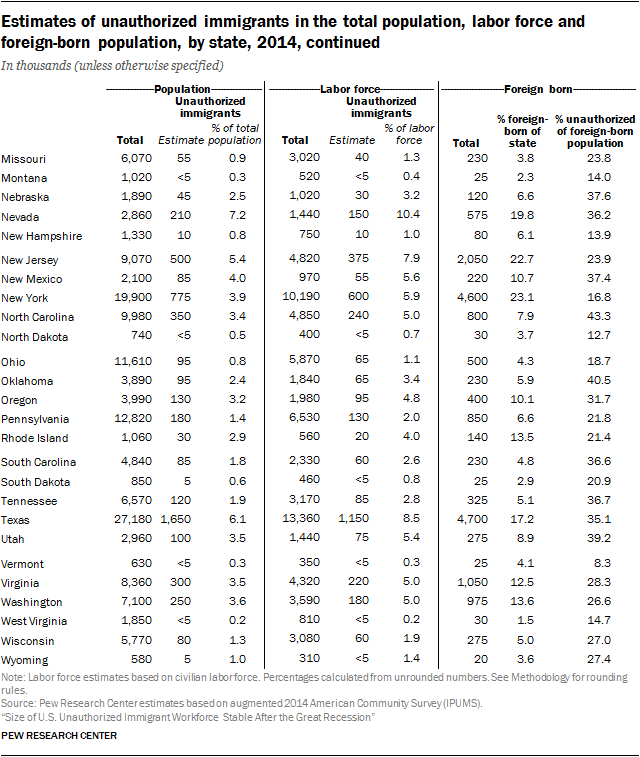
Looking at 2014 estimates, states with the largest number of total unauthorized immigrants in their workforces also were among those states with the largest overall populations of unauthorized immigrants. They included California, with 1.7 million unauthorized immigrant workers; Texas, with 1.1 million; and New York, with 600,000. States where unauthorized immigrants accounted for the largest share of the workforce included Nevada (10.4%); California (9.0%) and Texas (8.5%). (See the chart here for the top states.)

These key findings – and others about the occupations and industries in which unauthorized immigrants work – come from new Pew Research Center estimates based mainly on U.S. Census Bureau data. Details concerning the source material and methods for calculating the estimates are available in the Methodology.
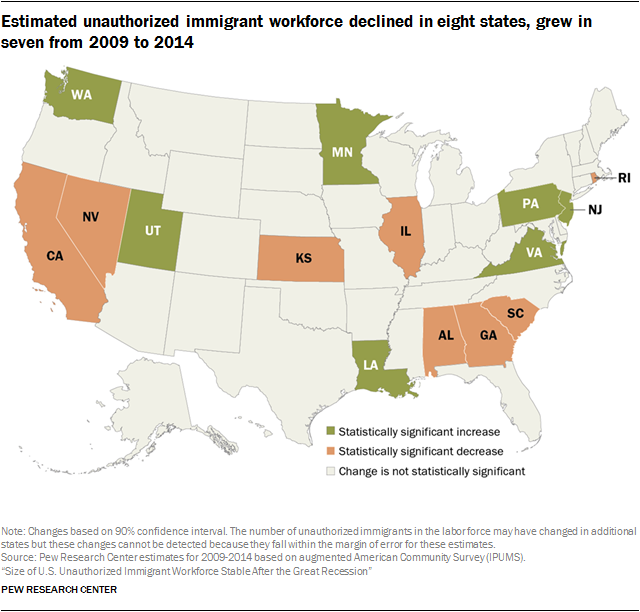
Estimated unauthorized immigrant workforce declined in eight states, grew in seven from 2009 to 2014
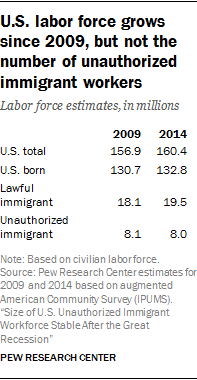
U.S. labor force grows since 2009, but not the number of unauthorized immigrant workers

The nation’s 11.1 million unauthorized immigrants made up 26% of the nation’s 43.6 million foreign-born residents in 2014. The U.S. foreign-born population also included 19 million naturalized citizens, 11.7 million lawful permanent residents and 1.7 million lawful residents with temporary status (such as students, diplomats and “guest workers” in the technology sector). In total, immigrants represented 13.6% of the U.S. population in 2014.

In 2014, the nation’s civilian labor force consisted of about 133 million U.S.-born workers (83% of the total), 19.5 million lawful immigrant workers (12%) and 8 million unauthorized immigrant workers (5%). The numbers of U.S.-born members of the workforce and lawful immigrant members of the workforce increased from 2009 to 2014, while the number of unauthorized immigrant workers did not.

Unauthorized immigrants more likely to be of working age than other groups

Unauthorized immigrants make up a larger share of the U.S. labor force (5% in 2014) than of the total population (3.5%) in part because they are disproportionately likely to be of working age. Fully 92% of unauthorized immigrants are ages 18 to 64, compared with 60% of the U.S.-born population and 76% of lawful immigrants.

Among unauthorized immigrants, males are more likely than their U.S.-born and lawful immigrant counterparts to be working or looking for work, while female unauthorized immigrants are less likely to be in the labor force. Fully 91% of unauthorized immigrant men ages 18 to 64 were working or looking for work in 2014, compared with 79% of U.S.-born men of similar age and 84% of lawful immigrants of similar age.

Among women ages 18 to 64, labor force participation was 61% for unauthorized immigrants in 2014, 72% for the U.S. born and 67% for lawful immigrants. One reason for the disparity could be that unauthorized immigrant women who are not in the workforce are far more likely than other groups to have children younger than 18 at home.
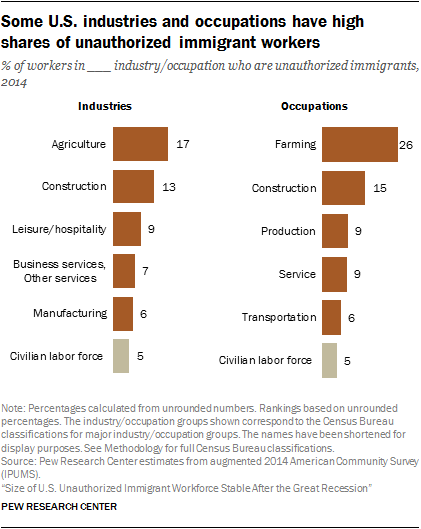
Some U.S. industries and occupations have high shares of unauthorized immigrant workers

Although unauthorized immigrants work throughout the U.S. economy, they are particularly concentrated in some sectors, according to the Pew Research Center analysis. Compared with their 5% share of the civilian workforce, they were overrepresented in the agriculture (17%) and construction (13%) sectors, as well as in the leisure and hospitality industry (9%). They were underrepresented in some sectors such as the educational and health services sector and the financial and information industries.

By occupation, unauthorized immigrants held a higher share of U.S. farming jobs (26%) in 2014 than would be expected given their share of the workforce. They also held a disproportionate share of construction jobs (15%). By contrast, unauthorized immigrants held a lower share of maintenance, management, professional, sales and office support jobs than their share of the workforce overall.

However, there is no sector or occupation where unauthorized immigrant workers were a majority; in all industries or occupations, they were outnumbered by U.S.-born workers.

Occupation and industry: What’s the difference?

This report on the unauthorized immigrant workforce includes estimates about occupation, which is the kind of work that people do on the job, as well as about industry, which is the kind of business conducted by an employing organization.

Some occupation groups are similar to industry categories – for example, many construction workers are employed in the construction industry. The construction industry, however, also employs people in many other occupations, such as manager, clerk, etc.

The Census Bureau obtains data on occupation and industry from responses to write-in and check-box questions; the responses are coded using a standard classification system.

The unauthorized immigrant estimates in this report are produced using a multistage method that first subtracts the estimated U.S. lawful foreign-born population from the total adjusted foreign-born population to derive a residual estimate of the unauthorized immigrant population. Then, the residual estimates serve as control totals in assigning legal status to individual respondents in the survey. The main source of data for 2005-2014 is the American Community Survey, conducted by the U.S. Census Bureau; see Methodology for more details.

Accompanying this report are interactive maps showing 2014 estimates for the 50 states and District of Columbia on:

  • The unauthorized immigrant population
  • Unauthorized immigrants’ share of each state’s overall population, foreign-born population and labor force
  • The share of K-12 students with unauthorized immigrant parents
  • Mexicans as a share of unauthorized immigrants
  • Statistically significant change in the unauthorized immigrant population from 2009 to 2014

Another interactive graphic shows unauthorized immigrant population trends for U.S. states of residence as well as international regions and largest countries of birth, based on a previous Pew Research Center report.

Some unauthorized immigrants have permission to work

Unauthorized immigrants include those who enter the country without legal permission and those who overstay their visas. About 10% of unauthorized immigrants have been granted temporary protection from deportation – and eligibility to work – under two government programs. They include more than 728,000 young adults who were brought to the U.S. as children and successfully applied for President Barack Obama’s 2012 Deferred Action for Childhood Arrivals program. The program rules state that unauthorized immigrants must have been be no older than 30 as of June 15, 2012; must have been brought to the U.S. before age 16; and must have lived in the U.S. continuously since June 15, 2007. In addition, eligible applicants have to be in school, hold a high school diploma or General Education Development (GED) certificate, or be an honorably discharged military veteran. The rules also specified that they cannot have a significant criminal record and cannot “pose a threat to national security or public safety.”

Those seeking eligibility had to submit documents to prove their claim and pay a $465 filing and biometric fee. They also had to submit fingerprints, a photo and a signature for security purposes. An additional 4 million young adults and their parents would have been eligible under an expansion that has been blocked by a federal court.

Under the second program, an estimated 326,000 immigrants, mostly from Central America, have been granted Temporary Protected Status because of disease, natural disaster or conflict in their home countries. The Pew Research Center estimates of the unauthorized immigrant population also include some people who have applied for asylum status but whose applications have not been processed. As of April 2014, about 45,000 cases of principal applicants were pending; if family members are included, that total might rise to as much as 75,000.

Terminology

“Foreign born” refers to an individual who is not a U.S. citizen at birth or who, in other words, is born outside the U.S., Puerto Rico or other U.S. territories and whose parents are not U.S. citizens. The terms “foreign born” and “immigrant” are used interchangeably.

“U.S. born” refers to an individual who is a U.S. citizen at birth, including people born in the United States, Puerto Rico or other U.S. territories, as well as those born elsewhere to at least one parent who is a U.S. citizen.

The “lawful immigrant” population is defined as naturalized citizens; people granted lawful permanent residence (previously known as legal permanent residence); those granted asylum; people admitted as refugees; and people admitted under a set of specific authorized temporary statuses for longer-term residence and work.

“Unauthorized immigrants” are all foreign-born noncitizens residing in the country who are not “lawful immigrants.” These definitions reflect standard and customary usage by the U.S. Department of Homeland Security and academic researchers. The vast majority of unauthorized immigrants entered the country without valid documents or arrived with valid visas but stayed past their visa expiration date or otherwise violated the terms of their admission. Some who entered as unauthorized immigrants or violated terms of admission have obtained work authorization by applying for adjustment to lawful permanent status, obtaining Temporary Protected Status (TPS) or receiving Deferred Action for Childhood Arrivals (DACA) status. This “quasi-lawful” group could account for as much as 10% of the unauthorized immigrant population. Many could also revert to unauthorized status.

The “labor force” refers to the civilian labor force, unless otherwise specified, including people ages 16 and older who are employed, or unemployed and looking for work. “Workforce” is used interchangeably with labor force. People in the labor force are referred to as “workers” regardless of their employment status. Similarly, when there is analysis of estimates for occupations, “occupation” and “job” are used interchangeably. And for industries, “industry” and “sector” are used interchangeably.

The occupation and industry category titles used throughout the report have been shortened for display purposes. The full list is included in the Methodology.
1. Industries of unauthorized immigrant workers

Unauthorized immigrants are unevenly distributed across some industrial sectors and occupations in the U.S. economy. Compared with their 5% share of the overall civilian workforce, they are a higher share in some types of employment and a lower share in others. They tend to cluster in sectors and occupations that offer low-skilled work, due in part to their low educational attainment and the limitations placed on employment by their legal status. However, in all sectors, there are more U.S.-born workers than unauthorized immigrant workers. (See the table here for data on workers’ status by major industry.)

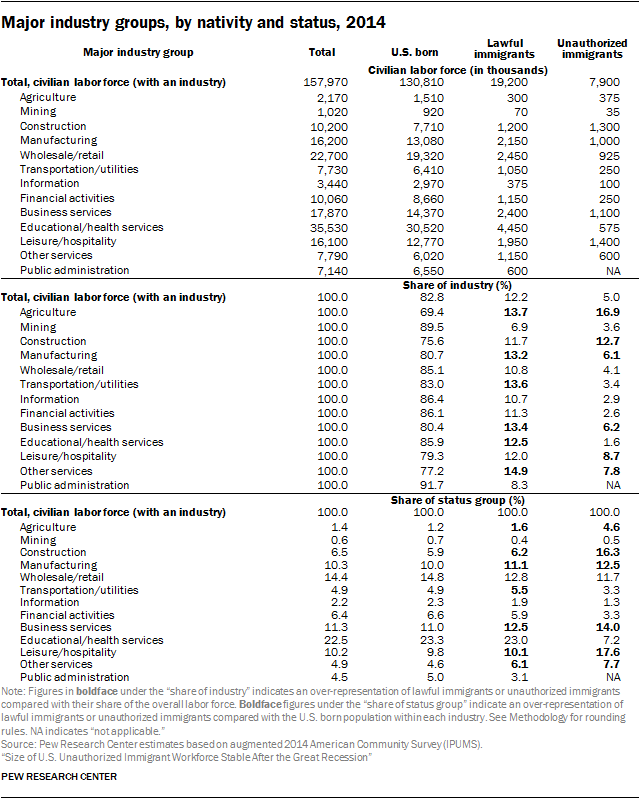
In 2014, unauthorized immigrants accounted for 17% of the workforce in the U.S. agriculture industry and 13% of the construction industry workforce, notably higher than their representation in the labor force overall. Even so, the number and share of U.S.-born workers in both sectors were notably higher, accounting for 69% of agricultural industry employment and 76% of construction industry employment. In these two sectors the number (and share) of unauthorized immigrant workers was slightly higher than that of lawful immigrant workers; in all other sectors, the number of lawful immigrant workers was substantially larger than for unauthorized immigrants.

Unauthorized immigrants are somewhat overrepresented in the leisure and hospitality sector, where they made up 9% of the workforce in 2014. In this sector, though, they were a lower share of the workforce than both U.S.-born employees (79%) and lawful immigrant employees (12%).

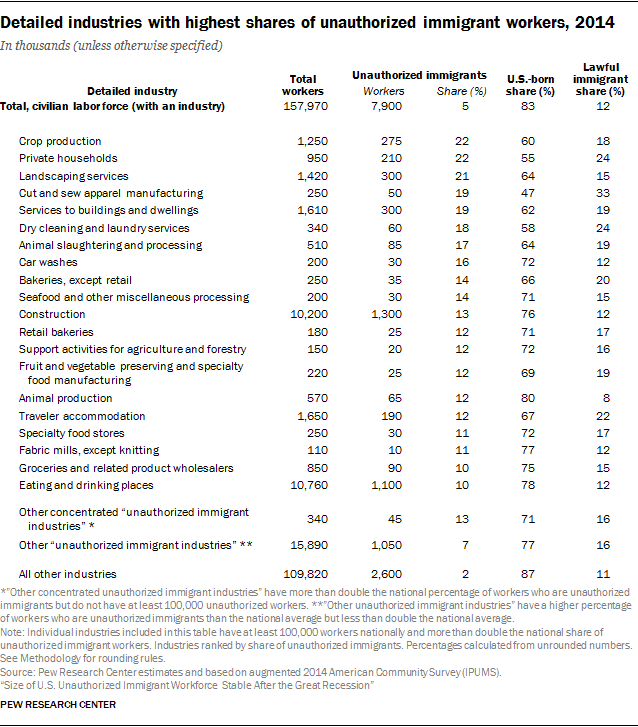
Some subsets of each major industry have particularly high concentrations of unauthorized immigrants among their workers. About a fifth or more of the workforce in the crop production industry (22%), private household employment (22%) and the landscaping industry (21%) consisted of unauthorized immigrants in 2014. Disproportionately high shares of unauthorized immigrants also worked in the apparel manufacturing industry (19%), the building maintenance sector (19%) and the dry cleaning and laundry industry (18%). (See the table here for data on specific industries.)

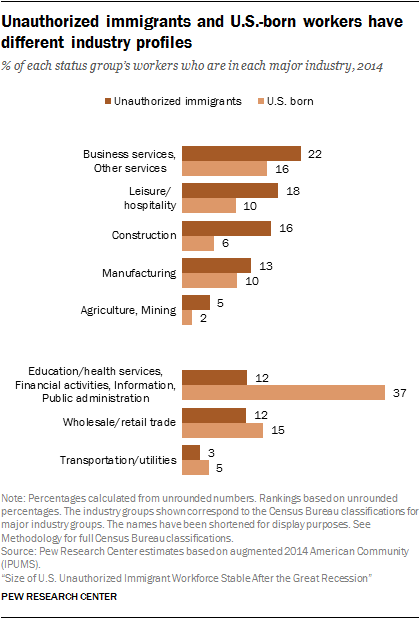
Unauthorized immigrants and U.S.-born workers have different industry profiles

How is the unauthorized immigrant workforce distributed across industrial sectors? A disproportionate share of unauthorized immigrants are employed in the business and other services sectors. These sectors cover a wide range of establishments such as legal services, advertising, landscaping and waste management, as well as personal services such as dry cleaning, nail salons and car washes. Fully 22% of unauthorized immigrants worked in these sectors in 2014, compared with 16% of U.S.-born workers.

A notably higher share of unauthorized immigrants (16% in 2014) work in the construction industry compared with U.S.-born workers and lawful immigrants (6%) each. Unauthorized immigrants also are more likely to work in the leisure and hospitality sector (18% did in 2014) compared with U.S.-born and lawful immigrant workers (each 10%).

In 2014, the agriculture and mining industries employed only 5% of all unauthorized immigrant workers, but that is higher than the share of U.S.-born workers (2%) who held jobs in that industry.

In some industries, the disparity is in the other direction. For example, 23% of U.S.-born workers were employed in the educational and health services sector in 2014, compared with only 7% of unauthorized immigrants who were so employed. An additional 7% of U.S.-born workers were employed in the financial sector, compared with 3% of unauthorized immigrant workers. The transport and utilities sector employed 5% of U.S.-born workers in 2014, but 3% of unauthorized immigrant workers.

State industry patterns

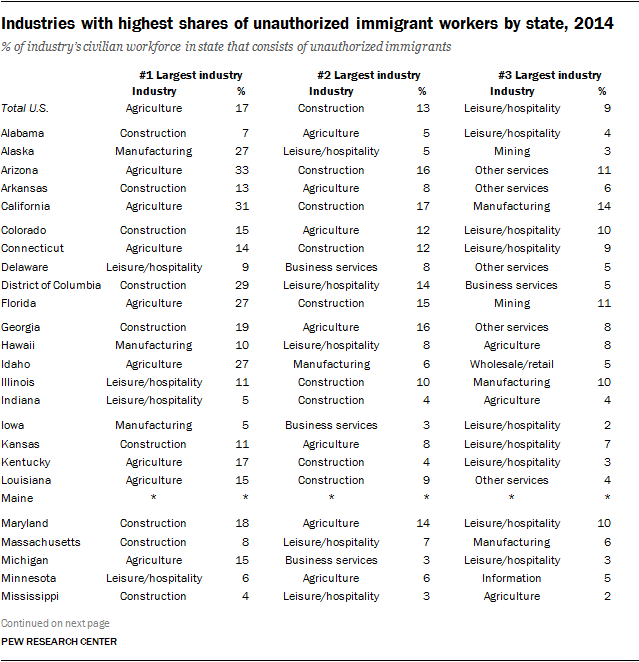
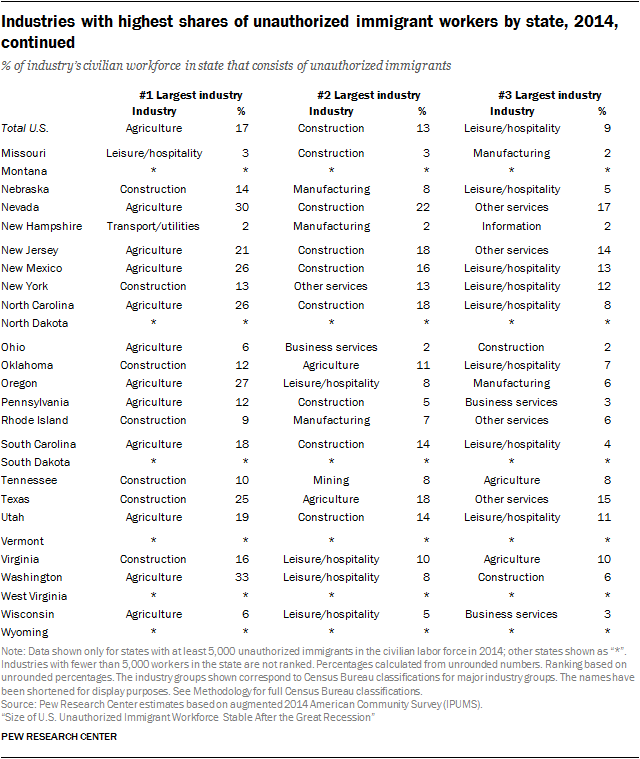
Echoing the national pattern, agriculture and construction are the industries where unauthorized immigrants make up the highest share of the overall civilian workforce in the largest number of states. Agriculture ranked first in 19 states in 2014 and second in nine more. Nationally, unauthorized immigrants accounted for 17% of workers in the agriculture industry in 2014, but were 5% of the total U.S. workforce. Construction ranked first in 16 states in 2014 and second in 16 more.1

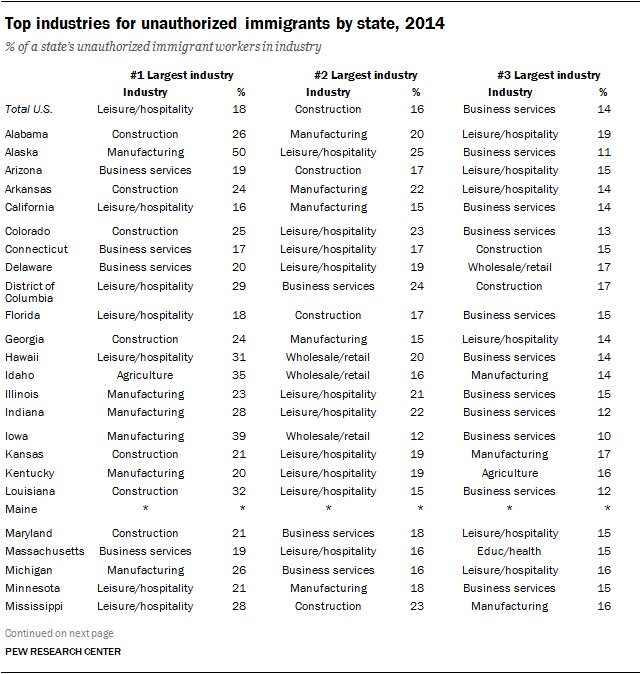
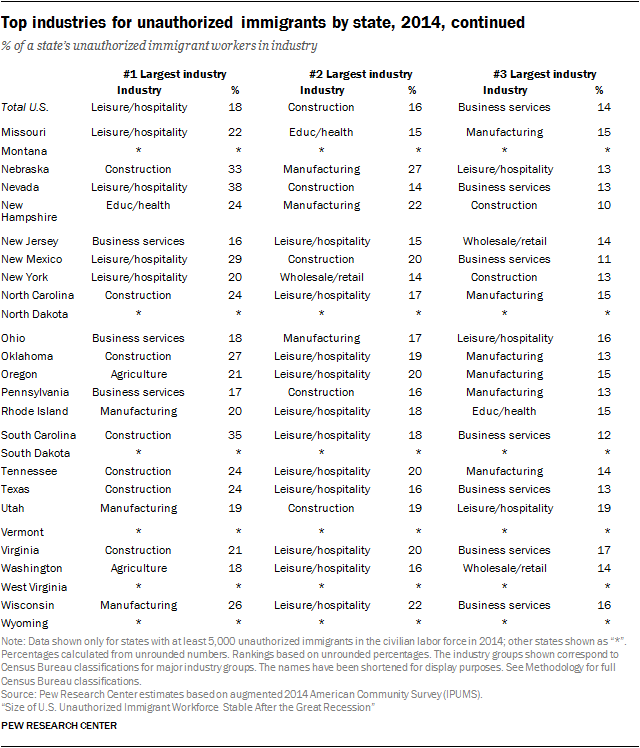
Looked at from another perspective – how unauthorized immigrant workers are distributed across industry sectors – the picture changes somewhat. Construction ranked first in 2014 as the industry that employs the largest share of unauthorized immigrant workers in 14 states, more states than any other industry. Nationwide, 16% of unauthorized immigrant workers were employed in the construction industry. The leisure and hospitality sector ranks second, employing the largest share of the unauthorized immigrant workforce in 10 states in 2014. (See tables here for the top industries for unauthorized immigrants by state in 2014).

2. Occupations of unauthorized immigrant workers

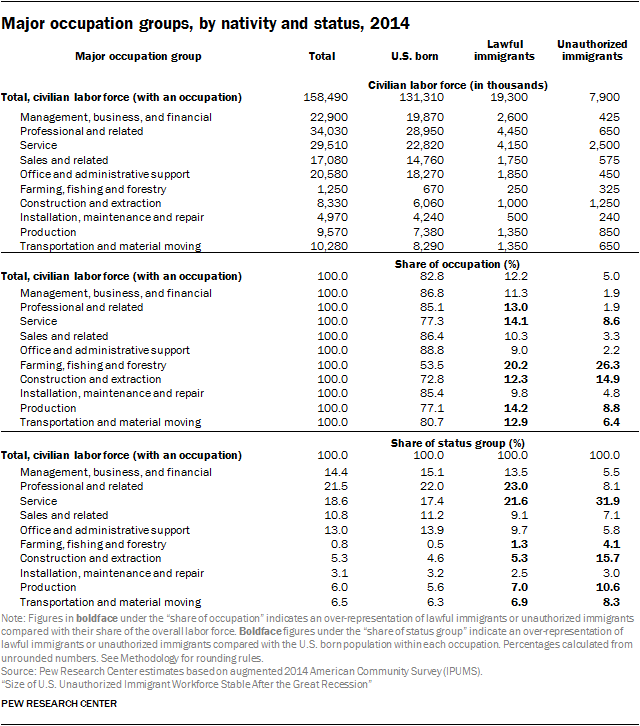
Although unauthorized immigrants made up 5% of the nation’s civilian workforce in 2014, they accounted for a much higher share (26%) of the workers in farming occupations. Unauthorized immigrants also were 15% of workers in construction jobs in 2014. U.S.-born workers accounted for a majority of workers in all major occupation groups, including 54% of the farming workforce in 2014 and 73% of the construction workforce. Only in construction jobs and farming jobs do unauthorized immigrant workers outnumber lawful immigrant workers (15% vs. 12%, and 26% vs. 20%). (See the table here for data on workers’ status by major occupation.)

Unauthorized immigrants also were somewhat overrepresented in 2014 in production jobs, which include manufacturing, food processing and textile occupations, where they were 9% of the workforce. In 2014, unauthorized immigrants also held 9% of service jobs, a larger share than their 5% of the overall workforce.

However, unauthorized immigrants made up only 2% each of management, professional and office support workers. In those occupational categories, U.S.-born workers made up at least 85% of the jobholders.

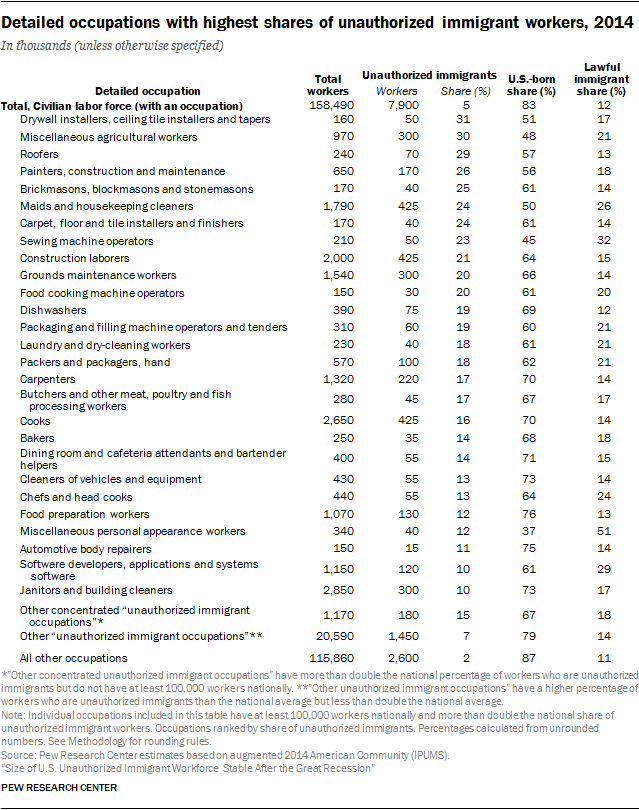
As with industries, there are some very specific occupations with particularly high concentrations of unauthorized immigrant workers. The occupations tend to be subgroups of the major occupations with the highest shares of unauthorized immigrant workers. The occupations where at least one-quarter of workers are unauthorized immigrants include drywall installers (31% in 2014), miscellaneous agricultural workers (30%), roofers (29%), construction painters (26%) and brick masons (25%). U.S.-born workers, however, account for the largest share of workers in all these occupations. (See the table here for data on these and other specific occupations.)

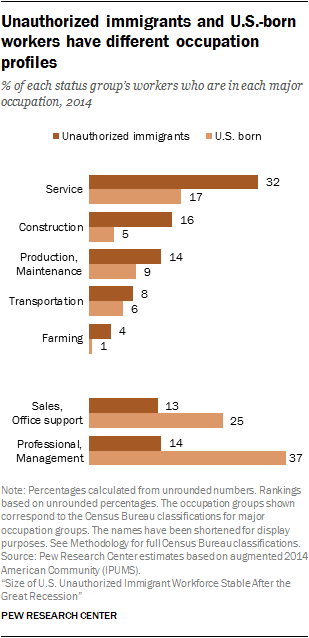
Unauthorized immigrants and U.S.-born workers have different occupation profiles

Compared with U.S.-born workers, unauthorized immigrant workers are more likely to be employed in service and construction occupations. About a third of unauthorized immigrant workers (32% in 2014) are employed in service occupations, compared with 17% of U.S.-born workers who hold these types of jobs. Construction jobs employed 16% of unauthorized immigrant workers in 2014, triple the share of U.S.-born workers (5%) in those occupations. Production and maintenance jobs employed 14% of unauthorized immigrant workers in 2014, but 9% of U.S.-born workers. Only 4% of unauthorized immigrant workers held farming jobs in 2014, but about 1% of U.S.-born workers did.

Among unauthorized immigrant workers, 6% held management jobs in 2014, compared with 15% of U.S.-born workers who did. An additional 8% were in professional occupations, compared with 22% of U.S.-born workers. Sales and office support occupations employed 13% of unauthorized immigrant workers, compared with 25% of U.S.-born workers who held these types of jobs.

State occupation patterns

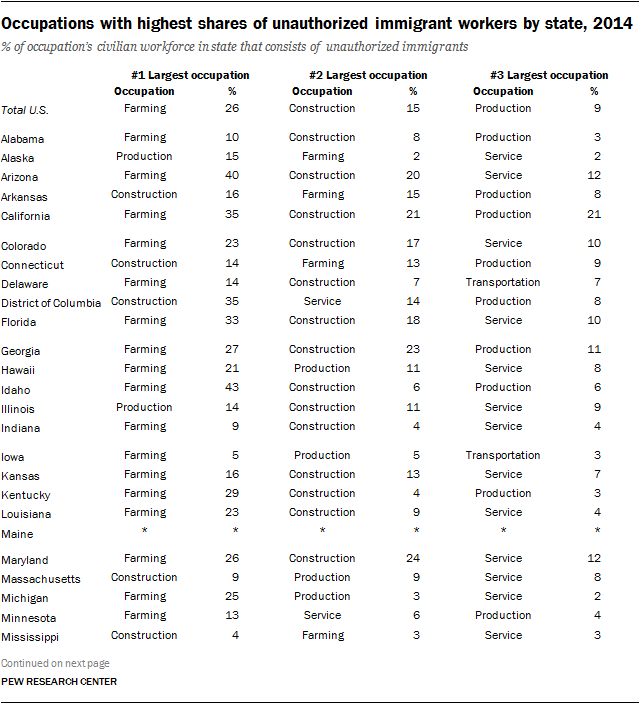
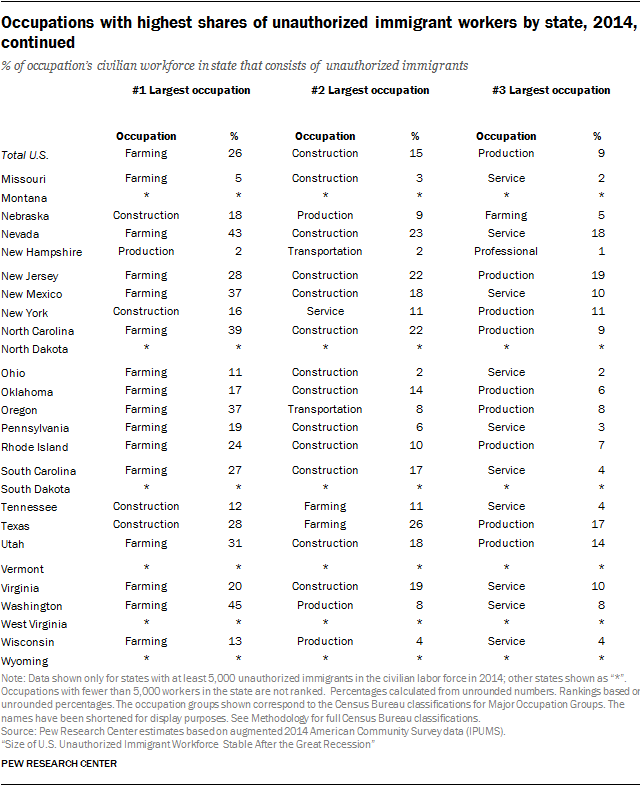
At the state level, farming is overwhelmingly the occupation where unauthorized immigrants make up the highest share of the workforce.4

It is the top occupation by this measure in 32 states. For the nation, unauthorized immigrant workers are overrepresented in farming jobs, where they made up 26% of workers in 2014 compared with the overall workforce, where they represented 5% of U.S. workers. Construction ranks first in nine states. Nationally, unauthorized immigrant workers held 15% of construction jobs in 2014.

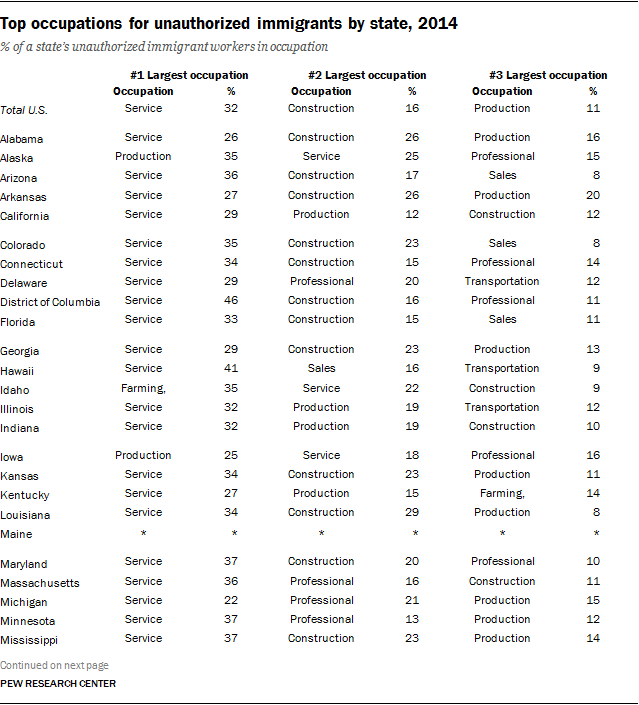
However, when looked at from the perspective of the distribution of the unauthorized immigrant workforce, service occupations rank first in 37 states and the District of Columbia. Service occupations also dominate at the national level, employing 32% of the unauthorized immigrant workforce. (See tables here for the top occupations for unauthorized immigrants by state in 2014).

Acknowledgments

This report was written by Jeffrey S. Passel, senior demographer, and D’Vera Cohn, senior writer/editor. Editorial guidance was provided by James Bell, vice president of global strategy; Mark Hugo Lopez, director of Hispanic research; and Claudia Deane, vice president, research. Antonio Flores, Gustavo López and Jynnah Radford, research assistants, created charts and tables; number-checked the text, graphics and interactive maps; and assisted with formatting and production. Michael Keegan, information graphics designer, created the maps used in this report and developed some of its charts. Danielle Alberti, web developer, developed the interactive versions of maps and tables that accompany this report. David Kent was the copy editor. Travis Mitchell, digital producer, provided web support. All are on the staff of Pew Research Center.

An earlier draft of this paper was prepared for presentation in Paris to the Organization for Economic Co-operation and Development (OECD) Working Party on Migration.


Methodology

The unauthorized immigrant estimates throughout this report are produced using a multistage method that first subtracts the estimated lawful foreign-born population from the total foreign-born population to derived estimates of the unauthorized immigrant population (for large states and the balance of the country, for adults and children and by region of birth). The residuals then are used as control totals for a probabilistic process that assigns legal status to individuals in the survey based on their age, region of birth, family relationships and other socio-demographic characteristics. Finally, the resulting estimates are adjusted to take into account persons omitted from the survey.

The main source of data for estimates from 2005 to 2014 is the U.S. Census Bureau’s American Community Survey, tabulated from the public-use file obtained from the Integrated Public-Use Microdata Series or IPUMS (Ruggles et al., 2015). Estimates for 1995 and 2000 use the bureau’s March supplements to the Current Population Survey. See Passel and Cohn 2016 for more detail.

The estimates included here supersede all previously published estimates of unauthorized immigrants, and may differ slightly from previously published estimates.

The labor force includes all people ages 16 and older who are working or looking for work. For the analyses of occupations and industries, we exclude people who did not report an occupation or industry. In our analysis, we also exclude people in the military or with a military occupation. These exclusions drop about 2% of the total labor force of roughly 161 million – 2.9 million are excluded from the occupation analyses and 3.4 million from the industry analyses. About 120,000 unauthorized immigrants, or 1.5% of those in the workforce, are excluded from this analysis because they do not report an occupation or industry; unauthorized immigrants are generally not eligible to be in the military or to hold military employment, so are not excluded for that reason. Unemployed people are only excluded if they do not report an occupation or industry, although most do report them.

Rounding of estimates

All estimates for immigrant populations, lawful and unauthorized, are presented as rounded numbers to avoid the appearance of unwarranted precision in the estimates. The rounding conventions for immigrant estimates, dependent somewhat on data sources, are:

Greater than 10,000,000         Nearest 100,000

1,000,000-10,000,000              Nearest 50,000

250,000-1,000,000                    Nearest 25,000

100,000-250,000                        Nearest 10,000

5,000-100,000                             Nearest 5,000

<5,000                                             Shown as <5,000


State and national data for the total and U.S.-born populations are rounded to the nearest 10,000. Unrounded numbers are used for significance tests, for plotting charts and for computations of differences and percentages. Where differences are reported, they are computed from unrounded estimates and then rounded separately. Because each figure is rounded separately, the rounded estimates may not add to rounded totals. Similarly, percentages computed from rounded numbers may differ from the percentages shown in this report.

Industry and occupation category labels

The Census Bureau has three different levels of aggregation each for industry and occupation. At the highest level, there are 12 classifications for “major occupation” groups (11 for civilians, plus the armed forces). At the next level, there are 23 “detailed occupation” groups, but eight of them are identical to the “major” groups; the three major occupation groups for management, professional and service occupations are subdivided into 15 smaller, detailed groups. Finally, there are a large number of very specific occupation categories – almost 600 – which can be grouped into either the “detailed” or “major” groups. So, for example, the code for “Aerospace engineers” (1320) is part of the detailed category for “Architecture and engineering occupations” which, in turn, is part of the major category of “Professional and related occupations.”

For industries, the highest level has 14 “major industry” groups (13 for civilians and one for the armed forces). At the next level, there are 52 “detailed industry” groups. Unlike with occupations, only four of the “major” groups are identical to “detailed” groups. Finally, there are 273 very specific industry categories that can be grouped into either the “detailed” or “major” groups. So, for example, the industry called “Retail bakeries” (code 1190) is part of the detailed category for “Food manufacturing” which, in turn, is part of the major category of “Manufacturing.”

The analyses presented here use the “major” categories for both occupations and industries. Some data are presented for the very specific occupations and industries with the highest concentrations of unauthorized immigrants.

For ease of presentation, the full titles of many industry and occupation categories have been condensed from the Census Bureau’s terminology in some figures and text. If so, they are shortened as follows:


Agriculture, forestry, fishing, and hunting      Agriculture

Mining                                                                     no change

Construction                                                          no change

Manufacturing                                                       no change

Wholesale and retail trade                                  Wholesale/retail

Transportation and utilities                                Transport/utilities

Information                                                            no change

Financial activities                                                no change

Professional and business services                    Business services

Educational and health services                         Education/health

Leisure and hospitality                                         Leisure/hospitality

Other services                                                         no change

Public administration                                           no change

Data on “major” occupation categories are sometimes condensed in figures and the text. If so, they are shortened as follows:

Management, business, and financial             Management

Professional and related                                     Professional

Service                                                                    no change

Sales and related                                                  Sales

Office and administrative support                   Office support

Farming, fishing, and forestry                          Farming (or Agriculture)

Construction and extraction                             Construction

Installation, maintenance, and repair            Maintenance

Production                                                            no change

Transportation and material moving              Transportation

References in the text, text charts and tables can be cross-referenced to the lists above.

More information on the Census Bureau’s industry and occupation categories can be found here: http://www.census.gov/people/io/

Appendix A: References

Krogstad, Jens Manuel and Ana Gonzalez-Barrera. 2014. “If original DACA program is a guide, many eligible immigrants will apply for deportation relief.” Washington, D.C.: Pew Research Center, December.

National Bureau of Economic Research. 2012. “US Business Cycle Expansions and Contractions.” Cambridge, MA.

Passel, Jeffrey S. and D’Vera Cohn. 2016. “Overall Number of U.S. Unauthorized Immigrants Holds Steady Since 2009.” Washington, D.C.: Pew Research Center, September.

Passel, Jeffrey S. and D’Vera Cohn. 2015. “Share of Unauthorized Immigrant Workers in Production, Construction Jobs Falls Since 2007.” Washington, D.C.: Pew Research Center, March.

Passel, Jeffrey S. and D’Vera Cohn. 2014. “Unauthorized Immigrant Totals Rise in 7 States, Fall in 14.” Washington, D.C.: Pew Research Center, November.

[Machine-readable database]

U.S. Census Bureau. 2016. “Industry and Occupation.” Washington, D.C.

U.S. Department of Homeland Security. 2016a. “Number of I-821D, Consideration of Deferred Action for Childhood Arrivals by Fiscal Year, Quarter, Intake, Biometrics and Case Status: 2012-2016 (March 31).” Washington, D.C.: U.S. Citizenship and Immigration Services.

U.S. Department of Homeland Security. 2016b. “Consideration of Deferred Action for Childhood Arrivals (DACA).” Washington, D.C.: U.S. Citizenship and Immigration Services. https://www.uscis.gov/humanitarian/consideration-deferred-action-childhood-arrivals-daca

U.S. Department of Homeland Security. 2016c. “Temporary Protected Status.” Washington, D.C.: U.S. Citizenship and Immigration Services.

U.S. Department of Homeland Security. 2014. “Annual Report, 2014: U.S. Citizenship and Immigration Services, Ombudsman.” Washington, D.C.: U.S. Citizenship and Immigration Services, June, p. 41.

Warren, Robert and John Robert Warren. 2013. “Unauthorized Immigration to the United States: Annual Estimates and Components of Change, by State, 1990 to 2010.” International Migration Review 47 (2, June): 296-329.

Appendix B: Additional Charts

Among states, Nevada has highest share of unauthorized immigrants in workforce

Appendix C: Additional map

Appendix D: Detailed tables

Major occupation groups, by nativity and status, 2014

Major industry groups, by nativity and status, 2014

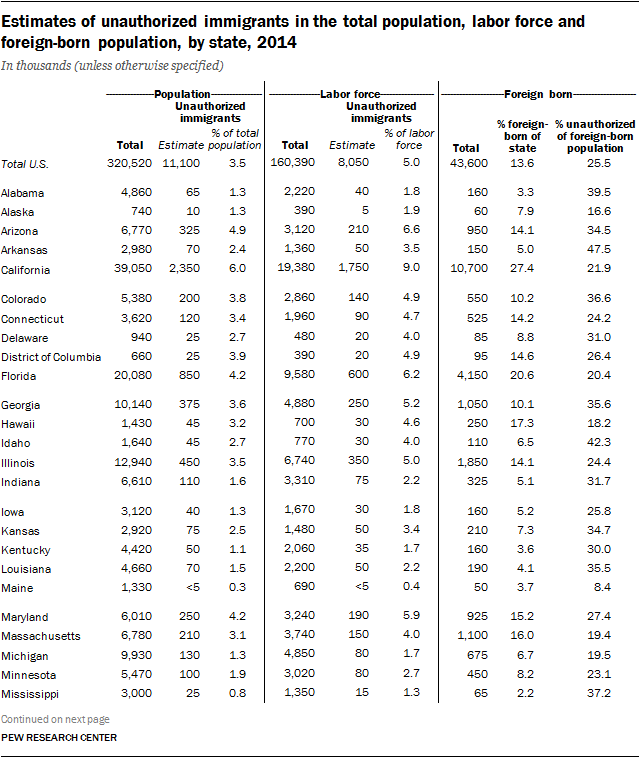
Estimates of unauthorized immigrants in the total population, labor force and foreign-born population, by state, 2014


Estimates of unauthorized immigrants in the total population, labor force and foreign-born population, by state, 2014, continued

Detailed occupations with highest shares of unauthorized immigrant workers, 2014

Detailed industries with highest shares of unauthorized immigrant workers, 2014

Top occupations for unauthorized immigrants by state, 2014


Occupations with highest shares of unauthorized immigrant workers by state, 2014


Occupations with highest shares of unauthorized immigrant workers by state, 2014, continued

Top industries for unauthorized immigrants by state, 2014


Top industries for unauthorized immigrants by state, 2014, continued


Industries with highest shares of unauthorized immigrant workers by state, 2014


Industries with highest shares of unauthorized immigrant workers by state, 2014, continued