Pew Research Center

FOR RELEASE NOVEMBER 19, 2015

More Mexicans Leaving Than Coming to the U.S.

Net Loss of 140,000 from 2009 to 2014; Family Reunification Top Reason for Return

BY Ana Gonzalez-Barrera

FOR MEDIA OR OTHER INQUIRIES:

Communications Department
202.419.4372
www.pewresearch.org

RECOMMENDED CITATION

Pew Research Center, November 2015, "More Mexicans Leaving Than Coming to the U.S."

About Pew Research Center

Pew Research Center is a nonpartisan, nonadvocacy fact tank that informs the public about the issues, attitudes and trends shaping the world. It does not take policy positions. The Center conducts public opinion polling, demographic research, computational social science research and other data-driven research. It studies politics and policy; news habits and media; the internet and technology; religion; race and ethnicity; international affairs; social, demographic and economic trends; science; research methodology and data science; and immigration and migration. Pew Research Center is a subsidiary of The Pew Charitable Trusts, its primary funder.

© Pew Research Center 2026

Table of contents

  • About Pew Research Center
  • More Mexicans Leaving Than Coming to the U.S.
  • Chapter 1: Migration Flows Between the U.S. and Mexico Have Slowed – and Turned Toward Mexico
  • Chapter 2: Mexican Immigrants Then and Now
  • Chapter 3: Mexicans Report Fewer Connections in the U.S.
  • References
  • About This Report
  • Appendix A: Mexican and Asian Immigrants Compared
  • Appendix B: Methodology

More Mexicans Leaving Than Coming to the U.S.

Net Loss of 140,000 from 2009 to 2014; Family Reunification Top Reason for Return

More Mexican immigrants have returned to Mexico from the U.S. than have migrated here since the end of the Great Recession, according to a new Pew Research Center analysis of newly available government data from both countries. The same data sources also show the overall flow of Mexican immigrants between the two countries is at its smallest since the 1990s, mostly due to a drop in the number of Mexican immigrants coming to the U.S.

Measuring migration flows between Mexico and the U.S. is challenging because there are no official counts of how many Mexican immigrants enter and leave the U.S. each year. This report uses the best available government data from both countries to estimate the size of these flows. The Mexican data sources — a national household survey, and two national censuses — asked comparable questions about household members’ migration to and from Mexico over the five years previous to each survey or census date. In addition, estimates of Mexican migration to the U.S. come from U.S. Census Bureau data, adjusted for undercount, on the number of Mexican immigrants who live in the U.S. (See text box below for more details.)


Calculating the Flow from the U.S. to Mexico

To calculate estimates of how many people left the U.S. for Mexico, this report uses data from the 2014 Mexican National Survey of Demographic Dynamics, or ENADID and the 2010 and 2000 Mexican decennial censuses. Each asked all respondents where they had been living five years prior to the date when the survey or census was taken. The answers to this question provide an estimated count of the number of people who moved from the U.S. to Mexico during the five years prior to the survey date. A separate question targets more recent emigrants—people who left Mexico. It asks whether anyone from the household had left for another country during the previous five years; if so, additional questions are asked about whether and when that person or people came back and their reasons for returning to Mexico.

To calculate estimates of how many Mexicans left Mexico for the U.S., this report also uses U.S. Census Bureau’s American Community Survey (2005-2013) and the Current Population Survey (2000-2014), both adjusted for undercount, which ask immigrants living the U.S. their country of birth and the year of their arrival in the U.S.

The decline in the flow of Mexican immigrants to the U.S. is due to several reasons (Passel et al, 2012). The slow recovery of the U.S. economy after the Great Recession may have made the U.S. less attractive to potential Mexican migrants and may have pushed out some Mexican immigrants as the U.S. job market deteriorated.

In addition, stricter enforcement of U.S. immigration laws, particularly at the U.S.-Mexico border (Rosenblum and Meissner, 2014), may have contributed to the reduction of Mexican immigrants coming to the U.S. in recent years. According to one indicator, U.S. border apprehensions of Mexicans have fallen sharply, to just 230,000 in fiscal year 2014 – a level not seen since 1971 (Krogstad and Passel, 2014). At the same time, increased enforcement in the U.S. has led to an increase in the number of Mexican immigrants who have been deported from the U.S. since 2005 (U.S. Department of Homeland Security, 2014).

Mexican Immigrant Population in the U.S. in Decline

Mexican immigrants have been at the center of one of the largest mass migrations in modern history. Between 1965 and 2015 more than 16 million Mexican immigrants migrated to the United States – more than from any other country (Pew Research Center, 2015). In 1970, fewer than 1 million Mexican immigrants lived in the U.S. By 2000, that number had grown to 9.4 million, and by 2007 it reached a peak at 12.8 million. Since then, the Mexican-born population has declined, falling to 11.7 million in 2014, as the number of new arrivals to the U.S. from Mexico declined significantly (Passel et al., 2012); meanwhile the reverse flow to Mexico from the U.S. is now higher.

The decline in the number of Mexican immigrants residing in the U.S. has been mostly due to a drop of more than 1 million unauthorized immigrants from Mexico from a peak of 6.9 million in 2007 to an estimated 5.6 million in 2014 (Passel and Cohn, 2014).

The View From Mexico

In Recent Years, Fewer Mexicans Have Friends or Family in the U.S.

The drop in the number of Mexicans living in the U.S. also is reflected in the share of adults in Mexico who report having family or friends living in the U.S.  with whom they keep in touch. In 2007, 42% of Mexican adults said they kept in contact with acquaintances living in the U.S., while today, 35% say so, according to newly released results from the Pew Research Center’s 2015 survey in Mexico.1

Asked about their willingness to migrate to the U.S., 35% say they would move to the U.S. if they had the opportunity and means to do so, including 20% of adults in Mexico who would do so without authorization. This is unchanged from 2009 when a third of adults in Mexico said they would be willing to migrate to the U.S., and 18% said they would do it without authorization (Pew Research Center, 2009).

Roadmap to the Report

This report is organized as follows. The first chapter analyzes statistics on migration between Mexico and the U.S. from data sources in both countries. The second chapter uses U.S. Census Bureau data to examine characteristics of Mexican immigrants residing in the U.S. in 1990 and 2013. The third chapter, based on a nationally representative survey of adults living in Mexico, examines trends in Mexican attitudes about life in the U.S. and future interest in migrating there, and their opinion of U.S. President Barack Obama’s executive action to expand the number of unauthorized immigrants who are allowed to stay in the U.S. legally and work temporarily. Appendix A includes a statistical portrait of Mexican immigrants, compared with all Latin American immigrants and Asian immigrants, while Appendix B explains the report’s methodology and data sources.

Is Mexico Still the Largest Source of New Immigrants to the U.S.?

For decades, Mexico has been the top source of newly arrived immigrants to the U.S., but with a recent decline in the flow of new immigrants to the U.S. from Mexico, and an increase in the number of new immigrant arrivals from China and India, Mexico may no longer be the top source of U.S. immigrants. The U.S. Census Bureau recently reported that China overtook Mexico in 2013 as the leading country for new immigrants (Jensen, 2015). However, under a different measure, Mexico remains the top source of immigrants – at least for now, according to a new Pew Research Center analysis of Census Bureau data.

Estimates of the number of newly arrived immigrants vary depending on the measure used. The Census Bureau’s analysis was based on the number of foreign-born people who said they lived outside of the U.S. in response to the American Community Survey question, “Did this person live in this house or apartment one year ago?” Using this measure for 2013, about 147,000 Chinese immigrants came to the U.S., compared with 129,000 Indian immigrants and 125,000 Mexican immigrants. (The difference between the number of Indian and Mexican immigrants is not statistically significant.)

By contrast, Mexico remains the world’s top source of newly arrived immigrants to the U.S. under a different American Community Survey question that asks, “When did this person come to live in the U.S.?” Under this measure, 246,000 Mexicans, 195,000 Chinese and 199,000 Indians arrived in the U.S. in 2013 and 2012. (We report two years because the 2013 arrivals represent only about half of the year given the way the data are collected.)

Regardless of the exact number of new immigrants from each country arriving in the U.S. each year, the trends are clear: Over the past decade, immigration from China and India to the U.S. has increased steadily, while immigration from Mexico has declined sharply. This shift in immigration is noteworthy because since 1965 Mexico has sent more immigrants (16.2 million) to the United States than any other country, in what has been the largest wave of immigration in U.S history (Pew Research Center, 2015).

A Note on Terminology

“Foreign born” refers to people born outside of the United States, Puerto Rico or other U.S. territories and neither of their parents was a U.S. citizen. The terms “foreign born” and “immigrant” are used interchangeably in this report.

“U.S. born” refers to individuals who are U.S. citizens at birth, including people born in the United States, Puerto Rico or other U.S. territories, as well as those born elsewhere to parents who were U.S. citizens. The U.S.-born population encompasses the second generation and the third and higher generation.

“Legal immigrants” are those who have been granted legal permanent residence, those granted asylum, people admitted as refugees and people admitted to the U.S. under a set of specific authorized temporary statuses for longer-term residence and work. This group includes “naturalized citizens,” legal immigrants who have become U.S. citizens through naturalization; “legal permanent resident aliens,” who have been granted permission to stay indefinitely in the U.S. as permanent residents, asylees or refugees; and “legal temporary migrants” (including students, diplomats and “high-tech guest workers”), who are allowed to live and, in some cases, work in the U.S. for specific periods of time (usually longer than one year).

“Unauthorized immigrants” are all foreign-born non-citizens residing in the country who are not legal immigrants. These definitions reflect standard and customary usage by the Department of Homeland Security and academic researchers. The vast majority of unauthorized immigrants entered the country without valid documents or arrived with valid visas but stayed past their visa expiration date or otherwise violated the terms of their admission.

“Immigration” to the United States includes only people who are intending to settle in the United States. U.S. decennial censuses and surveys include people whose usual residence is the United States. Consequently, migrants from Mexico who are in the U.S. for short periods to work, visit or shop are generally not included in measures of the U.S. population.

“Return migration” is a concept based on a census or survey question about prior residence, specifically residence five years before the census or survey. A “return migrant” to Mexico is a person who lived outside of Mexico (usually in the U.S.) five years before the census or survey and is back in Mexico at the time of the survey.

“Recent migrants” are identified through a question in Mexican censuses and surveys that asks whether any members of the household have left to go to the U.S. in a prior period, usually the previous five years. The recent migrants may be back in the household or elsewhere in Mexico (in which case they have “returned” to Mexico) or they may still be in the U.S. or in another country.

Chapter 1: Migration Flows Between the U.S. and Mexico Have Slowed – and Turned Toward Mexico

Overall, migration flows between the U.S. and Mexico have slowed down. But the net flow from Mexico to the U.S. is now negative, as return migration of Mexican nationals and their children is now higher than migration of Mexicans heading to the U.S. These new findings are based on Pew Research Center estimates using U.S. Census Bureau surveys to measure inflow of Mexican immigrants to the U.S. and the National Survey on Demographic Dynamics (ENADID) from Mexico’s chief statistical agency (INEGI), which measures the number of Mexican immigrants who have moved back to Mexico after living in the U.S. between 2009 and 2014.2

Compared with similar five-year measures from 2000 and 2010, immigration of Mexicans to the U.S. is markedly below its peak in 2000. Between 1995 and 2000, close to 3 million Mexican-born immigrants left for the U.S.; between 2005 and 2010, that number decreased by about half, to about 1.4 million; and between 2009 and 2014 the number of Mexican immigrants heading to the U.S. was about 870,000.

Going the other way, about 1 million people left the U.S. for Mexico between 2009 and 2014. This is a lower number than between 2005 and 2010, when return migration reached close to 1.4 million, but it is significantly higher than a decade earlier; it is also higher than the number of Mexican nationals coming to the U.S.

Among the 1 million migrants returning to Mexico from the U.S., there were 720,000 who had been residing in the U.S. in 2009 and were living in Mexico in 2014. An additional 180,000 were recent migrants who were living in Mexico in 2009 but left for the U.S. and came back to Mexico between 2009 and 2014. And an additional 100,000 were children under the age of 5 who had been born in the U.S. and were living in Mexico in 2014.

As the flow of new immigrants slows and the number of returnees remains high, the net flow from Mexico to the U.S. is now negative, though both flows are smaller than they were five years ago.

The negative immigration flow from Mexico to the U.S. also is reflected in the number of Mexican immigrants currently residing in the U.S. with and without authorization, which has continued to drop since reaching its peak in 2007 – from 12.8 million to 11.7 million in 2014.

Number of Unauthorized Mexican Immigrants Declines

Mexican Unauthorized Immigrant Population in the U.S. Below Its Peak

The Mexican unauthorized immigrant population has continued to decline since reaching a peak of 6.9 million in 2007. Preliminary estimates from the Pew Research Center show that in 2014 there were about 5.6 million Mexican immigrants residing in the U.S. without authorization. This reflects a drop of about more than 1 million from 2007.

The drop in the number of unauthorized Mexican immigrants residing in the U.S. partly reflects tougher enforcement at the southwest border. In fiscal 2013, deportations of Mexican immigrants reached a record high of nearly 315,000, an increase of 86% since 2005, when a policy shift made it more likely that Mexican border crossers would get deported, be barred from legal re-entry for a number of years and risk criminal prosecution if entering illegally again in the future, instead of simply returned to Mexico with no consequences attached (Rosenblum and Meissner, 2014).

The smaller number of unauthorized Mexican immigrants may also reflect a reduction in the number of Mexicans attempting to enter the country illegally through the southwest border. In fiscal 2014, the number of Mexican immigrants apprehended at the southwest border of the U.S. dropped to about 227,000, a level of apprehensions not seen since the early 1970s (Krogstad and Passel, 2014). In contrast, the number of apprehensions of non-Mexican immigrants, mostly from Central America, reached a peak at close to 253,000. This was the first time on record that Border Patrol apprehended more non-Mexican immigrants than Mexican immigrants at the southwest border.

Although the number of unauthorized immigrants from Mexico has been declining, they still amount to about half of the total U.S. unauthorized immigrant population. Today, unauthorized Mexican immigrants make up a lower share (48%) of the Mexican-born population living in the U.S. compared with their peak in 2007 (54%).

Reuniting With Family Primary Reason for Return Migration to Mexico

From 2009 to 2014, 1 million Mexicans and their families (including U.S.-born children) left the U.S. to move to Mexico, according to data from the 2014 Mexican National Survey of Demographic Dynamics (ENADID).

Family Reunification Main Reason for Return Mexican Migrants to Go Home

According to the survey, the pull of family is the primary engine of return migration to Mexico. Fully six-in-ten (61%) of those Mexicans who reported that in 2009 they were living in the U.S. and by 2014 were back in Mexico said they had moved back either to reunite with family or to start a family. In comparison, 14% said they had been deported from the U.S., and only a small share (6%) gave employment reasons (either to look for a job or because they got a job in Mexico).3

Lack of work in the U.S. was a more important reason for the 180,000 return migrants who lived in Mexico in 2009, left for the U.S. after that, and came back to Mexico between 2009 and 2014. One-quarter (25%) of more recent returnees said the main reason they came back was they had not been able to find a job, while 40% said the main reason was to reunite with family.

Chapter 2: Mexican Immigrants Then and Now

With the slowdown in recent immigration, Mexican immigrants living in the United States today are a more settled population than they were 25 years ago, an era before large numbers of their authorized and unauthorized fellow citizens crossed the U.S.-Mexico border. Compared with 1990, Mexican immigrants in 2013 were considerably older (median age of 39 vs. 29), better educated (42% with high school diploma or more vs. 24%) and had been in the U.S. for longer (77% had been in the U.S. for more than a decade, compared with 50%).

Economically, Mexican immigrants both gained and lost ground. While median personal earnings increased about $2,700 since 1990 (in 2013 dollars), the median household income of Mexican immigrants dropped by about $1,700 in the same period. This likely reflects the effects of the Great Recession in the U.S. and the slow recovery.

Chapter 3: Mexicans Report Fewer Connections in the U.S.

The decline in the number of Mexican immigrants living in the U.S. also is reflected in a 2015 Pew Research Center survey done in Mexico, in which a decreasing share of Mexicans report connections in the U.S. Today, 35% of adults in Mexico say they have friends or relatives they regularly communicate with or visit in the U.S., down 7 percentage points from 2007, when the Mexican immigrant population in the U.S. had reached its peak.

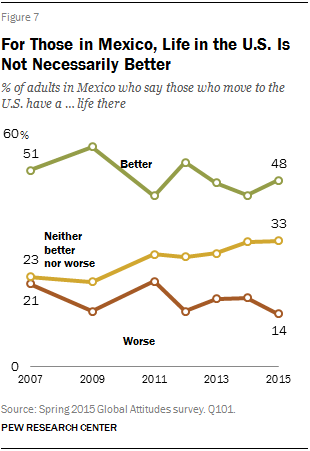
For Those in Mexico, Life in the U.S. Is Not Necessarily Better

Mexican adults with higher incomes are more likely to report having family or friends in the U.S. with whom they keep in touch compared with those with lower incomes (41% vs. 28%). Similarly, adults in Mexico with higher levels of education are more likely than those with less education to say they have close connections in the U.S. (43% vs. 31%).

Still, the prospect of life in the United States has not lost its appeal. About half of all adults in Mexico think those who have moved to the U.S. lead better lives than those left behind, a similar share as in 2007 (48% in 2015 vs. 51% in 2007). At the same time, though, an increasing share (33%) says life is neither better nor worse north of the border than did so in 2007 (23%). And only 14% of Mexicans believe life in the U.S. is worse than in Mexico for those who migrate.

Yet the percentage of Mexicans who are inclined to move to the U.S. remains steady at roughly a third (35%), which includes 20% who say they would do so without authorization, while 14% say they would only do it with authorization.4 Men (40% would move) and young adults ages 18 to 29 (43%) are more likely than women (29%) and those ages 30 or older (31%) to say they would go to the U.S. if they could.

Opinions about Obama’s Executive Action

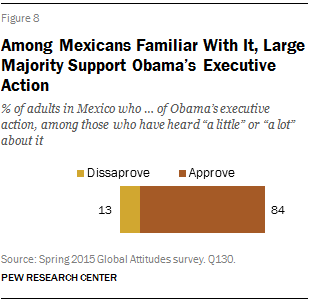
Among Mexicans Familiar With It, Large Majority Support Obama’s Executive Action

Although smaller percentages of adults in Mexico report having connections in the U.S. in recent years, 60% have heard “a little” or “a lot” about President Obama’s issuing an executive action that expands the number of unauthorized immigrants who are allowed to stay and work in the U.S. Among those who have heard of it, a large majority (84%) approves of this new policy, while only 13% oppose the action.

References

Cuddington, Danielle and Richard Wike. 2015. “Declining Ratings for Mexico’s Peña Nieto: Fewer Say Government Is Making Progress against Drug Cartels.” Washington, D.C.: Pew Research Center, August.

Jensen, Eric. 2015. “China Replaces Mexico as the Top Sending Country for Immigrants in the United States.” Washington, D.C.: U.S. Census Bureau, May.

Kohut et al. 2009. “Most Mexicans See Better Life in U.S.—One-In-Three Would Migrate: Troubled by Crime, The Economy, Drugs and Corruption.” Washington, D.C.: Pew Research Center, September.

Krogstad, Jens Manuel and Jeffrey S. Passel. 2014. “U.S. Border Apprehensions of Mexicans Fall to Historic Lows.” Washington, D.C.: Pew Research Center, December.

Passel, Jeffrey S. and D’Vera Cohn. 2009. “A Portrait of Unauthorized Immigrants in the United States.” Washington, D.C.: Pew Research Center, April.

Passel, Jeffrey S. and D’Vera Cohn. 2014. “Unauthorized Immigrant Totals Rise in 7 States, Fall in 14: Decline in Those From Mexico Fuels Most State Decreases.” Washington, D.C.: Pew Research Center, November.

Passel, Jeffrey S. and D’Vera Cohn. 2010. “U.S. Unauthorized Immigration Flows are Down Sharply Since Mid-Decade.” Washington, D.C.: Pew Research Center, September.

Passel, Jeffrey S., D’Vera Cohn and Ana Gonzalez-Barrera. 2012. “Net Migration from Mexico Falls to Zero—and Perhaps Less.” Washington, D.C.: Pew Research Center, April.

Pew Research Center. 2009. “Most Mexicans See Better Life in U.S. – One-in-Three Would Migrate.” Washington, D.C.: September.

Pew Research Center. 2015. “Modern Immigration Wave Brings 59 Million to U.S., Driving Population Growth Change Through 2065: Views of Immigration’s Impact on U.S. Society Mixed.” Washington, D.C.: September.

Rosenblum, Marc R. and Doris Meissner. 2014. “The Deportation Dilemma: Reconciling Tough and Humane Enforcement.” Washington, D.C.: Migration Policy Institute, April.

U.S. Department of Homeland Security, Office of Immigration Statistics. 2014. “2013 Yearbook of Immigration Statistics.” Washington, D.C.: U.S. Department of Homeland Security, October.

About This Report

This report analyzes the magnitude and trend of recent migration flows between Mexico and the United States, the motivations of Mexican immigrants who left the U.S. and returned to their home country, the characteristics of Mexican-born immigrants in the U.S. now and two and a half decades ago, the connections Mexicans have with family and friends in the U.S., and their views about life in the U.S. and U.S. immigration policy.

The report draws on data sources from both Mexico and the U.S. The principal Mexican data source is the Survey of Demographic Dynamics of 2014 (Encuesta Nacional de Dinámica Demográfica or ENADID), and previously published results based on the 2000 and 2010 Mexican decennial censuses. The principal U.S. data sources are the Census Bureau’s Current Population Survey (CPS) March 1994 to 2014 Annual Social and Economic Supplements, the American Community Survey (ACS) for 2005 to 2013, and U.S. decennial censuses from 1850 to 2000. The report also uses data from Pew Research Center’s spring 2015 survey in Mexico.

This report was written by Research Associate Ana Gonzalez-Barrera. Mark Hugo Lopez, Claudia Deane and D’Vera Cohn provided editorial guidance in the drafting of this report. Richard Wike, Katie Simmons and Jacob Poushter provided comments on earlier drafts. Senior Demographer Jeffrey Passel provided statistical and editorial guidance. Gustavo López and Danielle Cuddington provided research assistance. Gustavo López, Danielle Cuddington and Eileen Patten number-checked the report. Michael Keegan, information graphics designer; and Michael Suh, associate digital producer, provided digital support for the report Molly Rohal and Aleksandra Sandstrom were the copy editors. Find related reports online at pewresearch.org/pewresearch-org/hispanic and pewresearch.org/pewresearch-org/global.

Appendix A: Mexican and Asian Immigrants Compared

Compared with Asian immigrants overall, Mexican immigrants are younger – their median age is 39 years compared with 43 years among Asian immigrants. Mexican immigrants are also more likely to have never been married (26%) than those born in an Asian country (20%).

In terms of fertility, Mexican immigrant women ages 15 to 44 have a higher birth rate (83 births per 1,000 women) than Asian immigrant women (73 births per 1,000). Mexican-born women who gave birth to a child over the past 12 months are also more likely to be unmarried than Asian-born women (35% vs. 10% respectively).

Immigrants from Asia outpace those from Mexico in terms of their educational attainment. Half of Asian immigrants hold a bachelor’s degree or more, compared with only 6% of Mexican immigrants.

Mexican immigrants also fall behind Asian immigrants in economic terms. In 2013, the median annual household income of households headed by a Mexican immigrant was $36,000, which is close to half the median annual household income of households headed by an Asian immigrant ($69,000). Mexican immigrants ages 16 and older reported median annual personal earnings of $20,000, compared with $37,000 among Asian immigrants. In 2013, Mexican immigrants were twice as likely as Asian immigrants to live below the poverty line (26% of Mexican immigrants vs. 13% of Asians).

Mexican immigrants are less likely to be proficient in English than Asian immigrants. In 2013, 31% of those immigrants ages 5 and older born in Mexico were proficient in English, while 54% of comparable Asian immigrants were proficient in English (50% when excluding Indian immigrants).

Due to recent trends in flows of Mexican and Asian immigration, Mexican immigrants are less likely to have arrived in the U.S. in the last 10 years, compared with Asian immigrants (23% vs. 34% respectively).

(See below for detailed demographic tables.)

Demographics of Immigrants in the U.S., 2013
Household Characteristics of Immigrants in the U.S., 2013
Employment Characteristics of Immigrants in the U.S., 2013

Appendix B: Methodology

This appendix describes the specific items used from these various sources and the development of some of the migration measures used in the report. Data from the Mexican Survey of Demographic Dynamics (ENADID), the American Community Survey, the U.S. censuses of 1990 and 2000, and the Current Population Survey are based on Pew Research Center tabulations from public-use microdata sets, some of which have been modified or adjusted to better track changes in the U.S. Census Bureau’s population estimates, which may affect the trends seen in the data, and also to improve the coverage of recent immigrants in some of these instruments. As such, the figures reported may differ from published data from the same sources. The estimates presented in this report of immigrant flows between Mexico and the U.S. were rounded to the nearest 10,000, other figures included in this report were rounded to the nearest 1,000.

Mexican Data Sources

National Survey of Demographic Dynamics (Encuesta Nacional de la Dinámica Demográfica—ENADID): 2014

The National Survey of Demographic Dynamics or ENADID is a national household survey conducted by the Mexican government to collect a wide range of information about population change in Mexico. In addition to a module of questions related to international migration, the survey covers fertility and pregnancy history of women in detail, births and deaths, contraceptive usage and preferences, and marriage. The survey was conducted in 1992, 1997, 2009 and 2014 by Mexico’s National Institute of Statistics and Geography (INEGI) and by the National Population Council (CONAPO) in 2006. This report uses data from the 2014 collection only. Estimates for 2000 and 2010 migration flow from the U.S. to Mexico are based on a prior publication, for further detail on that report’s methodology, please see Passel et al., 2012.

Immigrants to Mexico and Mexicans returning from abroad are identified through a number of different questions. The main questionnaire asks respondents their state or country of birth, which is used to measure lifetime migration (identifying people born outside of Mexico). The main questionnaire also includes two questions on residence five years before the survey (respondents are asked about their place of residence in August 2009 – the state or country of residence and the municipality of residence if respondents were in Mexico). This is asked of people ages 5 or older. These two questions can be used to measure return migration of Mexicans during the five-year period before the survey or immigration to Mexico during the period by people not born in Mexico. The survey also provides data on migration patterns within Mexico. Since the question on residence five years prior pertains only to people ages 5 and older, the number of immigrants that came into Mexico among people younger than 5 years old is determined from the place of birth question, i.e., the number under age 5 born outside of Mexico.

The supplemental migrant questionnaire module is focused on international migration. The first question asks whether anyone who “lives or lived with you (in this house) went to live or work in another country” in the previous five years. People identified as leaving the country with this question are designated as “recent migrants” in this report. The ENADID also asks how many recent migrants left from the household and then follows with a battery of questions about each migrant: gender, age at most recent migration, month and year of most recent departure from Mexico, state of residence at departure, reason for departure, destination country and place of current residence (for example: U.S., other country, Mexico). For those migrants who are identified as currently living in Mexico, there are further questions: month and year of return, reason for return, and whether the returned recent migrant is in the respondent’s household. With these questions, it is possible to identify all people who migrated into Mexico during the previous five years who were still alive at the date of the survey (and were still in Mexico).

Total migration into Mexico from the United States during the five years prior to the 2014 ENADID’s administration is estimated from the main migration questions and the migrant sample of returned recent migrants.

Migrants from the U.S. to Mexico during 2009-2014 can be subdivided as:

  • People (ages 5 and older) living in the U.S. in 2009 and who were back in Mexico in 2014
  • People under age 5 in the survey who were born in the U.S.
  • Recent migrants who left Mexico after 2009 for the U.S. and returned by the survey date (excluding those living in the U.S. in 2009 and children under age 5 born in the U.S.)

Limitations of the ENADID

The ENADID has some limitations when it comes to providing full coverage of migration flows between Mexico and the U.S. All migrants into Mexico in the period before the survey (who are still alive and still in Mexico) can be identified. However, for recent out-migrants, only those migrants from households where some members remained in Mexico can be identified. ENADID is not able to measure outmigration of whole households.

The migrant sample includes only a limited amount of socio-demographic data on the migrants. However, most of the recent migrants who have returned to Mexico (i.e., those who returned to the same household) can be linked to their own record in the household and sociodemographic data. For 2014, we were able to match 90% the returned recent migrants (739 unweighted cases out of 818 returnees in the migrant sample). Because some migrants make multiple trips to the U.S., some of the returned recent migrants (i.e., those who made a trip out of Mexico after August 2009 in 2014) were living in the U.S. five years before the survey. In measuring total migration into Mexico, it is necessary to remove this group from the estimate to avoid double counting. Using the matched samples, 30% of the returned recent migrants in the 2014 ENADID had been in the U.S. five years earlier.

The data from ENADID employed in this report were developed from tabulations of microdata samples. The microdata come from a 93% sample of the full ENADID sample (101,000 households); all cases in the recent migrant sample are included in the microdata. For 2014, microdata samples were downloaded from the INEGI website (entered at http://www.inegi.org.mx/est/contenidos/proyectos/encuestas/hogares/ especiales/enadid/enadid2014/default.aspx). The sample sizes for the microdata are: 94,422 households, 348,450 people living in those households and a sample of 2,289 recent migrants.

United States Data Sources

Current Population Survey (CPS): 2000-2014 March Annual Social and Economic Supplement (ASEC)

The Current Population Survey (CPS) is a national household survey conducted by the U.S. Census Bureau and the U.S. Bureau of Labor Statistics to collect a wide range of information about population in the United States. Each March, the basic CPS sample and questionnaire are expanded for the Annual Social and Economic Supplement (ASEC). The sample is increased to about 80,000 households with a double sample of Hispanic households and oversampling of households with children and households headed by people who are not white. The questionnaire also covers a much broader range of topics with questions about health insurance, detailed sources of income, program participation and residence as of the previous March. This makes the March ASEC supplement the main source of information on poverty and lack of health insurance. The question on residence one year prior to the survey date provides information on current migration into the United States. In this report, the ACS is the principal data source on the size and characteristics of the unauthorized population for the years 2005-2012, while the March CPS is the main source for the years 2000-2004 and 2013-2014 (see below for estimation methodology).

The published information from the CPS and the CPS microdata use survey weights based on the most current information available to the Census Bureau at the time the survey is conducted. Because additional data on population change can become available and because of changes in the methods used to measure population change, the weights for the monthly CPS and the March supplements are not necessarily consistent across time. Consequently, comparisons of population numbers across different releases of the CPS can conflate actual population change with methodological changes. To minimize the impact of methodological change on comparisons across time, the Pew Research Center has developed alternative weights for the March CPS supplements of 1995-2011 that use a consistent set of population estimates and permit more accurate comparisons over time. The March 2000 CPS was reweighted to the 2000 Census; the 2003 to the intercensal estimates; and the 1995 and 1998 to 1990-2000 intercensal estimates. The methodology for developing the alternative weights is described in Appendix C of Passel and Cohn (2014).

American Community Survey (ACS): 2005-2013

The American Community Survey (ACS) is a continuous survey that collects detailed information from a sample of the U.S. population on a wide range of social and demographic topics. Each month the ACS samples about 250,000 households. Interviews are conducted by mail and in person; follow-up is conducted on a sample of initially non-responding households. The nominal sample size is about 3.1 million households per year; about 2.1 million households are included in the final sample. The monthly samples do not overlap within five-year periods so that detailed information can be obtained for various geographic levels by combining samples across months.5

Data from the ACS are released on an annual basis covering interviews conducted during calendar years. The ACS began in 2005 with a sample of the household population and was expanded to full operational status in 2006 when the household and group quarters population were included.

The ACS includes questions on place of birth (state or country), citizenship and residence one year before the interview. For people born outside the U.S., the ACS asks when the person came to live in the United States. These data items provide information on the foreign-born population and movement to the United States. To the extent that ACS data are used in this report, the information comes from tabulations of microdata, released by the Census Bureau but with additional processing by the Integrated Public-Use Microdata Series (IPUMS). For each year, the microdata set represents a 1% sample of the U.S. population or about 3 million individual cases per year.

Each year’s ACS is weighted to the Census Bureau’s population estimates for that year. The 2010 ACS is the first to be weighted to results from the 2010 census. The use of annual population estimates for weighting can create discontinuities in making comparisons across years when the estimation methods change or when the results of a new census are introduced (as in 2010). To help minimize comparison issues related to changes in population estimates, the Pew Research Center has produced alternative ACS weights for 2005-2009 that are consistent with results from the 2010 census and the 2000 census (Passel and Cohn, 2012). These alternative weights are used in ACS results for 2005-2009. Note that estimates of the size of the foreign-born population from the ACS differ from those based on the CPS for a number of reasons. The surveys differ in weighting and coverage; the CPS universe is of the civilian, noninstitutional population while the ACS universe is of the total resident population. Additionally, our estimates from the March CPS and ACS are adjusted for survey undercoverage, and the 2005 ACS is augmented to include the group quarters population.

Decennial Censuses: through 2000

U.S. decennial censuses from 1850 through 2000 have provided information on the foreign-born population via a question on place of birth. Through 1970, these censuses also asked mother’s country of birth and father’s country of birth, which permit identification of the second generation. Data on the Mexican-born population from 1850 through 1990 are from these census results presented by Gibson and Jung (2006).

For 1980 through 2000, we used a 5% public-use sample of census records from IPUMS to generate information on the foreign-born population. These sources also collect information on citizenship and year of entry to the U.S.

Estimation Methods

Two principal sets of estimates presented in this report were generated by the Pew Research Center using U.S. data sources described above and demographic estimation methods—estimates of the size and characteristics of the unauthorized immigrant population in the U.S. and estimates of the five-year inflow of Mexican immigrants into the U.S. for 2009-2014. Previous versions of these estimates and the methods used to derive them have been published elsewhere; see, for example, Passel and Cohn (2014), Passel (2007), Passel, Cohn and Gonzalez-Barrera (2012). This section includes a brief description of the estimation methods used in this report.

Residual Method for Estimating Unauthorized Immigrant Population

The data presented in this report on unauthorized and legal immigrants from Mexico were developed with essentially the same methods used in previous Pew Research Center reports (Passel and Cohn, 2014; Passel and Cohn 2010; Passel and Cohn, 2009). The national and state estimates use a multistage estimation process, principally using March Supplements to the Current Population Survey (CPS) and American Community Surveys (ACS).

The first stage in the estimation process uses CPS and ACS data as a basis for estimating the number of legal and unauthorized immigrants included in the survey and the total number in the country using a residual estimation methodology. This method compares an estimate of the number of immigrants residing legally in the country with the total number in the CPS and ACS; the difference is assumed to be the number of unauthorized immigrants in the CPS and ACS. The legal resident immigrant population is estimated by applying demographic methods to counts of legal admissions covering the period from 1980 to the present obtained from the Department of Homeland Security’s Office of Immigration Statistics and its predecessor at the Immigration and Naturalization Service. The initial estimates here are calculated separately for age-gender groups in six states (California, Texas, Florida, New York, Illinois and New Jersey) and the balance of the country; within these areas the estimates are further subdivided into immigrant populations from 35 countries or groups of countries by period of arrival in the United States. Variants of the residual method have been widely used and are generally accepted as the best current estimates. See also Passel and Cohn (2014, 2011, 2010, 2008) and Passel (2007) for more details.

Then, having estimated the number of legal and unauthorized immigrants in the March CPS Supplements and the American Community Surveys, we assign individual foreign-born respondents in the survey a specific status (one option being unauthorized immigrant) based on the individual’s demographic, social, economic, geographic and family characteristics. The data and methods for the overall process were developed initially at the Urban Institute by Passel and Clark (1998) and were extended by work of Passel, Van Hook and Bean (2004) and by subsequent work at the Pew Research Center.

The final step adjusts the estimates of legal and unauthorized immigrants counted in the survey for omissions. The basic information on coverage is drawn principally from comparisons with Mexican data, U.S. mortality data and specialized surveys conducted at the time of the 2000 census (Bean et al. 1998; Capps et al. 2002; Marcelli and Ong 2002). These adjustments increase the estimate of the legal foreign-born population, generally by 1% to 3%, and the unauthorized immigrant population by 10% to 15%. The individual survey weights are adjusted to account for immigrants missing from the survey.

The estimates for 1995-2012 use specially developed survey weights for the CPS and ACS to ensure consistency across the years in the underlying population figures. (See Passel and Cohn 2010, 2014 for a detailed discussion of the need for these weights and their development.)

Five-Year In-Flows of Immigrants from Mexico

Detailed, accurate estimates of flows back and forth across the U.S.-Mexico border have been difficult to develop, particularly since the flow has been largely unauthorized. Census and survey data from the United States provide measures of the Mexican-born population in the United States and of flows of Mexicans who are living in the U.S. on a more or less permanent basis. The volume of temporary, seasonal or circular migration is harder to assess accurately.

Total immigration during any interval can be estimated from a demographic identity—change in the foreign-born population equals immigration less foreign-born emigration and deaths:

FBt+n – FBt = It,t+n – Dt,t+n – Et,t+n

Or, immigration equals foreign-born population change plus deaths and emigration:

It,t+n = (FBt+n – FBt) + Dt,t+n + Et,t+n

These boundary conditions provide the framework for measuring flows into the U.S. from Mexico. Survey-based estimates of all elements are subject to various measurement issues, including undercount, definitional inconsistencies, sampling and other errors. Developing consistent measures of annual immigration involves coping with these problems.

Estimates were developed for 2009-2014 using a combination of data sources, assumptions and measurement techniques, depending on the nature of the available information.

Estimated Flows, 2009–2014

The total number of arrivals for 2009–2014 is estimated from arrivals for 2012–2014 from the 2014 March CPS plus 2009-2011 arrivals from the 2012 ACS. These estimates were adjusted for undercount of recent immigration and differences in weights before and after the 2010 decennial census.

About the Pew Research Center’s Spring 2015 Global Attitudes Survey in Mexico

Results for the survey are based on face-to-face interviews conducted under the direction of Princeton Survey Research Associates International. The results are based on national samples, unless otherwise noted. More details about our international survey methodology and country-specific sample designs are available on our website.