Modern Immigration Wave Brings 59 Million to U.S., Driving Population Growth and Change Through 2065
Views of Immigration’s Impact on U.S. Society Mixed
About Pew Research Center
Pew Research Center is a nonpartisan, nonadvocacy fact tank that informs the public about the issues, attitudes and trends shaping the world. It does not take policy positions. The Center conducts public opinion polling, demographic research, computational social science research and other data-driven research. It studies politics and policy; news habits and media; the internet and technology; religion; race and ethnicity; international affairs; social, demographic and economic trends; science; research methodology and data science; and immigration and migration. Pew Research Center is a subsidiary of The Pew Charitable Trusts, its primary funder.
Modern Immigration Wave Brings 59 Million to U.S., Driving Population Growth and Change Through 2065
Views of Immigration’s Impact on U.S. Society Mixed
Looking ahead, new Pew Research Center U.S. population projections show that if current demographic trends continue, future immigrants and their descendants will be an even bigger source of population growth. Between 2015 and 2065, they are projected to account for 88% of the U.S. population increase, or 103 million people, as the nation grows to 441 million.
These are some key findings of a new Pew Research analysis of U.S. Census Bureau data and new Pew Research U.S. population projections through 2065, which provide a 100-year look at immigration’s impact on population growth and on racial and ethnic change.
In addition, this report uses newly released Pew Research survey data to examine U.S. public attitudes toward immigration, and it employs census data to analyze changes in the characteristics of recently arrived immigrants and paint a statistical portrait of the historical and 2013 foreign-born populations.
Post-1965 Immigration Drives U.S. Population Growth Through 2065
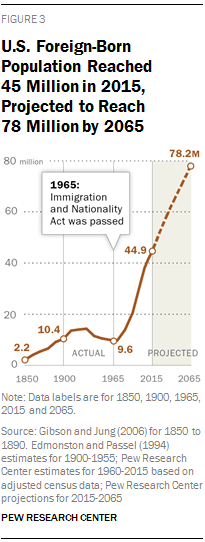
Immigration since 1965 has swelled the nation’s foreign-born population from 9.6 million then to a record 45 million in 2015.1 (The current immigrant population is lower than the 59 million total who arrived since 1965 because of deaths and departures from the U.S.)2 By 2065, the U.S. will have 78 million immigrants, according to the new Pew Research population projections.
The nation’s immigrant population increased sharply from 1970 to 2000, though the rate of growth has slowed since then. Still, the U.S. has—by far—the world’s largest immigrant population, holding about one-in-five of the world’s immigrants (Connor, Cohn and Gonzalez-Barrera, 2013).
Between 1965 and 2015, new immigrants, their children and their grandchildren accounted for 55% of U.S. population growth. They added 72 million people to the nation’s population as it grew from 193 million in 1965 to 324 million in 2015.
This fast-growing immigrant population also has driven the share of the U.S. population that is foreign born from 5% in 1965 to 14% today and will push it to a projected record 18% in 2065. Already, today’s 14% foreign-born share is a near historic record for the U.S., just slightly below the 15% levels seen shortly after the turn of the 20th century. The combined population share of immigrants and their U.S.-born children, 26% today, is projected to rise to 36% in 2065, at least equaling previous peak levels at the turn of the 20th century.
The 1965 Immigration and Nationality Act made significant changes to U.S. immigration policy by sweeping away a long-standing national origins quota system that favored immigrants from Europe and replacing it with one that emphasized family reunification and skilled immigrants. At the time, relatively few anticipated the size or demographic impact of the post-1965 immigration flow (Gjelten, 2015). In absolute numbers, the roughly 59 million immigrants who arrived in the U.S. between 1965 and 2015 exceed those who arrived in the great waves of European-dominated immigration during the 19th and early 20th centuries. Between 1840 and 1889, 14.3 million immigrants came to the U.S., and between 1890 and 1919, an additional 18.2 million arrived (see Table 1 for details).
After the replacement of the nation’s European-focused origin quota system, greater numbers of immigrants from other parts of the world began to come to the U.S. Among immigrants who have arrived since 1965, half (51%) are from Latin America and one-quarter are from Asia. By comparison, both of the U.S. immigration waves in the mid-19th century and early 20th century consisted almost entirely of European immigrants.
Latin American and Asian Immigration Since 1965 Changes U.S. Racial and Ethnic Makeup
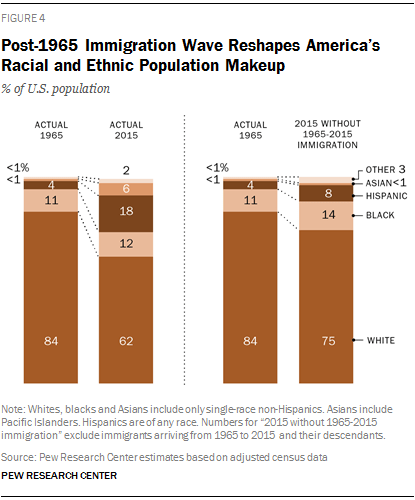
As a result of its changed makeup and rapid growth, new immigration since 1965 has altered the nation’s racial and ethnic composition. In 1965, 84% of Americans were non-Hispanic whites. By 2015, that share had declined to 62%. Meanwhile, the Hispanic share of the U.S. population rose from 4% in 1965 to 18% in 2015. Asians also saw their share rise, from less than 1% in 1965 to 6% in 2015.
The Pew Research analysis shows that without any post-1965 immigration, the nation’s racial and ethnic composition would be very different today: 75% white, 14% black, 8% Hispanic and less than 1% Asian.
The arrival of so many immigrants slightly reduced the nation’s median age, the age at which half the population is older and half is younger. The U.S. population’s median age in 1965 was 28 years, rising to 38 years in 2015 and a projected 42 years in 2065. Without immigration since 1965, the nation’s median age would have been slightly older—41 years in 2015; without immigration from 2015 to 2065, it would be a projected 45 years.
By 2065, the composition of the nation’s immigrant population will change again, according to Pew Research projections. In 2015, 47% of immigrants residing in the U.S. are Hispanic, but as immigration from Latin America, especially Mexico (Passel, Cohn and Gonzalez-Barrera, 2012), has slowed in recent years, the share of the foreign born who are Hispanic is expected to fall to 31% by 2065. Meanwhile, Asian immigrants are projected to make up a larger share of all immigrants, becoming the largest immigrant group by 2055 and making up 38% of the foreign-born population by 2065. (Hispanics will remain a larger share of the nation’s overall population.) Pew Research projections also show that black immigrants and white immigrants together will become a slightly larger share of the nation’s immigrants by 2065 than in 2015 (29% vs. 26%).
The country’s overall population will feel the impact of these shifts. Non-Hispanic whites are projected to become less than half of the U.S. population by 2055 and 46% by 2065. No racial or ethnic group will constitute a majority of the U.S. population. Meanwhile, Hispanics will see their population share rise to 24% by 2065 from 18% today, while Asians will see their share rise to 14% by 2065 from 6% today.
From Ireland to Germany to Italy to Mexico: Where Each State’s Largest Immigrant Group Was Born, 1850 to 2013
The United States has long been—and continues to be—a key destination for the world’s immigrants. Over the decades, immigrants from different parts of the world arrived in the U.S. and settled in different states and cities. This led to the rise of immigrant communities in many parts of the U.S.
The nation’s first great influx of immigrants came from Northern and Western Europe. In 1850, the Irish were the largest immigrant group nationally and in most East Coast and Southern states. By the 1880s, Germans were the nation’s largest immigrant group in many Midwestern and Southern states. At the same time, changes to U.S. immigration policy had a great impact on the source countries of immigrants. In 1880, Chinese immigrants were the largest foreign-born group in California, Oregon, Washington, Idaho and Nevada. But with the Chinese Exclusion Act of 1882, Chinese immigrants were prevented from entering the U.S. As a result, other immigrant groups rose to become the largest in those states.
By the early 20th century, a new wave of immigration was underway, with a majority coming from Southern Europe and Eastern Europe. By the 1930s, Italians were the largest immigrant group in the nation and in nine states, including New York, Louisiana, New Jersey and Nevada.
The composition of immigrants changed again in the post-1965 immigration era. By the 1980s, Mexicans became the nation’s largest immigrant group; by 2013, they were the largest immigrant group in 33 states. But other immigrant groups are represented as well. Chinese immigrants are the largest immigrant group in Massachusetts and Pennsylvania. Indians are the largest immigrant group in New Jersey. Filipinos are the largest immigrant group in Alaska and Hawaii.
For the U.S. Public, Views of Immigrants and Their Impact on U.S. Society Are Mixed
For its part, the American public has mixed views on the impact immigrants have had on American society, according to a newly released Pew Research Center public opinion survey. Overall, 45% of Americans say immigrants in the U.S. are making American society better in the long run, while 37% say they are making it worse (16% say immigrants are not having much effect). The same survey finds that half of Americans want to see immigration to the U.S. reduced (49%), and eight-in-ten (82%) say the U.S. immigration system either needs major changes or it needs to be completely rebuilt.
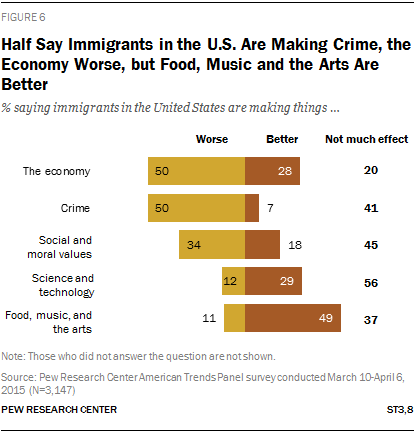
The public’s views of immigrants’ impact on the U.S. vary across different aspects of American life. Views are most negative about the economy and crime: Half of U.S. adults say immigrants are making things worse in those areas. On the economy, 28% say immigrants are making things better, while 20% say they are not having much of an effect. On crime, by contrast, just 7% say immigrants are making things better, while 41% generally see no positive or negative impact of immigrants in the U.S. on crime.
On other aspects of U.S. life, Americans are more likely to hold neutral views of the impact of immigrants. Some 45% say immigrants are not having much effect on social and moral values, and 56% say they are not having much effect on science and technology. But when it comes to food, music and the arts, about half (49%) of adults say immigrants are making things better.
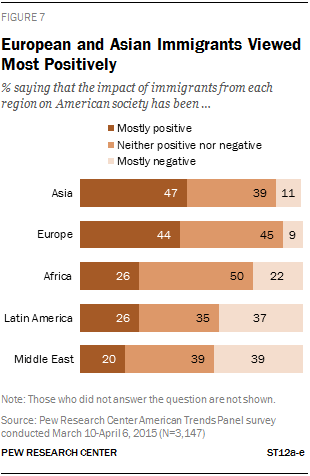
U.S. adults’ views on the impact of immigrants on American society also differ depending on where immigrants are from. Some 47% of U.S. adults say immigrants from Asia have had a mostly positive impact on American society, and 44% say the same about immigrants from Europe. Meanwhile, half of Americans say the impact of immigrants from Africa has been neither positive nor negative.
However, Americans are more likely to hold negative views about the impact of immigrants from Latin America and the Middle East. In the case of Latin American immigrants, 37% of American adults say their impact on American society has been mostly negative, 35% say their impact is neither positive nor negative, and just 26% say their impact on American society has been positive. For immigrants from the Middle East, views are similar—39% of U.S. adults say their impact on American society has been mostly negative, 39% say their impact has been neither positive nor negative, and just 20% say their impact has been mostly positive on U.S. society.
Many Americans say that immigrants to the U.S. are not assimilating. Two-thirds of adults say immigrants in the U.S. today generally want to hold on to their home country customs and way of life, while only about a third (32%) say immigrants want to adopt Americans customs. The survey also finds that 59% of Americans say most recent immigrants do not learn English within a reasonable amount of time, while 39% say they do.
The nationally representative bilingual survey of 3,147 adults was conducted online using the Pew Research Center’s American Trends Panel from March 10 to April 6, 2015, before the current national discussion began about national immigration policy, unauthorized immigration and birthright citizenship. The survey has a margin of error of plus or minus 2.4 percentage points at the 95% confidence level.
The Profile of Today’s Newly Arrived Is Markedly Different than that of New Arrivals in Previous Decades
The rewrite of the nation’s immigration policy in 1965 opened the door to new waves of immigrants whose origins and characteristics changed substantially over the ensuing decades. As a result, newly arrived immigrants in 2013 (those who had been in the U.S. for five years or less) differ in key ways from those who were new arrivals in the 1970s, 1980s and 1990s.
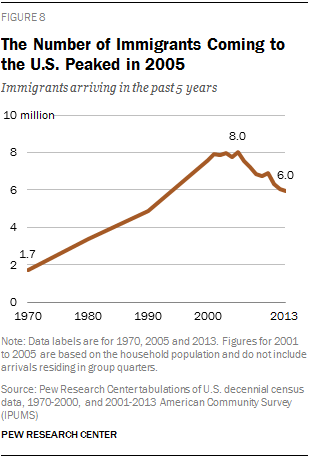
Overall, the number of newly arrived immigrants peaked in the early 2000s: Some 8 million residents of other countries came to the U.S. between 2000 and 2005. The number of recent arrivals declined after that, to about 6 million for the years 2008 to 2013, according to a Pew Research Center analysis of federal government data.
Perhaps the most striking change in the profile of newly arrived immigrants is their source region. Asia currently is the largest source region among recently arrived immigrants and has been since 2011.3 Before then, the largest source region since 1990 had been Central and South America, fueled by record levels of Mexican migration that have since slowed. Back in 1970, Europe was the largest region of origin among newly arrived immigrants. One result of slower Mexican immigration is that the share of new arrivals who are Hispanic is at its lowest level in 50 years.
Compared with their counterparts in 1970, newly arrived immigrants in 2013 were better educated but also more likely to be poor. Some 41% of newly arrived immigrants in 2013 had at least a bachelor’s degree. In 1970, that share was just 20%. On poverty, 28% of recent arrivals in 2013 lived in poverty, up from 18% in 1970. In addition, fewer of the newly arrived in 2013 were children than among the newly arrived immigrants in 1970—19% vs. 27%.
Unauthorized Immigration
This report’s estimates and projections of foreign-born residents in the U.S. comprise both legal and unauthorized immigrants. However, the numbers for each status group are not broken out separately except where stated.
In 2014, 11.3 million unauthorized immigrants lived in the U.S., according to the latest preliminary Pew Research estimate (Passel and Cohn, 2015). That estimate is essentially unchanged since 2009, as the number of new U.S. unauthorized immigrants roughly equals the number who voluntarily leave the country, are deported, convert to legal status or (less commonly) die.
According to Pew Research estimates going back to 1990, this population rose rapidly during the 1990s and peaked in 2007. The number of unauthorized immigrants declined during the recession of 2007-2009 before stabilizing. Illegal immigration from Mexico has been the main factor in these changes in the U.S. unauthorized immigrant population, though Mexicans remain by far the largest unauthorized immigrant group.
For more Pew Research analysis of unauthorized immigration, see here.
Roadmap to the Report
The report is organized as follows: Chapter 1 provides an overview of the nation’s immigration legislation, with a focus on key changes since 1965. It is accompanied by an interactive timeline highlighting U.S. immigration legislation since 1790. Chapter 2 explores the impact of post-1965 immigration on the nation’s demographics up to 2015 and provides a look forward at the future impact of immigration with new Pew Research population projections through 2065. Chapter 3 looks at the post-1965 flow of immigrants through the lens of the recently arrived, exploring changes in the group’s origins and other characteristics. Chapter 4 explores the U.S. public’s views of immigration and immigration policy. Chapter 5 provides a statistical portrait of the nation’s immigrants from 1960 to 2013 and is accompanied by an online interactive statistical portrait of the foreign born and an online interactive exploring the top country of origin among immigrants in each state from 1850 to 2013. Appendix A explains the report’s methodology, including for the population projections. Appendix B contains a U.S. immigration law timeline. Appendix C includes 1965 to 2065 population tables, and Appendix D contains the survey topline.
A Note on Terminology
“Foreign born” refers to persons born outside of the United States, Puerto Rico or other U.S. territories to parents neither of whom was a U.S. citizen. The terms “foreign born” and “immigrant” are used interchangeably in this report. Unless otherwise noted, recent arrivals include all the newly arrived regardless of their legal status, that is, both legal immigrants and unauthorized immigrants. However, in Pew Research Center survey data, “immigrant” is defined as someone born in another country, regardless of parental citizenship.
“Recent arrivals” or “newly arrived immigrants” refer to foreign-born persons who arrived within five years of the census enumeration or date of the survey. Unless otherwise noted, recent arrivals include all the newly arrived regardless of their legal status, that is, both legal and unauthorized immigrants.
“Legal immigrants” are those who have been granted legal permanent residence; those granted asylum; people admitted as refugees; and people admitted to the U.S. under a set of specific authorized temporary statuses for longer-term residence and work. This group includes “naturalized citizens,” legal immigrants who have become U.S. citizens through naturalization; “legal permanent resident aliens,” who have been granted permission to stay indefinitely in the U.S. as permanent residents, asylees or refugees; and “legal temporary migrants” (including students, diplomats and “high-tech guest workers”), who are allowed to live and, in some cases, work in the U.S. for specific periods of time (usually longer than one year).
“Unauthorized immigrants” are all foreign-born non-citizens residing in the country who are not legal immigrants. This definition reflects standard and customary usage by the U.S. Department of Homeland Security and academic researchers.
Immigrant generations living in the U.S. are as follows: “First generation” refers to the foreign born (see above for definition). “Second generation” refers to people born in the U.S. who have at least one immigrant parent. “Third-and-higher generation” refers to people born in the U.S. with U.S.-born parents.
“U.S. born” refers to individuals who are U.S. citizens at birth, including people born in the United States, Puerto Rico or other U.S. territories, as well as those born elsewhere to parents who were U.S. citizens. The U.S.-born population encompasses the second generation and the third-and-higher generation.
References to all racial groups, including “Other,” refer to only non-Hispanics. References to specific racial groups, such as Asians, blacks and whites, include only single-race individuals. Asians do not include Pacific Islanders, unless otherwise noted. Hispanics are of any race.
“College completion” refers to those who have completed at least a bachelor’s degree. Prior to 1990 it refers to those who have completed at least four years of college.
Persons finishing “some college” have finished at least some college education, including those completing associate degrees. Those completing any college at all, including less than one year, are designated as finishing some college.
A “high school completer” refers to those who have at least obtained a high school diploma or its equivalent (such as a General Educational Development certificate, or GED). Prior to 1990 it refers to those who have completed at least four years of high school.
Throughout this report, the term “Latin America” refers to Central and South America, as well as the Caribbean and Mexico; references to “Central and South America” in Chapter 3 do not include the Caribbean, but do include Mexico, unless otherwise noted. In referring to countries of origin, “South and East Asia” refers to only those regions, while “Asia” refers to the full continent (see Recent Arrivals: Data Sources in Appendix A).
Chapter 1: The Nation’s Immigration Laws, 1920 to Today
Fifty years ago, the U.S. enacted a sweeping immigration law, the Immigration and Nationality Act, which replaced longstanding national origin quotas that favored Northern Europe with a new system allocating more visas to people from other countries around the world and giving increased priority to close relatives of U.S. residents.
Just prior to passage of the 1965 law, residents of only three countries—Ireland, Germany and the United Kingdom—were entitled to nearly 70% of the quota visas available to enter the U.S. (U.S. Department of Justice, 1965).4 Today, immigration to the U.S. is dominated by people born in Asia and Latin America, with immigrants from all of Europe accounting for only 10% of recent arrivals.
The 1965 law undid national origin quotas enacted in the 1920s, which were written into laws that imposed the first numerical limits on immigration. Those laws were the culmination of steadily tightening federal restrictions on immigration that began in the late 1800s with prohibitions or restrictions on certain types of immigrants, such as convicts, in addition to a ban on Chinese migrants and later virtually all Asian migrants.
This chapter explores the history of immigration law in the U.S., focusing on provisions of major legislation from the 20th century onward. Accompanying this chapter is an interactive timeline (below) of U.S. immigration legislation since the 1790s.
New Restrictions in the 1920s
The visa arrangement in place when the 1965 law was passed was a legacy from half a century earlier. At that earlier time, a giant wave of immigration that began in the late 1800s had raised the nation’s population of foreign-born residents to a then-record high of 13.9 million in 1920, making up a near-record 13% of the U.S. population (Gibson and Jung, 2006; Passel and Cohn, 2008).5 The first arrivals in this wave were mainly Northern Europeans, but by the early 1900s most new arrivals came from Italy, Poland and elsewhere in Southern and Eastern Europe (Martin, 2011).
Reacting to the change in immigrant origins, laws enacted in the 1920s sought to return U.S. immigration patterns to those that prevailed decades earlier, when Northern Europeans were the largest group of immigrants. A 1921 law imposed the first overall numerical quota on immigration to the U.S.—about 350,000, reduced to 165,000 in 1924 (Martin, 2011). The 1924 law set annual quotas for each European country based on the foreign-born population from that nation living in the U.S. in 1890.6 The 1921 and 1924 laws exempted from the new quota highly skilled immigrants, domestic servants, specialized workers such as actors and wives or unmarried minor children of U.S. citizens, and the 1924 law also created preferences for quota visas for certain family members and agricultural workers (Martin, 2011).
Nationality quotas were imposed only on Europe, not on countries in the Western Hemisphere. There were no quotas for Asia, because immigration from most countries there already was prohibited through other restrictions imposed in 1875 and expanded in later decades.
These laws were passed against a backdrop of growing federal regulation of immigration, which was mainly controlled by states until a series of Supreme Court rulings in the late 1800s declared that it was a federal responsibility. Aside from country limits, federal laws already in place barred immigration by criminals, those deemed “lunatics” or “idiots,” and people unable to support themselves, among others (U.S. Department of Homeland Security). These laws also required that immigrants older than 16 prove they could read English or some other language. The federal immigration bureaucracy, created in 1891, grew in the 1920s with creation of the Border Patrol and an appeals board for people excluded from the country (U.S. Department of Homeland Security).
Immigration slowed sharply after the 1920s. But there were some exceptions to U.S. immigration restrictions. For example, because of labor shortages during World War II, the U.S. and Mexico signed an agreement in 1942 creating the Bracero program to allow Mexican agricultural workers to enter the U.S. temporarily. The program lasted until 1964.
Longstanding bans on immigration from Asia were lifted in the 1940s and 1950s. A prohibition on Chinese immigration enacted in 1882 was repealed in 1943. The 1952 Immigration and Nationality Act included the first quotas, though small, allowing immigrants from Asian nations, and created a preference system among quota visas that included highly skilled workers for the first time.
President Harry S. Truman, who opposed national origin quotas, appointed a commission to review the nation’s immigration policy after Congress passed the 1952 law over his veto. The commission’s report criticized the national origin quotas for perpetuating racial and national discrimination. The commission recommended that national origin quotas be replaced by higher limits with priority status based on granting asylum, reunifying families and meeting the nation’s labor needs (President’s Commission on Immigration and Naturalization, 1953). Congress did not act on those recommendations, but in 1953 it did approve a commission proposal for separate quotas for refugees (Martin, 2011).
The 1965 Law Brings Major Change
It was not until 1965, when amendments were passed to the Immigration and Naturalization Act, that the old national origins system was abolished.
Instead, the new law emphasized visas for family and employment categories, but exempted spouses, parents and minor children of U.S. citizens from those visa limits. That exemption, and other priority given to family members of U.S. residents, meant that about three-quarters of visas were set aside for relatives of those already in the U.S.—putting the emphasis in U.S. immigration policy on family reunification.
Most remaining visas were for employment purposes, given to people with certain job skills and their family members. The Labor Department was required to certify that an American worker was not available to fill the job of the visa seeker and that U.S. workers would not be harmed if the visa were issued (Martin, 2011).
The 1965 law also included a quota for refugees, who were granted 6% of annual visas, compared with 74% for families; 10% for professionals, scientists and artists; and 10% for workers in short supply in the country (Kritz and Gurak, 2005). Later, the Refugee Act of 1980 separated refugee admissions from the overall quota system, expanded the definition of a refugee and set up comprehensive procedures for handling refugees.
Although the 1920s-era national origins quotas were abolished, the new 1965 law did include total hemisphere and country quotas. Though the hemisphere quotas were dropped in the following decade (Martin, 2011). Importantly, the law imposed the first limits on immigration from Western Hemisphere countries, including Mexico. Those limits, combined with the end of the Bracero program in 1964, are associated with a rise in unauthorized immigration, mostly from Mexico.7
Scholars attribute passage of the 1965 law in part to the era’s civil rights movement, which created a climate for changing laws that allowed racial or ethnic discrimination, as well as to the growing clout of groups whose immigration had been restricted (Martin, 2011). The economy was healthy, allaying concerns that immigrants would compete with U.S.-born workers (Reimers, 1992). Some, however, say that geopolitical factors were more important, especially the image of the U.S. abroad in an era of Cold War competition with Russia (FitzGerald and Cook-Martin, 2015). Labor unions, which had opposed higher immigration levels in the past, supported the 1965 law, though they pushed for changes to tighten employment visas. And political players changed: President Lyndon B. Johnson lobbied hard for the bill, and a new generation of congressional leaders created a friendlier environment for it (Martin, 2011).
Its sponsors praised the law for its fairness but downplayed its potential impact on immigration flows. “This bill that we will sign today is not a revolutionary bill. It does not affect the lives of millions,” Johnson said in remarks at the signing ceremony. “It will not reshape the structure of our daily lives, or really add importantly to either our wealth or our power.”
Laws Since 1965
In the 1970s and early 1980s, new laws mainly focused on the growing flow of refugees from Southeast Asia. Since then, concerns about unauthorized immigration have guided the nation’s immigration policy agenda. In 1986, Congress addressed the growing issue of unauthorized immigration with the Immigration Reform and Control Act, which offered temporary protection from deportation and legal permanent resident status to millions of people who had lived in the country since the 1980s. Roughly 2.7 million people were given legal status under the law’s general legalization or its special program for farmworkers.
The Immigration Act of 1990 increased the number of visas for legal immigrants coming for family and employment reasons and created a new category of visas for “diversity immigrants.” Among other provisions, it also created a new type of relief from deportation for nationals of countries undergoing armed conflicts, environmental or health disasters, or other “extraordinary and temporary conditions,” known as “temporary protected status,” which has been used mainly by Central American immigrants.
The primary emphasis of more recent immigration legislation has been to reduce government benefits to immigrants, increase border security and provide broader reasoning for excluding immigrants on terrorism grounds (Migration Policy Institute, 2013).
Notable exceptions to that pattern were President Barack Obama’s two recent executive actions on unauthorized immigration—Deferred Action for Childhood Arrivals (DACA) in 2012 and Deferred Action for Parents of Americans and Lawful Permanent Residents (DAPA) in 2014. DACA allowed young adults, ages 15 to 30, who had been brought illegally to the U.S. as children to apply for deportation relief and a temporary work permit. In 2014, the president eliminated the age limits for DACA eligibility. Under DAPA, some unauthorized immigrants with U.S.-born children were allowed to apply for deportation relief and a work permit. The 2014 actions are on hold because of a legal challenge filed by 26 states (Lopez and Krogstad, 2015).
Chapter 2: Immigration’s Impact on Past and Future U.S. Population Change
Foreign-born Americans and their descendants have been the main driver of U.S. population growth, as well as of national racial and ethnic change, since passage of the 1965 law that rewrote national immigration policy. They also will be the central force in U.S. population growth and change over the next 50 years.
According to new Pew Research Center projections, immigrants will make up a record 18% of the U.S. population in 2065, compared with 14% today and 5% in 1965. Immigrants and their children will represent 36% of the U.S. population in 2065, which equals or surpasses the peak levels last seen around the turn of the 20th century. That share will represent a doubling since 1965 (18%) and a notable rise from today’s 26%.
The arrival of new immigrants and the births of their children and grandchildren account for 55% of the U.S. population increase from 193 million in 1965 to 324 million today. The new Pew Research Center projections also show that the nation is projected to grow to 441 million in 2065 and that 88% of the increase is linked to future immigrants and their descendants.
Immigration has had only a modest impact on the nation’s age structure, but a striking one on its racial and ethnic makeup.8 Without immigration since 1965, the U.S. today would have a median age of 41, not 38. The nation would be 75% white instead of 62%. Hispanics would be 8% of the population, not 18%. And Asians would be less than 1% of Americans, instead of 6%.
Immigration’s Contribution to U.S. Population Size and Growth
The nation’s population grew by 131 million people from 1965 to 2015, and 72 million of them are linked to immigration—that is, they are immigrants who arrived during this period or they are their children or grandchildren.
If no immigrants had entered the country after 1965, when the U.S. population numbered 193 million, the nation’s population still would have grown—to 252 million people by 2015, rather than 324 million. The population would have grown by less than half as much as it actually did (30% vs. 67% growth).
Over the next five decades, the U.S. immigrant population of 45 million is projected to grow to a record 78 million.9 The growth rate of 74% will be more than double that for the U.S.-born population (30%).
Foreign-born U.S. residents will make up 18% of the population by 2065, higher than the previous record share of nearly 15% during the late 19th- and early 20th-century wave of immigration. The U.S.-born children of immigrants—the second generation—will more than double in number by 2065, from 38 million to 81 million, and will become 18% of the total population.
Since 1965, when the U.S. had 9.6 million immigrants, the total foreign-born population has more than quadrupled. The growth rate rose for each 10-year period from 1965 to 1995, peaking at 56% growth from 1985 to 1995. The volume of immigration grew from 1995 to 2005, though the growth rate of the foreign born decreased slightly (49%). From 2005 to 2015, the growth rate of the foreign born declined substantially, to 17%, largely because of a sharp drop in unauthorized immigration, especially from Mexico (Passel, Cohn and Gonzalez-Barrera, 2012).
Projection Methods
The new Pew Research projections are calculated based on immigration rates, birth rates and death rates that are derived from past trends and assumptions about future patterns. Among the assumptions are that the current slowdown in immigration will last through the decade, but that growth will pick up somewhat after that. Fertility rates are not projected to rise, but rates will vary by group. Lifespans are projected to improve modestly.
These projections employ today’s racial categories. It should be noted that race and ethnicity are fluid concepts that can change through social consensus, personal self-identification or other means (Liebler et al., 2014; Pew Research Center, 2015b; Wang, 2015). For more details on assumptions and racial categories, see Appendix A: Methodology.
The immigrant population is expected to rise within a range of about 9% to 16% each decade from 2015 to 2065. By comparison, the overall U.S. population is projected to grow by 5% to 8% each decade.
Immigrants contribute to population growth because of both their own numbers and their above-average fertility. Most of those who immigrate are working-age adults, so immigrants are more likely than U.S.-born residents to be in their child-bearing years. They also have higher age-adjusted birth rates than people born in the U.S. (Livingston and Cohn, 2012).
Immigrant Generations
Immigrants made up only 5% of the U.S. population in 1965, compared with 14% today. The second generation, the children of immigrants, represent about the same share of the population today (12%) as in 1965 (13%). However, as shown below, today’s children of immigrants are considerably younger than their counterparts in 1965, and they are less likely to be white.
The second generation, today representing 38 million children of immigrants, is projected to be a major force driving future population growth. The foreign-born population has grown more rapidly than the second generation over the past five decades, but the second generation is projected to grow at a faster pace over the next five decades. The number of second-generation Americans is projected to more than double by 2065, to 81 million, when they will slightly outnumber the 78 million foreign-born Americans.
The third-and-higher generations—those born in the U.S. to U.S.-born parents—will grow more slowly, by 17% over the next five decades. This group now makes up about three-quarters (74%) of the U.S. population, but it will decline to about two-thirds (64%) in 2065.
Past Racial and Hispanic Change
Immigration is the primary reason behind the striking growth in the nation’s Hispanic and Asian populations since passage of the 1965 immigration law that ended a visa system favoring Europe over other regions of the world. Immigrants and their descendants account for most growth in the Hispanic population (76%) and virtually all growth in the Asian population (98%) from 1965 to 2015.
Five decades ago, the U.S. was a mainly (84%) white nation with an 11% black minority. Hispanics of all races made up 4% of the population, and other races made up the remaining 1%. All these groups grew in the ensuing 50 years, especially Hispanics, whose numbers grew sevenfold, and Asians, whose numbers rose more than thirteenfold.
The Hispanic share of the population more than quadrupled from 1965 to 2015, to 18%, and the Asian share more than quintupled, to 6%. The white share declined (to 62% in 2015), and the black share changed little (to 12% in 2015).
The Hispanic population, 8 million in 1965, is nearly 57 million in 2015. The Asian population, 1.3 million in 1965, grew to 18 million in 2015.
The white and black populations did not grow as sharply, and less than a third of growth for each race (29%) can be linked to immigration. The 1965 white population of nearly 162 million grew to 200 million in 2015. The black population, 21 million in 1965, increased to 40 million in 2015.
Looking at immigrants’ total contribution to population growth, by racial and ethnic group, Hispanics and their descendants can be linked to 28% of the overall U.S. increase over the past five decades. Asian immigrants and their descendants contributed 13% of growth. White immigrants and their descendants accounted for 8%, and black immigrants and their descendants are linked to 4% of overall growth over the past five decades. An additional 45% of growth was not linked to immigration, but to births to people living in the U.S. in 1965 and their descendants.
Projected Future Racial and Hispanic Change
Over the next five decades, the majority of U.S. population growth is projected to be linked to new Asian immigration (35%) and new Hispanic immigration (25%). An additional 18% will be due to new white immigrants and their descendants, and 8% to black immigrants and their descendants.10 Only about 12% of projected growth is attributable to the population already in the country in 2015 and its descendants.
Differing growth rates of the nation’s racial and ethnic groups will reshape the U.S. demographic profile. By 2055, the United States will be a nation without a majority racial or ethnic group. The Hispanic and Asian populations will continue to grow more rapidly than whites and blacks. The white population, now 62% of the total, will decline to less than 50% sometime between 2050 and 2055.
In 2065, according to Pew Research projections, whites will make up 46% of the population and Hispanics 24%. Asians will be 14% of the total; after 2060, they are projected to surpass blacks, who will be 13% of the U.S. population.
Nearly all (97%) of the growth in the nation’s Asian population over the next five decades will be due to new immigrants, their children and grandchildren. Most growth will be due to immigration for Hispanics (57%) and blacks (61%). The white population, projected to rise by 1% from 2015 to 2065, would decline by 9% without new immigrants and their descendants.
Race and Ethnicity Among Immigrants
Among immigrants, the white share of the foreign-born population will remain at a historic low over the next five decades. Based on Pew Research Center assumptions about immigration, fertility and mortality rates, Asians are projected to surpass Hispanics as the largest single group among the foreign-born population, beginning in 2055.
In 1965, most immigrants (80%) were white, but immigration over the subsequent five decades was dominated by Hispanics and Asians. In 2015, only 18% of immigrant population was white; in 2065, 20% are projected to be white. The Hispanic share of immigrants, now 47%, will decline to 31% as a growing share of Hispanic growth is fed by births in the U.S. and not new immigration. Asians, who surpassed Hispanics among new immigrants by 2011, are projected to rise to 38% of the immigrant population in 2065 from today’s 26%.11
Asians will be a growing share of the second generation (26% in 2065), but Hispanics will remain the largest single group in the second generation (40%). In 2065, Hispanics will nearly triple their representation in the third-and-higher generation (18% from today’s 8%), but Asians will remain a small share (3%) of this group.
The combined share of immigrants and children of immigrants—sometimes called “immigrant stock”—varies widely among the nation’s major race and ethnic groups. The white and black shares are expected to rise over the next five decades, while the Hispanic and Asian shares will decline somewhat.
In 1965, nearly one-in-five whites (18%) were immigrants or the children of immigrants, which declined to 10% in 2015 but will rebound to 16% in 2065. Among blacks, only 1% were immigrants or the children of immigrants in 1965, which rose to 15% in 2015 and will go up to 27% in 2065. Among Hispanics, 38% were first or second generation in 1965, compared with 68% today and just over half (53%) in 2065, according to projections. Among Asians, 69% were first or second generation in 1965, 93% are today and 84% are projected to be in 2065.
Today, Asians are the only major racial or ethnic group whose numbers are rising mainly because of immigration. Although immigration contributes to growth of the U.S. Hispanic population, births in the U.S. to Hispanic women are a more important contributor. Births overtook immigration as the main driver of Latino population growth after 2000 (Krogstad and Lopez, 2014).
Nearly two-thirds of the Asian population (64%) is foreign born, compared with 37% of U.S. Hispanics. About a quarter (23%) of the Hispanic population will be foreign born in 2065, and barely half (49%) of the Asian population will be immigrants.
Due to a gradual increase in black immigration, 13% of blacks will be foreign born, compared with 9% today. The white population will have only an 8% share of immigrants, compared with 4% today.
Median Age
In 1965, immigration rates had been low for several decades, so both immigrants and their U.S.-born children were considerably older than the U.S. population overall. The contrast is striking in terms of median age—the age at which half the population is older and half younger. For the U.S. population overall, in 1965, the year after the end of the post-World War II baby boom, the median age was 28.
The median age for immigrants was 56. The median age for the second generation, whose parents mainly came during the early 20th-century wave of immigration, was 45.
By 2015, the U.S. population was older, with a median age of 38, mainly because of the aging of the large Baby Boom generation. Had there been no immigration after 1965, the population would have been slightly older, with a median age of nearly 41. Today’s immigrant population is substantially younger than in 1965, with a median age of nearly 45.
The most striking change, though, is in the second generation. The children of immigrants today have a median age of 19, so they are about a quarter century younger than their counterparts in 1965 and are substantially younger than the overall population.
The U.S. median age is projected to rise steadily, reaching 42 in 2065. The median age of foreign-born Americans is projected to reach nearly 53, close to its level in 1965. The median age of the second generation will increase even more sharply, to 36, though this group is projected to remain slightly younger than the overall population. Over the next five decades, projected immigration would have the impact of keeping the median age of the overall population slightly lower than it would be otherwise, by 2.7 years.
Chapter 3: The Changing Characteristics of Recent Immigrant Arrivals Since 1970
Today’s recently arrived immigrants are sharply different from their counterparts of 50 years ago, not only in their origins and current states of residence, but also in their education levels, occupations and economic well-being, according to a Pew Research Center analysis of U.S. Census Bureau data. Most visibly, Asia is now the largest region of origin among recently arrived immigrants—those who have been in the U.S. for five years or less—supplanting Central and South America in 2011.12
Newly arrived immigrants today also are markedly better educated than their counterparts of 50 years ago, and have narrowed their schooling gap with the U.S.-born population. About half work in managerial, professional, and sales and administrative support jobs, a higher share than in any decade from 1970 on. However, they also are more likely to be living in poverty than in 1970, and their family incomes are no higher.
The broad rewrite of the nation’s immigration law in 1965, which ended a longstanding national origins quota system that favored Europe, was an important facilitator of these changes. Its passage is linked to the third great wave of immigration to the United States—a wave that continues today. Since 1965, nearly 59 million immigrants have come to the U.S.
But more changes are underway. After increasing steadily for three decades, the number of new immigrant arrivals appears to have peaked around 2005 and then began to fall.
The decline is mainly the result of an abrupt slowdown over the past decade in unauthorized immigration, mainly from Mexico. Hispanic immigration to the U.S.—both legal and illegal—crested in the early 2000s, and the share of new arrivals who are Hispanic is at its lowest level in 50 years.
From Europe to the Americas to Asia: The Changing Origins of Newly Arrived Immigrants
Since passage of the 1965 immigration law, the dominant region of origin of new immigrants has shifted three times. In earlier waves of immigration, most arrivals came from Europe, and this trend continued even into 1970, when a plurality of recently arrived immigrants was from there (30%). Meanwhile, roughly equal shares of recent immigrants were from Central and South America (20%), Asia (19%) and the Caribbean (18%), regions that had long had little representation among newly arrived immigrants.13
By 1980, patterns shifted as growth in immigration from Asia and from Mexico increased. As a result, new immigrants from Asia (36%) and Central and South America, including Mexico, (31%) outnumbered the share arriving from Europe (14%).
Immigration from Central and South America grew rapidly through the 1980s, increasing the share of newly arrived immigrants in 1990 from these countries to 41%, making the region the top sender of immigrants to the U.S. Throughout the 1990s, immigration from the region—especially from Mexico—continued to grow. As a result, by 2000, Mexico alone accounted for a third (34%) of recent immigrants, up from just 11% in 1970. And the total from Central and South America reached 48%.
More recently, there has been another change. An abrupt slowdown in new immigration from Mexico, especially of unauthorized immigrants (Passel, Cohn and Gonzalez-Barrera, 2013), reduced the Mexican share of new arrivals to only 15% by 2013. Altogether, new immigrants from Central and South America represented just 28% of the total in 2013.
At the same time, immigration from Asia increased. The number of new arrivals from Asia, fueled in part by the greater propensity of Asian immigrants to obtain green cards based on employer sponsorship, grew 30% between 2000 and 2013 (Pew Research Center, 2012). By 2011, new arrivals from Asia were the single largest origin group among new immigrants. By 2013, their share had grown to 41% of new arrivals, the highest share from that continent in U.S. history.
Europe accounted for only one-in-ten new immigrants to the U.S. in 2013, even though it had been the main source of the U.S. foreign-born population for most of the nation’s history. In 1910, for example, 89% of recently arrived immigrants came from Europe.
Immigration from Africa also has picked up markedly (Anderson, 2015) and accounted for 8% of new arrivals in 2013, quadruple its share among newly arrived immigrants in 1970.
The Number of New Arrivals
Even though Europe’s share of new arrivals has declined since the 1970s, the absolute number of new immigrants from Europe grew, then receded. In 2013, the number of new European arrivals stood at 580,000, slightly higher than the 520,000 European immigrants who were newly arrived in 1970.
The number of new immigrants from Central and South America, dominated by Mexico, grew more than tenfold in the first three decades since the 1965 Immigration and Nationality Act’s enactment. In 2000, about 2.6 million immigrants from Mexico and an additional 1 million from other Central and South American nations had recently settled in the U.S. By comparison, the 1970 census recorded less than 350,000 newly arrived Central and South American immigrants, including 188,000 from Mexico. More recently, immigration from Mexico and other Central and South American countries has diminished. For example, in 2013 only 900,000 immigrants from Mexico recently arrived here, down from a peak of 2.8 million in 2005.
In 2013, there were 2.5 million recently arrived immigrants from Asia, a more than sevenfold increase since 1970. New immigration from Asia nearly quadrupled in the 1970s, and it grew by about a quarter in the 1980s and again in the 1990s.
The number of newly arrived immigrants from the Caribbean and Africa also has grown. New Caribbean immigrants now exceed those from Europe. The number of newly arrived immigrants from Africa grew 41% from 2000 to 2013, a sharper rise than for other major groups.
The Changing Demographics of the Newly Arrived
Settlement
In the two decades after passage of the Immigration and Nationality Act, newly arrived immigrants increasingly settled in four large states—California, New York, Texas and Florida. In 1970, these four magnet states were home to only about one-in-three new immigrants. By 1980, more than half of newly arrived immigrants lived in these four states, and by 1990, nearly two-thirds did.
In recent years, though, new arrivals have dispersed more widely across the country. In 2013, half of new arrivals lived in states other than the big four. Meanwhile, these four states have somewhat different patterns of change. The share of newly arrived immigrants settling in Texas and Florida has grown steadily since 1970, but the share settling in the other two states declined—markedly so in California. Fully 38% of recently arrived immigrants lived in the Golden State in 1990, but that share declined to 18% in 2013.
Since 1990, many states that previously had little exposure to international migration became the new home for recent arrivals.
Racial and Ethnic Background
Accompanying the change in the national origins of recently arrived immigrants was a shift in their racial and ethnic backgrounds. The share of new immigrants who are white, 45% in 1970, was 19% in 2013. Asians represented 35% of recent arrivals in 2013, about triple their share in 1970 (12%). Hispanics were a third of recent arrivals in 2013, after peaking at 50% in 2000. Their share of the total in 2013 was about the same as in 1970, when it was 35%.14
Gender
Following the 1965 Immigration and Nationality Act, a rising proportion of new arrivals were men. By 2000 a majority (53%) of new arrivals were men, up from less than half (46%) in 1970. However, in the 2000s, the gender pattern reversed, with women accounting for a majority (51%) of recent arrivals in 2013.
The changing gender pattern for recent immigrants is explained in part by the rise and fall of unauthorized immigration. Unauthorized immigrants are more likely to be men (Fry, 2006). As the number of unauthorized immigrants grew in the decades after passage of the 1965 law, so did the male share of recently arrived immigrants. Yet as the flow of unauthorized immigrants fell sharply in the wake of the Great Recession (Passel and Cohn, 2010, Passel, Cohn, and Gonzalez-Barrera, 2013), the female share of recent arrivals increased.
The temporary U.S. trend toward a more male-dominated immigration flow was noteworthy in part because of its rarity. In many countries of the world, women have constituted a rising share of international migrants since 1960 (United Nations Population Fund, 2006).
Age
The age of newly arrived immigrants has not significantly changed since 1970. The majority of new arrivals are 18 to 44 years old. Relatively few new arrivals are children. In 1980, 30% of recently arrived immigrants were children. While the 1965 law emphasized family reunification, the share of newly arrived immigrants who are children has steadily declined to less than 20% in 2013.
Newly Arrived Immigrants Better Educated than in 1970, but Many Live in Poverty
Education
Regardless of the educational benchmark chosen, those coming to the U.S. are much better educated than their counterparts of 50 years ago. Among adults ages 25 and older, a larger share in 2013 had a high school diploma, a college degree or an advanced degree, and a smaller share had less than a ninth-grade education. For example, half of newly arrived immigrants in 1970 had at least a high school education; in 2013, more than three-quarters did. In 1970, a fifth had graduated from college; in 2013, 41% had done so.
The improved levels of education attainment of recently arrived immigrants partly reflects rising education levels worldwide. In 2010, 45% of the world’s population had attended secondary school, up from less than 20% in 1960 (Morrison and Murtin, 2010). Among adults ages 20 to 24 in Mexico, which has been the largest source country of U.S. immigrants, the share with a secondary school education grew to a majority in 2010, compared with less than 10% in 1965 (Barro and Lee, 2013).
Compared with U.S.-born adults, recent arrivals are less likely to have finished high school, but they are more likely to have completed college or to hold an advanced degree.
The gap in high school completion between recent immigrant arrivals and the U.S. born was only four percentage points in 1970, but it widened to 18 points by 2000, reflecting a slowed increase in education levels of recent immigrants even as levels among the U.S. born steadily rose. Subsequently, the gap narrowed to 13 percentage points in 2013: 77% of recent immigrants and 90% of U.S.-born adults had completed high school.
In 1970, recently arrived immigrants (30%) were more likely than U.S.-born adults (23%) to have completed at least some college. However, U.S.-born adults surpassed newly arrived immigrants by 1990. In 2013, 57% of newly arrived immigrants had completed at least some college, compared with 61% of U.S. adults. But this is due entirely to the higher share of U.S. born adults who have some college education, but no degree.
Throughout the past 50 years newly arrived immigrants have been more likely than their U.S.-born peers to have finished at least a bachelor’s degree. In 1970, about one-in-five newly arrived immigrants had at least a bachelor’s degree compared with slightly more than one-in-ten U.S.-born adults. The immigrant advantage in college completion narrowed through the 1990s and 2000s until recently, when it began to widen again. The gap in 2013 was wider than that observed in 1970, reflecting the recent shift in the origins of newly arrived immigrants. In 2013, 41% of newly arrived immigrants had completed at least a bachelor’s degree, compared with 30% of U.S.-born adults.
Newly arrived immigrants also are more likely than U.S.-born adults to hold advanced degrees: In 2013, 18% did so, compared with 11% among those born in the U.S.15
Occupation
In 1970, 42% of newly arrived immigrants were in managerial, professional, technical, sales and administrative support occupations. But as more immigrants arrived in the 1980s, 1990s and 2000s, the share in these occupations fell, until recently. Similarly, in 1970, 28% of new arrivals were operatives and laborers. The share of new arrivals working in this broad occupational group has also steadily contracted over the decades.
However, the long-term trends hide some variation in shorter-term patterns. A rise in the share of newly arrived immigrants holding managerial and professional jobs, which tend to require more education, has taken place since 2007. This has coincided with the shift to Asia as a source region and the downturn in unauthorized immigration. Only 19% of new arrivals held those jobs in 2007, compared with 28% in 2013. Similarly, in 2007 only 19% of recent arrivals were employed in technical, sales and administrative support occupations, compared with 23% in 2013. The share of recent arrivals holding service jobs—which include a broad array of employment from fast-food workers to law enforcement—rose in most decades except the 1990s.
Family Income
The gap between recent arrivals and the U.S.-born population in median family income widened considerably during the first few decades after passage of the 1965 Immigration and Nationality Act. However, it has narrowed more recently as U.S.-born family incomes plummeted after the Great Recession.
In 2013, newly arrived immigrants had lower adjusted median family incomes than the U.S. born – $40,000 compared with $61,000. The gap in 2013 was also wider than it was in 1970.16
Family incomes of newly arrived immigrants have not exceeded their 1970 levels in any subsequent decade. Median adjusted family incomes of U.S.-born residents were larger in 2013 than in 1970, but lower than they were when the recession began in 2007.
These income calculations incorporate changes in family size over time. Family size has fallen more sharply for the U.S. born than for recently arrived immigrants.17 The average family size for both groups was nearly equal in 1970, but it was somewhat larger for new immigrants (3.5) than for the U.S. born (3.1) in 2013. All other things being equal, larger families are worse off than smaller ones with the same income because there are more people to feed, clothe and otherwise support.
Poverty
As with median family income, the share of recent immigrants in poverty is higher than for the U.S. born, and the gap has grown since 1970 (DeNavas-Walt and Proctor, 2014).18
In 1970, 18% of newly arrived immigrants lived below the official poverty line. Poverty among newly arrived immigrants trended upward until 1990, when it reached 30%. Poverty among recent immigrants fell after 1990 and was 24% in 2007. The Great Recession and weak recovery pushed poverty among recent immigrants to 28% in 2013.
Poverty among the U.S.-born population remained relatively steady at about 12% to 13% over most of the past 50 years. In the aftermath of the Great Recession, poverty peaked at 15% in 2013. The gap in poverty rates between recent arrivals and the U.S. born peaked in 1990 (at 18 percentage points); in 2013, it was 13 points.
The Impact of Changing Region of Origin
Earlier sections of this chapter documented the dramatic changes in the origins of recent immigrants to the U.S. since the 1965 Immigration and Nationality Act and the overall changes for recent immigrants in certain characteristics. This section looks in more detail at the trends in educational attainment and family incomes of recent immigrants by region of origin.
Immigrants to the U.S. in recent years are better educated than earlier immigrants, both because of overall changes in region of origin and the fact that immigrants from every major region are better educated than their counterparts were in 1970.
Recent arrivals from Mexico in 2013 were three times as likely to have at least completed high school as those who came prior to 1970. In 1970, 14% of Mexican arrivals ages 25 and older had finished high school. By 2013, 48% of Mexican recent arrivals had completed that education level.
In 2013, 95% of European arrivals had finished high school. This is nearly twice the level of high school completion by Europeans arriving in the five years prior to 1970 (48%). High school completion among immigrants coming from the Caribbean has doubled in the past 50 years. In 2013, 72% of Caribbean arrivals had finished high school, up from 36% in 1970.
In terms of college, there has been a steady upward march in the attainment of immigrants coming from Europe. In 1970, only 15% of European recent immigrants had at least a bachelor’s degree. By 2013, more than 60% of European immigrants had finished college.
The prominent exception to this upward trend in educational attainment is among recent immigrants from Africa, who were among the most educated immigrants in 1970. In 1970, 45% of recent immigrants from Africa ages 25 and older had completed at least a bachelor’s degree (at that time only 11% of the similarly aged U.S.-born population was college-educated). In 2013, 36% of new arrivals from Africa had finished at least a bachelor’s degree.
In regard to median adjusted family income, the overall stagnation in this measure among all recent immigrants hides some variation among national origin groups over the past half century. Median adjusted family income was larger in 2013 than in 1970 for recent arrivals from Mexico, Asia and especially Europe. It stagnated or declined for those from the rest of Central and South America, the Caribbean and Africa. The sharpest change in this measure was among recent immigrants from Europe, whose median adjusted family income increased by more than a third, from $48,900 in 1970 to $66,600 in 2013. The typical family income of recent arrivals from Mexico increased from $26,700 in 1970 to $31,100 in 2013. Though the median family income of new arrivals from Asia was higher before the Great Recession ($55,400 in 2007), over the long haul since the 1965 Immigration and Nationality Act, the median family income of immigrants from Asia increased from $41,600 in 1970 to $46,000 in 2013.
Chapter 4: U.S. Public Has Mixed Views of Immigrants and Immigration
Americans have complex views about immigrants living in the U.S. today. On balance, U.S. adults are somewhat more likely to say immigrants are making American society better in the long run (45%) than to say they’re making it worse (37%). Yet these views vary widely by education, race and partisan affiliation. And when asked what one word comes to mind when they think about immigrants, “illegal” is cited most often (12%).
These are among the findings of a nationally representative, bilingual survey of 3,147 adults from the Pew Research Center’s American Trends Panel conducted online March 10 to April 6, 2015. The survey’s margin of sampling error is plus or minus 2.4 percentage points at the 95% confidence level.
Most Americans Say Immigrants Are Living in Their Community
Since the 1960s, the nation’s immigrant population has grown rapidly and has dispersed across the country as areas in the southeastern U.S. and the Pacific Northwest—which are not traditional immigrant gateways—have experienced significant growth in their foreign-born populations in recent years (Pew Charitable Trusts, 2014).
As a result, many Americans now live in places that have immigrant communities. According to the new survey, about three-quarters of U.S. adults (78%) say there are immigrants living in their community. Among all Americans, about a quarter of adults (27%) say there are many recent immigrants, in the community where they live, 31% say there are some and 18% say there are only a few. Just 2% of U.S. adults say there are no recent immigrants in their community.
Those who live in urban areas are the most likely to say there are many recent immigrants living in their community; 34% say so, compared with 17% of those living in a rural area and 24% of those in the suburbs. Westerners are the most likely to say there are many recent immigrants in their community.
About a third (35%) of people living in Western states say this, while 28% of those in the Northeast, 26% of those in the South and 17% of those in the Midwest say the same.
Overall, about one-in-four (24%) Americans say they have a friend or relative who is a recent immigrant. This share is highest among those who were born outside the U.S. themselves (47%), younger Americans (36% of those ages 18 to 29) and Hispanics (39%) as well as those with college degrees (33%).
One Word to Describe Immigrants
When asked what one word first comes to mind when thinking about immigrants in the U.S. today, the word “illegal” is offered by 12% of American adults—more than any other word. Other respondents offered words such as “overpopulation” (5%), “legality” (4%), “jobs” (3%), “deportation” (3%) and “work ethic” (3%).
Mixed Views of Immigrants’ Impact on U.S. Society
Americans are more likely to say immigrants to the U.S. are making American society better than making it worse. According to the survey, a plurality of Americans (45%) say that immigrants coming to the U.S. make American society better in the long run, while 37% say they make society worse and 16% say immigrants don’t have much of an effect one way or the other.
But there are major differences in the way different groups of Americans answer this question, with immigrants themselves, college graduates, Hispanics and younger Americans much more likely to be sanguine about the impact the foreign born are having on the United States, while Republicans, those with a high school diploma or less, and whites are more likely to have the most negative views of immigrants’ impact on the U.S.
Hispanics are more likely than whites or blacks to say immigrants are making U.S. society better, possibly reflecting the groups’ strong recent immigrant roots.19 According to the survey, about six-in-ten (61%) Hispanics say that in the long run, immigrants to the U.S. are making American society better while just 20% say they make it worse and 17% say immigrants have not had much effect on U.S. society.
By comparison, 44% of blacks say the impact of immigrants is positive, a plurality among them. But among whites, while 41% say immigrants make American society better in the long run, a similar share (43%) says immigrants make American society worse.
The survey also finds sharp partisan differences in views of immigration’s impact on the U.S. Among Democrats, 55% say immigrants are making American society better in the long run, while 24% say immigrants are making things worse and 18% say they are not having much effect. But among Republicans, views are nearly the opposite: 53% say immigrants are making American society worse in the long run, while 31% say they are making things better. An additional 12% say immigrants are not having much effect on American society. Meanwhile, independents lean more positive than negative, but less so than Democrats: 45% say the impact is positive on American society in the long run, 37% say it is negative and 16% say there is not much effect.
Younger Americans are more likely than older Americans to see the impact of immigrants on the U.S. in the long run positively: 54% of those ages 18 to 29 say this, compared with 44% of those ages 30 to 49, 41% of those ages 50 to 64 and 39% of those ages 65 and older.
There is also a large education gap in views: among those with a college degree, about two-thirds (64%) say immigrants make American society better in the long run. A far lower share among those with some college (44%) or with a high school diploma or less (32%) share this view.
As might be expected, immigrants themselves are also more likely than non-immigrants to say immigrants make American society better in the long run. Fully 68% of immigrants say this is the case, while 42% of those who were born in the U.S. agree.
U.S.-born adults who live in places with immigrant communities feel more positively about immigrants. About half (45%) of this group say immigrants make American society better in the long run, compared with 33% of those who say there are no immigrants living in their community.
Public attitudes toward immigrants have grown more positive since the mid-1990s, according to Pew Research Center surveys (Pew Research Center, 2015a). About half of U.S. adults today (51%) say that immigrants strengthen the country because of their hard work and talents, compared with 41% who say that they are more of a burden because “they take our jobs, housing and health care.” In 1994, opinions were flipped: Almost two-thirds of Americans (63%) said immigrants were a burden, while 31% said they strengthened the country.
U.S. Adults Hold More Positive Views of Asian and European Immigrants than Others
Americans’ views of immigrants differ widely depending on their region of origin, with immigrants from Asia and Europe seen more positively than those from Latin America, the Middle East and Africa. However, while about four-in-ten Americans say the impact of immigrants from Latin America and the Middle East has been mostly negative, only 22% say this about African immigrants while half say they have had neither a positive nor negative effect.
The most positive reviews are reserved for Asian and European immigrants. According to the survey, 47% of U.S. adults say the impact of Asian immigrants on American society has been mostly positive, just 11% say their impact has been mostly negative and 39% say it has been neutral. When asked about the impact of European immigrants, views are similarly positive. Some 44% of U.S. adults say European immigrants’ impact on American society has been mostly positive, 9% say it has been negative and 45% say it has been neither.
Meanwhile, Americans are more likely to say the impact of Latin American immigrants on U.S. society is mostly negative (37%) than to say it is mostly positive (26%). An additional 35% say the impact of Latin American immigrants on U.S. society is neither positive nor negative.
When it comes to immigrants from the Middle East, American’s views are just as negative as they are about Latin American immigrants. Some 39% of U.S. adults say Middle Eastern immigrants have had a mostly negative impact on American society, while 20% say the impact has been mostly positive and 39% say the group’s impact has been neither.
Views of African immigrants are somewhat more mixed. While 26% of U.S. adults say the impact of African immigrants has been mostly positive and 22% say the impact has been mostly negative, half (50%) say it has been neither—a higher neutral view than for any other group of immigrants.
There are some differences by race and ethnicity. Whites are more likely than blacks and Hispanics to say that Asian and European immigrants have a positive effect on American society, while Hispanics are the most likely to say that Latin American immigration has been a positive development for the U.S. For example, 49% of whites say that European immigrants have had a positive impact, compared with 34% of Hispanics. But just 23% of whites think Latin American immigrants have had a positive impact on American society, while 39% of Hispanics say the same.
Almost identical shares of Democrats, Republicans and independents say European and Asian immigrants have had a positive effect on American society (though Republicans are more likely to say each of these groups has had a negative effect). But when it comes to the impact of Latin American, African and Middle Eastern immigrants, Democrats and independents are consistently more positive than Republicans. For example, Republicans are much more likely to say that Latin American immigrants—the largest group of immigrants among today’s modern wave—have had a negative impact (58%) than to say they’ve had a positive impact (13%), while 36% of Democrats say they’ve had a positive impact and 23% say a negative impact. Among independents, 35% say the impact of Latin American immigrants has been mostly negative, while 27% say it has been mostly positive.
Impact of Immigrants Seen as Negative on Crime, Economy but Positive on Food, Music, Arts
When asked whether immigrants are making some areas of U.S. life better or worse, the American public expresses mixed views. On the one hand, Americans see immigrants as making things better—for example, 49% say immigrants in the U.S. are making food, music and the arts better, while few see them harming these areas of life and 37% say they aren’t impacting these areas either way.
On the other hand, fully half of U.S. adults say that immigrants make American society worse when it comes to crime, while just 7% say they are making things better and 41% say they are not having much effect.20 Similarly, 50% say immigrants are hurting the American economy, significantly more than say they’re making it better (28%) or not having much effect (20%). In still other areas, the largest share of Americans expresses neutral views. When it comes to social and moral values and science and technology, close to half of adults think that immigrants don’t have much of an effect (45% and 56%, respectively). Yet, more say immigrants are making social and moral values worse than say that they are making them better (34% versus 18%, respectively), while the opposite is true in regard to science and technology (12% versus 29%, respectively).
Immigrants’ Impact on Local Communities Seen as More Neutral
Even though the U.S. public has strong views about the impact nationally of immigrants on food, music and the arts, the economy, and crime, their views of immigrants’ impact in their own communities are more neutral.21 For example, among adults who say there are immigrants in their communities, about half say that immigrants don’t have much of an impact on crime in their community (53%), job opportunities (50%) and food, music and the arts (46%). And about four-in-ten (41%) say immigrants don’t have much of an effect on community schools.
To the extent that people think immigrants have had an impact on their communities, relatively few think they are making things better in most cases. For example, only 8% say immigrants lessen the crime problem in their communities, while 36% say they are making things worse. Only a small fraction say job opportunities for themselves and their families are better because of immigrants (11%), while three times as many say immigrants are making things worse (36%). Some 15% say immigrants are making schools better, while more than twice as many say they are having a negative impact on schools (41%).
Meanwhile, even though about half of Americans say immigrants do not have much impact on food, music, and the arts in their communities, among those who do have an opinion, nearly five times as many say immigrants are making things better (42%) than say they are making things worse (9%).
Why Do Immigrants Come to the U.S.? For Economic Opportunities, Most Americans Say
When asked why most immigrants come to the United States, Americans overwhelmingly say it is for economic opportunities (74%). This far exceeds the share giving the reasons of conflict or persecution in their home country (10% believe this is the main reason), educational opportunities (4%), and being reunited with family (2%).
Immigrants are just as likely as those born in the U.S. to say that economic opportunities are immigrants’ main reason for coming to the U.S.—75% and 74%, respectively. But immigrants are less likely to give conflict or persecution in their home country as a reason compared with U.S.-born adults—6% versus 11%, respectively.
While the U.S. public believes economic opportunities drive immigrants to come to the U.S., previous research suggests that these are not the only or even most common reason given by two of the largest immigrant groups—Hispanics and Asians. A 2011 survey of Hispanic adults (Taylor, Lopez, Martínez and Velasco, 2012) found that among Hispanic immigrants, while most (55%) cited economic opportunities as the main reason they came to the U.S., they also cited family reasons (24%), educational opportunities (9%), and conflict or persecution in their home country (5%). Among Asian immigrants, by contrast, other reasons were cited more often than economic opportunities for coming to the U.S. According to a 2012 survey of Asian Americans (Pew Research Center, 2012), 31% of Asian immigrants cited family reasons as the main reason, followed by 28% who cited educational opportunities, 21% who cited economic ones and 9% who indicated conflict and persecution.
Most Americans Say Immigrants Are Not Assimilating
About two-thirds (66%) of Americans say that immigrants generally want to hold on to the customs and way of life of their home country, while just about a third (32%) believe immigrants want to adopt American customs and way of life. A large share of the foreign born themselves (55%), say that immigrants to the U.S. generally want to hold on to the customs of their home country, while 42% say immigrants want to adopt American customs.
Just as most Americans believe immigrants want to hold on to their home country’s customs, about six-in-ten (59%) also say that most recent immigrants do not learn English within a reasonable amount of time. At the same time, 76% of Americans say adult immigrants in the U.S. need to learn English to succeed.
Among immigrants themselves, most (56%) believe most recent immigrants do learn English in a reasonable amount of time, while 43% say they do not. But just like the general public, most immigrants (77%) say learning English is important for success in the U.S.
The view that immigrants generally don’t want to assimilate is particularly widespread among Republicans; 81% say this, compared with 66% of independents and 55% of Democrats who say the same. Some three-quarters of Republicans (74%) say immigrants do not learn English in a reasonable amount of time, compared with 45% of Democrats. Independents fall in between, with 59% saying immigrants do not learn English quickly enough.
Those who have relatives or friends who are immigrants have views similar to immigrants. They are more likely than those who don’t have any foreign-born friends or relatives to think that most recent immigrants learn English within a reasonable amount of time (51% vs. 36%). But they are slightly less likely than those without close immigrant ties to think immigrants need to learn English to succeed (71%, compared with 78%).
Most Americans Say U.S. Immigration System Needs Changes
Americans mostly believe that the U.S. immigration system needs changes. According to the new survey, 54% say the immigration system needs major changes and an additional 28% say it needs to be completely rebuilt. Only 16% say they think it works pretty well and requires only minor changes. This negative assessment of the U.S. immigration system is also held among those most likely to interact with it—immigrants. Half of this group (also 54%) thinks the immigration system needs major changes, though they are more likely than the general public to say that it works pretty well (25%) and less likely to think it needs to be completely rebuilt (18%).
These findings are similar to those found in a 2013 Pew Research survey of U.S. Hispanics and U.S. Asians (Lopez et al., 2013). Overall, 62% of Hispanics and 47% of Asians said that the U.S. immigration system needs to be completely rebuilt or needs major changes.
Half of Americans Say Immigration to U.S. Should Be Decreased
As for how many immigrants are coming to the U.S., about half of Americans say that immigration should be decreased (49%), while 34% think it should be kept at its present level and 15% say it should be increased.
Republicans are twice as likely as Democrats (67% vs. 33%) to think immigration to the U.S. should be decreased. And the U.S. born (51%) are more likely than immigrants (30%) to say immigration should be decreased.
When it comes to the government deciding who should be allowed to legally immigrate to the United States, a majority (56%) would prefer giving priority to people who are highly educated and highly skilled workers, even if they don’t have family members in the U.S., over people who have family members already living in the U.S., even if they are not highly educated or highly skilled workers (37%).
Democrats are evenly split on this issue, with 47% saying the government should give priority to highly educated and highly skilled workers, and another 47% saying preference should go to immigrants who have family members already living in the U.S. Republicans lean toward giving priority to highly educated and highly skilled workers (65%), as do independents (59%).
People who are most highly educated themselves are most likely to support giving priority to highly educated and highly skilled workers (61% of those with a college degree or more vs. 55% of those with some college or less). Younger Americans (59% of those ages 18 to 49 vs. 52% of those ages 50 and older) and whites (60% vs. 42% of blacks and 48% of Hispanics) are also particularly likely to say this. Immigrants’ views closely mirror those of the U.S. born on this question.
Relatively Little Knowledge About U.S. Immigration Facts22
In addition to asking about people’s views of immigrants and immigration policy, the survey tested people’s knowledge of some key facts about immigration to the U.S. today.
Almost half (47%) of respondents correctly answer that 13% of today’s U.S. population was born in another country.23 But 35% of Americans say that the U.S. foreign-born share is actually higher: 28% say about four-in-ten Americans are foreign-born, and 7% say that more than half of the U.S. population is foreign born. Just 8% of U.S. adults say the U.S. foreign-born share is less than 13%.
When it comes to the characteristics of immigrants, the U.S. public is less knowledgeable. For example, about a third (34%) of respondents correctly say that 26% of all immigrants in the U.S. today are living here illegally. But about as many overestimate this share: 22% of U.S. adults say that 45% of the U.S. immigrant population is living here illegally, and 14% answer that 62% of U.S. immigrants are in the country illegally. An additional 20% say that 9% of U.S. immigrants are living here illegally.
Americans are especially unaware of recent changes in the origins of immigrants who arrived in the past five years. Fully two-thirds (69%) say Latin American immigrants make up the largest group of recent U.S. immigrants. In fact, Asian immigrants are the largest group of recent immigrant arrivals, an answer given by only 7% of U.S. adults. An additional 13% of respondents answered Middle East, and 3% each answered Europe and Africa.
Chapter 5: U.S. Foreign-Born Population Trends
The nation’s foreign-born population increased sharply between 1970 and 2000, but its rate of growth has since slowed, according to a Pew Research Center analysis of U.S. Census Bureau data. Even so, the share of the U.S. population that is foreign born—13.1% in 2013—is approaching a historic high.24
More than 41 million immigrants lived in the U.S. as of 2013, more than four times as many as was the case in 1960 and 1970. By comparison, the U.S.-born population is only about 1.6 times the size it was in 1960. Immigrant population growth alone has accounted for 29% of U.S. population growth since 2000.
With rapid growth since 1970 in the nation’s foreign-born population, its share of the U.S. population has been rising, from 4.7% in 1970 to 13.1% in 2013. This is below the record 14.8% immigrant share in 1890, but this could rise to 18% by 2065 according to new Pew Research Center projections (see Chapter 2).
Not only has the nation’s immigrant population grown rapidly, its demographic characteristics have also changed. In 1970, the majority of immigrants were U.S. citizens (64%), but in 2013 less than half held U.S. citizenship (47%). By 2013, most immigrants were from either Latin America or South or East Asia, a very different profile than that of immigrants in 1960 and 1970, who were mostly from Europe.
This chapter paints a portrait of the U.S. foreign-born population from 1960 to 2013, including trends in countries and regions of birth, time spent living in the U.S., languages spoken, age, geographic settlement in the United States, marital status, and legal status and citizenship.
Accompanying it is a statistical portrait of the nation’s foreign born from 1960 to 2013. Also accompanying this chapter is an online interactive exploring the top country of origin among immigrants in each state from 1850 to 2013, reflecting waves of immigrants from Ireland, Germany, Italy and Mexico, among other countries.
Regions and Countries of Birth
A dramatic shift in the origins of U.S. immigrants has occurred since the passage of the Immigration and Nationality Act of 1965, which eliminated national origin quotas and cleared the way for immigration from non-European countries. In 1960, 84% of the nation’s immigrants were from Europe or Canada. By 1970, that share had dropped to 68% and by 1980 was just 42% as migration from Latin America surged.
Not only did the European and Canadian share among immigrants fall, but so, too, did their numbers. In 1960, 8.2 million immigrants from Europe and Canada were living in the U.S. By 2013, that number had fallen to 5.9 million. Over the same period, the number of immigrants who were born in South or East Asia increased almost thirtyfold, from about 400,000 in 1960 to 10.7 million in 2013. Immigrants from Mexico are not far behind, with about 20 times as many Mexican immigrants in 2013 (11.6 million) as there were in 1960 (600,000).
Immigrant populations born in other parts of the world have also experienced high rates of growth. Immigration from sub-Saharan Africa is the standout, with the population in 2013 (1.5 million) about 133 times that of 1960 (only 11,000) (Anderson, 2015). Foreign-born populations from other parts of Latin America (the Caribbean, South America, Central America) and the Middle East have also increased by factors of 10 or greater.
As of 2013, Mexican immigrants were the single largest source country for the nation’s foreign born, (28%). The region of South or East Asia was not far behind at 26%. Other regions accounting for significant shares of the immigrant population were the Caribbean, at about 10% of the U.S. foreign born, Central America (8%), South America (7%), the Middle East (4%) and sub-Saharan Africa (4%).
Italy was the top country of origin for U.S. immigrants in 1960 and 1970, followed by Canada and Germany. By 1980, however, the top 10 countries of origin had changed. Mexico shot to the top of the list, and Asian countries (the Philippines and China) were among the top 10. Mexico has been the top country of origin by a wide margin ever since. In 2013, China and India were the second and third biggest countries of origins for U.S. immigrants, respectively.
Looking at the top countries of origin among immigrants in the U.S. by state, there is a shift from 1960 to 2013. In 1960, while Mexico was the biggest country of origin in the border states (California, Arizona, New Mexico and Texas), Canada and European countries such as Italy, Germany and the United Kingdom dominated the rest of the country. In 2013, Mexico was the top country of origin in 33 states, encompassing most of the West, South and Midwest. Immigrants in the remaining states have diverse origins, including the Caribbean, Central America, Canada, South and East Asia and Africa.
From Ireland to Germany to Italy to Mexico: How America’s Source of Immigrants Has Changed in the States, 1850 to 2013
Time Living in the U.S.
The nation’s immigrants are more settled in 2013 than they were in 1990, when the share of those who arrived in the 10-year period before the census or survey was taken peaked.
In 1970, 69% of immigrants had lived in the United States for more than 10 years. This share dropped after the influx of immigrants in the 1970s and 1980s, and by 1990 only 56% of immigrants had lived in the U.S. for over a decade. As of 2013, though, this share topped the 1970 share, at 72%.
On the opposite end of the spectrum, the share of the foreign-born population who had immigrated within a decade prior to the survey peaked in 1990, at 44%, up from 31% in 1970. In 2013, this was back to a level similar to that seen in 1970 (28%).
Some regional groups of immigrants followed this pattern of reaching a low in number of years lived in the U.S. around 1980 or 1990. However, several regions experienced a steady decline from 1970 to 2013. For example, the share of South Americans who had immigrated within 10 years of the survey steadily fell in each decade, from 75% in 1970 to 28% in 2013.
A larger share of immigrants from Europe and Canada had arrived in the past 10 years in 2013 (22%) than had done so in 1970 (18%). Over the same period, though, the share of immigrants who had arrived in the past 10 years fell dramatically among those from South and East Asia, Latin America and sub-Saharan Africa.
Language Use
The share of immigrants who speak only English at home declined from 30% in 1980 (the first year the census asked about English-speaking ability) to 2000 (17%), but it has been steady since then, at 16% in 2013.25
Looked at another way, the share of U.S. immigrants who speak English “less than very well” grew from 43% in 1980 to 50% in 2013. Meanwhile, the share who speak English “very well” rose slightly from 27% to 34% over the same period.
Among all immigrants ages 5 and older, 16% say they speak only English at home. The largest share (44%) speak Spanish. An additional 6% say they speak Chinese (Mandarin or Cantonese), and 5% speak “Hindi and related” languages. Other languages spoken include Filipino/Tagalog (4%), Vietnamese (3%), French (3%) and Korean (2%). No other single language accounts for more than 2% of foreign-language immigrant speakers.
Age
Since at least 1960, the foreign-born population has had an older median age than the U.S.-born population. Most people who migrate internationally are of working age and a smaller share of immigrants are children compared with the U.S.-born population. But the gap has narrowed as the two groups took different trajectories, with immigrants getting younger and the U.S. born population getting older. In 1960, immigrants had a median age of 57 years—more than double that of the U.S. born (27), reflecting the slowdown that was taking place in the arrival of new immigrants between the 1920s and the 1960s. The gap rapidly narrowed as a new wave of immigrants arrived in the 1970s, 1980s and 1990s until 2000, when immigrants were on average only two years older than the U.S. born (37 vs. 35). By 2013, the gap had once again widened to a median age of 43 years among the foreign born and 35 years among the U.S. born, reflecting a more recent slowdown in migration from Mexico and other countries (Passel, Cohn and Gonzalez-Barrera, 2012).
Immigrants from Europe and Canada have long had the highest median age among the foreign born at 59 years in 1960 and 52 years in 2013. As the overall composition of the foreign-born population has shifted from a large majority European and Canadian group to a plurality Mexican group, the median age has shifted more toward that of Mexican immigrants (39 years in 2013, a little younger than 43 years in 1960). South or East Asian immigrants account for another large part of the foreign-born population in 2013, and their median age was 43 years in 2013—up from 38 years in 1960, though it reached a low of 31 years in 1980.
The age pyramid profiles of the foreign-born population also reflect this large shift over the years. In 1960, the foreign-born population was older than today, with a large portion of immigrants between ages 55 and 74. By 2013, though, immigrants were most likely to be between 30 to 49 years old, and the overall age of the population was lower than in previous decades.
The U.S.-born population, meanwhile, is growing older. In 1960, during the tail end of the baby boom, the population skewed young, with the single largest age group younger than age 5. As of 2013, the Baby Boomer generation has aged, and the most recent generation, the Millennials, was a comparable size, creating a more uniform age pyramid.
Geographic Settlement
The South has by far seen the biggest increase in its foreign-born population, from less than 1 million in 1960 to 13 million in 2013. In more recent years, between 2000 and 2013, the foreign-born population in the South increased by 55%. The Northeast, Midwest and West each had more modest increases of about 20% to 30% over the same period. The South and West each accounted for about 40% of the overall change in the U.S. in this period, compared with 14% in the Northeast and 7% in the Midwest.
As the nation’s foreign-born population has more than quadrupled since 1960, many states have experienced exponential growth. In particular, the foreign-born populations in Georgia, Nevada and North Carolina have increased more than thirtyfold. California has had the largest numerical increase, from 1.3 million in 1960 to 10.3 million in 2013.
The share foreign born has risen in most states since 1960. All of the states experiencing decreases are located in the far north (Montana, North and South Dakota, Michigan, Vermont, New Hampshire and Maine).
The foreign-born population has become more evenly dispersed across the country over time. For example, nearly half of immigrants (47%) lived in the Northeast in 1960, but only 22% did so in 2013. The share living in the South, meanwhile, increased from 10% in 1960 to 32% in 2013.
Even so, the five U.S. counties with the largest foreign-born populations in 2013 (Los Angeles County, Calif.; Miami-Dade County, Fla.; Cook County, Ill.; Queens County, N.Y.; and Harris County, Tex.) accounted for fully 20% of the U.S. immigrant population. The population has become more dispersed since 1990, when the top five counties accounted for 30% of the immigrant population.
Marital Status
Among immigrants to the U.S., the share who are married has declined steadily since 1960 (from 68% in 1960 to 60% in 2013). The decline comes as immigrants are more than twice as likely to have never been married as they were in 1960 (24% in 2013, up from 10% in 1960) and more likely to be divorced and separated.
This decline in marriage rates among immigrants is a small change compared with the trend among their U.S.-born counterparts. Among those born in the U.S., the share who are married fell from 73% in 1960 to just 48% in 2013, as the share never married rose from 15% to 31% over the same period. The share that is separated, divorced and widowed follows similar patterns to those of the foreign born.
The share of people who live in a married couple household has taken a similar trajectory. In 1960, 77% of immigrants lived in a married couple household, compared with 64% in 2013. The share fell even more steeply among the U.S. born, from 85% to 59%.
Meanwhile, the shares of both the foreign born and the U.S. born living in female householder, male householder, or non-family households have all risen. The share of immigrants living in households with a female householder almost doubled, from 7% in 1960 to 14% in 2013, with a similar pattern among the U.S. born (8% to 18%). Some 4% of the foreign-born population lived in households headed by a male householder in 1960, rising to 9% in 2013 (compared with 2%, increasing to 6% among the U.S. born). While the share of immigrants living in non-family households has been relatively stable (at 12% in 1960 and 13% in 2013), those born in the U.S. are more than three times as likely to be living in a non-family unit as they were in 1960 (5% in 1960, compared with 17% in 2013).
Legal Status of U.S. Immigrants
As of 2012, the plurality of immigrants were naturalized citizens, at 42%. An additional 27% were legal permanent residents, and 4.5% of foreign-born residents are temporary legal residents such as students. As of 2012, unauthorized immigrants—those in the country illegally—made up about a quarter of the foreign-born population (26%), numbering more than 11 million (Passel, Cohn, Krogstad and Gonzalez-Barrera, 2014).
From 1990 to 2007, the unauthorized immigrant population grew sharply and steadily, rising from 3.5 million to a peak of 12.2 million in 2007—more than tripling within two decades. Since then, though, growth has leveled off. The population stood at 11.3 million in 2014, statistically unchanged since 2009 (Passel and Cohn, 2015).
A slowdown in immigration from Mexico is responsible for much of this leveling off (Gonzalez-Barrera and Krogstad, 2015). The number of unauthorized Mexican immigrants peaked at 6.9 million in 2007 and has been on the decline ever since, reaching 5.9 million in 2012 (Passel and Cohn, 2014). Mexicans make up a slight majority of unauthorized immigrants (52% in 2012).
Betts, Julian R., and Magnus Lofstrom. 2000. “The Educational Attainment of Immigrants: Trends and Implications.” In Issues in the Economics of Immigration, edited by George J. Borjas, 51-116. Chicago: University of Chicago Press.
Burkhauser, Richard V., and Jeff Larrimore. 2014. “Median Income and Income Inequality: From 2000 and Beyond.” In Diversity and Disparities: America Enters a New Century, edited by John Logan. New York, NY: Russell Sage Foundation.
DeNavas-Walt, Carmen and Bernadette D. Proctor. 2014. “Income and Poverty, in the United States: 2013.” Current Population Reports, Consumer Income, P60-249. Washington, D.C.: U.S. Census Bureau, September.
Edmonston, Barry and Jeffrey S. Passel. 1992. “Immigration and Immigrant Generations in Population Projections.” International Journal of Forecasting vol. 8, no. 3: 459–476.
Edmonston, Barry and Jeffrey S. Passel. 1994. “Immigration and Race: Recent Trends in Immigration to the United States.” In Immigration and Ethnicity: The Integration of America’s Newest Arrivals, edited by Barry Edmonston and Jeffrey S. Passel. Washington, D.C.: The Urban Institute Press.
Kritz, Mary M. and Douglas T. Gurak. 2005. “Immigration and a Changing America.” In The American People: Census 2000. Reynolds Farley and John Haaga, editors. Russell Sage Foundation.
Massey, Douglas S. and Karen A. Pren. 2012. “Unintended Consequences of U.S. Immigration Policy: Explaining the Post-1965 Surge from Latin America.” Population and Development Review 38 (1, March).
Morrison, Christian and Fabrice Murtin. 2010. “The Kuznets Curve of Education: A Global Perspective on Education Inequalities, LSE Centre for the Economics of Education DP 116,” June.
Mule, Thomas. 2012. “2010 Census Coverage Measurement Estimation Report: Summary of Estimates of Coverage for Persons in the United States.” Memorandum from Patricia Cantwell prepared for David C. Whitford. Washington, D.C.: U.S. Census Bureau, May.
National Center for Health Statistics (NCHS). 1964. United States Life Tables: 1959-61. Washington, D.C.: Centers for Disease Control and Prevention.
National Center for Health Statistics (NCHS). 1975. United States Life Tables: 1969-71. Washington, D.C.: Centers for Disease Control and Prevention.
National Center for Health Statistics (NCHS). 1985. U.S. Decennial Life Tables for 1979-81. Washington, D.C.: Centers for Disease Control and Prevention.
National Center for Health Statistics (NCHS). 1997. U.S. Decennial Life Tables for 1989-91. Washington, D.C.: Centers for Disease Control and Prevention.
Passel, Jeffrey S. 2004. “Methodology and Assumptions for Population Estimates and Projections by Race and Generation, 1960–2030.” Report prepared for National Academy of Sciences. Washington, D.C.: Urban Institute, August.
Passel, Jeffrey S. and Barry Edmonston. 1994. “Immigration and Race: Recent Trends in Immigration to the United States,” Immigration and Ethnicity: The Integration of America’s Newest Arrivals, edited by Barry Edmonston and Jeffrey S. Passel. Washington, D.C.: The Urban Institute Press.
Robinson, J. Gregory. 2001. “ESCAP II” Demographic Analysis Results,” Report No. 1, Executive Steering Committee for A.C.E. Policy II. Washington, D.C.: U.S. Census Bureau, October.
Smith, James P., and Barry Edmonston, editors. 1997. The New Americans: Economic, Demographic and Fiscal Effects of Immigration. Washington, D.C.: National Academy of Sciences.
U.S. Census Bureau. 2013. “Intercensal Population Estimates (2000-2010).” Accessed online at http://www.census.gov/popest/data/intercensal/index.html on July 24, 2015.
U.S. Census Bureau. 2014. “2014 National Population Projections.” Accessed online at http://www.census.gov/population/projections/data/national/2014.html on July 24, 2015.
U.S. Census Bureau. 2015. “National Population Estimates: Vintage 2014.” Accessed online at http://www.census.gov/popest/data/index.html on July 24, 2015.
U.S. Department of Justice. 1965. “Annual Report of the Immigration and Naturalization Service. U.S. Government Printing Office. Accessed online at https://archive.org/details/annualreportofim1965unit on June 15, 2015.
This report provides a 100-year look at the impact of immigration on the nation’s demographics since passage of the 1965 Immigration and Nationality Act. It explores how the nation’s population has changed since the law was enacted and includes new Pew Research Center population projections through 2065. These projections are included for the nation as a whole as well for its immigrant generations and its racial and ethnic groups. The new projections are based on detailed assumptions about births, deaths and immigration levels—the three key components of population change. All these assumptions are built on recent trends, but it is important to note that these trends can change. As a result, all population projections have inherent uncertainties, especially for years further in the future, since they can be affected by changes in behavior, new immigration policies or other events.
The projections and historical population estimates that are the focus of Chapter 2 of this report are adjusted for undercount in the census data in order to ensure consistency over time and with estimates of immigrants by legal status (Passel and Cohn 2015). Accordingly, the projections and estimates are not consistent with Census Bureau data about the number and characteristics of immigrants analyzed in Chapters 3 and 5 of this report, and the two sets of numbers may differ. For more, see Appendix A: Methodology (link).
New survey findings from the Pew Research Center’s American Trends Panel exploring the U.S. public’s views of immigrants and their impact nationally and in local communities are also included in this report. The survey was conducted in English and Spanish online among a nationally representative probability sample from March 10 to April 6, 2015, before the current national discussion about national immigration policy, unauthorized immigration and birthright citizenship. The survey’s margin of sampling error is plus or minus 2.4 percentage points at the 95% confidence interval.
The report also examines the economic and demographic characteristics of immigrants in the U.S. today as well as trends in the characteristics of immigrants who have arrived since the 1960s. The data for this portion of the report and the accompanying statistical portrait (link) of the nation’s foreign-born population in 2013 come from several sources, including the U.S. Census Bureau’s 2013, 2010 and 2007 American Community Surveys, which provide detailed geographic, demographic and economic characteristics of the nation’s immigrant population, and the 1960, 1970, 1980, 1990 and 2000 decennial censuses (IPUMS).
Accompanying the report are two interactives. The first is a legislative timeline (link) highlighting key U.S. immigration policy legislation and executive actions since 1790. The second is an interactive map showing (link), at the state level, the largest immigrant group in each state from 1850 through 2013.
Many people contributed to the writing and development of this report. Richard Fry, senior researcher, was the primary project leader and wrote Chapter 3. Mark Hugo Lopez, director of Hispanic research, and D’Vera Cohn, senior writer/editor, wrote the overview. Lopez also provided editorial guidance on all aspects of the report. Chapter 1 was written by Cohn. Chapter 2 was written by Cohn and Jeffrey S. Passel, senior demographer. Chapters 4 and 5 were written by Anna Brown, research assistant, who also compiled the statistical portrait of immigrants (link).
Editorial guidance was provided by Claudia Deane, vice president, research; Kim Parker, director of social trends research; Juliana Menasce Horowitz, associate director of social trends research; and Paul Taylor, former executive vice president of the Pew Research Center. Brown and Horowitz managed development of the survey questionnaire; research methodologists Kyley McGeeney and Andrew Mercer provided guidance on questionnaire development and survey implementation. Gustavo López, research assistant, and Renee Stepler, research assistant, created charts and tables for various parts of the report. Stepler also compiled the immigration law timeline. Michael Keegan, information graphics designer; Michael Suh, associate digital producer; and Dana Amihere, Web developer, provided digital support for the report and its accompanying interactives. Eileen Patten, research analyst, number-checked the graphics and text, as did Brown, López and Stepler. Marcia Kramer copy edited the report.
Population Estimates and Projections: Definitions, Methods and Data Sources
Overall Methodology
The national projections presented here use a variant of the basic cohort component model in which the initial population is carried forward into the future by adding new births, subtracting deaths, adding people moving into the country (immigrants), and subtracting people moving out (emigrants). The model used for Pew Research Center projections and historical population estimates was presented in a previous report (Passel and Cohn, 2008); it is the cohort component method modified to incorporate immigrant generations by Edmonston and Passel (1992). In this application, five generation groups for U.S. residents are defined and then collapsed to the three conventional generation groups:
Foreign-born population, or the first generation;
U.S.-born population of foreign (or mixed) parentage, or the second generation;
U.S.-born population with U.S.-born parents, or third-and-higher generation: 3a. Puerto Rican-born population (includes all people born in U.S. territories); 3b. Mainland-born population (i.e., people born in the 50 states plus the District of Columbia) with at least one Puerto Rican-born parent; and 3c. Mainland-born population with mainland-born parents plus people born in foreign countries to U.S. citizen parents (i.e., the population born abroad of American parents).
In the projection methodology, each of the five generation groups is carried forward separately. Immigrants and emigrants enter and leave the first generation; migrants from Puerto Rico and other U.S. territories enter (and leave) the Puerto Rican-born population. Births are assigned to generations based on the generation of the mother and a matrix allowing for cross-generational fertility. All births to first-generation women are assigned to the second generation; all births to the Puerto Rican-born population are assigned to the Puerto Rican parentage population (group 3.b). Most births to the second and third-and-higher generations are assigned to the third-and-higher generation, but some are assigned to the second generation to allow for mixed generation couples that include immigrants. Likewise, most births to women of Puerto Rican parentage are assigned to the third-and-higher generation, but some are assigned to the Puerto Rican parentage population to allow for mixed couples including Puerto Rican-born migrants. The generational assignment matrix (or G matrix) is based on race/ethnic origin but is allowed to vary dynamically in the 2015-2065 projections based on relative generational sizes.
For these projections, the entire population is divided into six mutually exclusive racial/ethnic groups:
Hispanic origin;
White alone, not Hispanic;
Black alone, not Hispanic;
Asian or Pacific Islander alone, not Hispanic (generally called “Asian”);
American Indian/Alaska Native (AIAN) alone, not Hispanic; and
Two-or-more races, not Hispanic
The report also includes a historical analysis using data developed with the same projection methods and estimates of the demographic components. The components are estimated so as to reproduce as closely as possible a series of benchmarks—the decennial censuses from 1960 to 2000 and estimated populations for 2005, 2010 and 2015 by age, sex, race/Hispanic origin and generation with adjustments for census undercount. The projections and historical analyses use five-year age groups up to 85 years and older by sex. The projections are done for five-year time steps from July 1, 2015 to July 1, 2065; the historical estimates also include five-year time steps from 1960 to 2015.
The remainder of this section describes the underlying data and assumptions for the projections and historical analyses. The first section describes the benchmark populations and the methods for defining and measuring the racial/ethnic groupings and the generational groups. The next sections treat the assumptions for the major demographic components of immigration, fertility and mortality for 2015-2065, with a particular emphasis on immigration. Within each of these components, the data and the methods used to define the historical population and components of change are described.
Demographic Components of Population Change
Demographic components of population change account for all additions and subtractions from the national U.S. population. Births and deaths are the largest of the components, but measurement of immigration is far more complicated because there are multiple channels of entry to and exit from the U.S. population. For some of parts of the immigration component, such as legal immigration, the available data are better and accurate measurement is easier than for others, such as unauthorized (sometimes called “illegal”) immigration. The measurement methods differ among the immigration components, in part, because of the nature of the data and, in part, because some of the immigration concepts dictate particular methods.
The demographic components included in the population projection model are:
Births (or fertility rates);
Deaths (or mortality rates);
Immigration—
Total Immigration (including legal immigrants, refugees, asylees and unauthorized immigrants—but not broken out separately);
Emigration;
Net Movement from Puerto Rico and other U.S. Territories;
Net Temporary Migration;
Other Minor Components
Definitions (Race, Hispanic Origin and Generations)
Racial/Ethnic Groups
The race/Hispanic population groups used for the projections and in constructing the benchmark populations are mutually exclusive and encompass the entire U.S. population. They are almost identical to groups used by the Census Bureau in their current population estimates (U.S. Census Bureau, 2015), intercensal population estimates for 2000-2010 (U.S. Census Bureau, 2013) and recent population projections (U.S. Census Bureau, 2014). For the historical estimates and projections, the Asian (not Hispanic) and Native Hawaiian and other Pacific Islander or NHPI (not Hispanic) populations are combined in order to be consistent with pre-2000 data and because of the small size of the NHPI population.
In constructing the benchmark populations by age, sex, race-Hispanic origin and generation, we used microdata from the Integrated Public-Use Microdata Series (IPUMS) for decennial censuses of 1960-2000 and the American Community Survey (ACS) for 2001-2013. The race and Hispanic data collected in the decennial censuses and ACS do not correspond exactly to the definitions used in the Census Bureau’s population estimates and projections, nor do they match to the definitions used here. Consequently, a number of modifications had to be made in setting up the benchmark populations. The Hispanic origin variable is available in the 1980 Census and later and was used to construct the Hispanic population estimates. For 1960 and 1970, IPUMS created a Hispanic origin variable roughly comparable to the post-1980 data using information on place of birth, mother tongue, surnames and family relationships. This IPUMS variable was used for the benchmark data on the Hispanic population.
In the 2000 Census and the 2001-2013 ACS, respondents are permitted to select more than one race. Most individuals who do so are classified as “two or more races,” with a few exceptions. First, if the two races are Asian and NHPI, the individuals are classified in our population estimates as “Asian.” Next, among non-Hispanics, some individuals are classified as “some other race,” a category not used in the Census Bureau’s the Census Bureau’s population estimates. Individuals who choose two races, one of which is “some other race” and the other is one of the five specified races (white, black, Asian, NHPI, AIAN), are classified in the specified race. The few non-Hispanic individuals who chose “some other race” are grouped with the white, not Hispanic population; for the 1960-1990 Censuses, the very few non-Hispanics of “some other race” were grouped with the white, non-Hispanic population.
Multiple Race, 1960-1990. These race assignment procedures do not yield completely consistent data across the 1960-2013. In particular, the data for 1960-1990 do not include a classification for non-Hispanics of mixed race of “two or more races.” To provide consistent data, we constructed estimates of people in 1960-1990 who would be in that group in 2000 and later. To start these estimates, we mapped the two-or-more-races population in the 2000 Census and the 2005-2013 ACS into single races using the IPUMS variable RACESINGD, which provides the most probable single race for individuals who chose more than one race group, on a case-by-case basis. By combining the remapped multiple race populations with the single race populations, we constructed a population for 2000 that is consistent with data as collected in the 1960-1990 Censuses. From these data, we construct estimates of the share of each age-sex-race/Hispanic origin group that provided multiple race responses in the 2000 Census (and in ACS data for 2001-2013). These percentages were estimated separately for the native population and for the foreign-born population subdivided by five-year periods of entry.
The percentages of the historically consistent U.S.-born race populations that identified as two-or-more races were then applied to the same U.S.-born cohorts in 1960 through 1990 to estimate the population of native population by single race and of two or more races. For the foreign-born population, similar percentages were calculated for age-sex groups in pre-1990 entry cohorts; these shares were then applied to the same age-sex-period-of-entry cohorts in earlier censuses. The same calculation was done for the “Puerto Rican-born” population. The result of these various estimation procedures is a set of population figures for 1960, 1970, 1980 and 1990 subdivided by age, sex, race/Hispanic origin (according to post-2000 definitions) for the foreign-born population, the population born in Puerto Rico and outlying areas, and the remaining U.S.-born population. For 2000-2013, the same groups are available from tabulations of IPUMS data.
Projected Race-Hispanic Origin. Both the historical population estimates for 1960-2015 and projections for 2015-2065 use race/Hispanic origin categories consistent with current data from the ACS. For the projections, births are assigned to the race/Hispanic origin category of the mother. The definitions, usage, practices and race/ethnic identities in the future might be quite different. In particular, marriage across race/Hispanic origin categories has been increasing (Wang 2015) and future generations may choose to identify differently. Consequently, the projections presented here should be treated as the representing the continuation of the current race/Hispanic origin categories.
The methodology used for the projections includes parameters for assigning births to race/Hispanic origin categories other than the category of the mother. These parameters permit modeling of race/Hispanic intermarriage, childbearing with parents of different groups and changing patterns of self-identification. A particular example of the potential of such modeling is the projected population of two or more races. In the projections presented here, births in the two-or-more-races category come only from mothers in this population. It is likely, however, that future births in this group will also come from mothers (and fathers) in the specific race/Hispanic origin categories. Future projections will incorporate alternative assignments of births to groups other than mothers’.
Generations
The full array of generations can only be obtained directly from the 1960 and 1970 Censuses because these two include the questions on nativity, citizenship and parents’ places of birth that are required to produce tabulations of these five generations. In censuses since 1970 and the ACS, the parental birthplace questions were dropped, so the censuses of 1980, 1990 and 2000 and the 2001-2013 ACS can provide direct data only for the foreign-born, Puerto Rican-born, and U.S.-born populations; this U.S.-born population encompasses the second generation—generation (2), the mainland-born population of Puerto Rican parentage—generation (3.b), and the mainland-born population with mainland-born parents—generation (3.c). For the benchmark populations of 1980, 1990, 2000, 2005, 2010 and 2015, two different approaches were used to estimate the shares of the third-and-higher generation population in each of the three constituent groups. One approach is “forward looking,” i.e. based on 1960 and 1970 populations carried forward to the benchmark dates and the other “backward looking,” i.e., based on post-2000 data from the Current Population Survey (CPS).
In the forward-looking approach, the U.S.-born population by generation in 1960 or 1970 was projected forward (using the basic projections methodology) to the benchmark dates for 1980 and later. The U.S.-born population within each age-sex-race/Hispanic origin group (that was alive in 1960 or 1970) at each benchmark date was distributed to the more detailed generations using these projections. The initial approximations are based on the average of the 1960-based and 1970-based projections.
Beginning in 1994, the CPS includes the data needed to construct the fully-detailed five generations—country of birth, citizenship and country of birth of parents(s). Then, in 2003, the CPS race question allowed respondents to choose more than one race response, mirroring the 2000 Census, the existing ACS data for 2001-2002 and the yet-to-be-conducted ACS for 2003-2013. The CPS sample is too small to provide very precise estimates of generational distributions for some of the smaller groups. Accordingly, multiple monthly CPS and March supplements were averaged over 2003-2007 to estimate distributions for 2005, over 2008-2012 for 2010 and over 2010-2015 for 2015. Within age-sex-race/Hispanic origin cohorts, we estimated the share of the U.S.-born population in each of the constituent generations. These shares were applied to the same cohorts based on their ages in 1980, 1990, 2000, 2005, and 2010 to provide alternative estimates of the generational distributions. Next, the CPS-based backward-looking estimates were averaged with the 1960-1970-based forward looking estimates. A final adjustment involved checking the benchmark estimates for consistency with the census data.
Benchmark Population Estimates: 1960-2015
The basic population distributions (by age, sex, race/Hispanic origin and generation) for the benchmark dates through 2010 are based on the census and ACS figures developed with the procedures outlined above. Several further steps are required to produce an internally consistent set of population figures across time. Because of differential undercounts by age and across censuses, data for age-sex-race/Hispanic groups are generally not consistent over time. For example, black males at ages 10-14 and 15-19 have generally had lower undercount rates than the age groups 10 years older, 20-24 and 25-29 (Robinson, 2001); often the differences for the cohorts from one census to the next can be as much as 10 percentage points. This difference means that projection of these teenage cohorts to the next census date based on components of change, even when measured with extreme accuracy, will be 10 percentage points high when compared with the results of the subsequent census for the cohorts who are now in their 20s.
To reduce inconsistencies due to differential patterns of undercount across censuses, the benchmark populations and historical estimates are adjusted for census undercount using estimates based on those produced by the Census Bureau (Robinson, 2001 for data from the 1960-2000 Censuses and from Mule, 2012 for the 2010 census-based data used for 2005-2015). Overall, undercount rates are lowest for the white and Asian populations; higher for males than females; higher for young children and for adults aged 25-49. Pew Research Center analysis of data for the foreign-born population and of estimates measuring unauthorized immigration has found that undercount rates for the first generation are significantly higher than for the U.S.-born population (see Passel and Cohn 2014).
Adjustments for census undercount were 3.1% for the 1960 Census, 2.7% for 1970, 1.0% for 1980, 1.9% for 1990 and only 0.1% for 2000. The differential undercounts for the foreign-born population are driven largely, but not entirely, by the relatively poor coverage of unauthorized immigrants. Accordingly, differences between undercount rates for the U.S.-born and foreign-born populations are larger in more recent years when the number of unauthorized immigrants in the country is larger. Thus, adjustments for undercount of the immigrant population in 1960 and 1970, when there were few (or no) unauthorized immigrants in the country differ by less than 1 percentage point from the overall adjustment. However, in 1980 and later, the undercount rates for the foreign-born are significantly larger than the overall adjustments—2.6% in 1980, 5.5% in 1990 and 3.2% in 2000.
Population Estimates for 2005-2015
Initial population estimates for 2005 and 2010 were based on tabulations of ACS data from IPUMS. For 2005, however, the data were augmented with records for the group quarters population and the weights were adjusted to be compatible with the Census Bureau’s intercensal population estimates that take into account results of both the 2000 and 2010 Censuses. (See Passel and Cohn 2014 and Passel, Cohn and Gonzalez-Barrera 2013 for a description of these alternative weights and their impact in the population estimates.) Assignments from the three generations available in ACS data (foreign born, Puerto Rican born and U.S. born) to the full five-generation array used in our estimates and projections is based on projections from 2000 and earlier plus CPS data for surrounding years. Undercount adjustments for 2005 and 2010 used the detailed rates from 2000 with minor calibrations for 2010 results (Mule 2012).
For 2015, alternative population estimates were needed because the most recent ACS data for age-sex-race/Hispanic origin-generation groups was from the 2013 ACS or 2014 CPS. The data for 2015 by age-sex-race/Hispanic origin come from the Census Bureau’s Vintage 2014 population estimates (U.S. Census Bureau, 2015) for basic data and for monthly data through June 2015. First, we generated estimates for July 1, 2015 by extrapolating forward one month from the June 1, 2015 estimates. Next, the population in each age-sex-race/Hispanic group is distributed to foreign-born, Puerto Rican-born and U.S.-born generations based on distributions by cohort from the 2010-2013 ACS extrapolated to 2015. Then, the distribution was adjusted to the full five generations using projections from 2000 and earlier plus the most recent CPS data available. Finally, undercount rate adjustments for 2015 used the same rates as in 2010. As a check on the estimates for 2005, 2010 and 2015, projections from 2000 were used to identify misalignments and make final adjustments.
Immigration
The immigration assumptions are critical for both the projections and the historical analyses. Immigration increased substantially over the 1960-2005 period with particularly large increases for Hispanics and Asians. The rapid growth in the Hispanic population, for example, enabling Hispanics to surpass blacks as the largest minority population shortly after 2000 is attributable principally to the very large numbers of Hispanic immigrants arriving since 1965.
Immigration has been the most difficult demographic component to forecast. It is directly affected by national policies in ways that fertility and mortality are not. In addition, some immigration flows, especially of unauthorized immigrants can be very sensitive to economic conditions in the U.S. and abroad as flows can increase in economic boom times and drop when the economy is slow. Although many of the social and economic factors affecting migration trends are reasonably well-known, there is no broadly accepted theoretical framework that can be readily applied in a projections perspective (Howe and Jackson, 2005). (See Passel and Cohn, 2008 for a discussion of frameworks for projection and longer-term historical analyses.)
Historical Immigration, 1960-2015
Total immigration to the United States moved in a steadily upward direction from the 1930s through 1995-2000. From 1960-1965 to 1995-2000, the average annual flow of new immigrants increased more than fivefold (from about 330,000 per year to 1,770,000). Much of this increase was due to very significant growth in Hispanic immigration, with much of it from Mexico and much of it unauthorized. After 2000, the increase stopped and flows dropped very slightly for 2000-2005 (to an average of about 1,660,000). With the onset of the Great Recession of 2007-2009, immigration dropped dramatically after 2007, largely due to a decrease and then a reversal of unauthorized immigration from Mexico (Passel, Cohn and Gonzalez-Barrera 2012 and subsequent Pew Research Center reports on unauthorized immigration). For the 2005-2010, immigration flows (1,310,000 per year) were about 20% below those of the previous five years. Immigration remained slightly below this level after 2010 as unauthorized immigration flows fell to essentially zero (Passel and Cohn, 2015).
Separation of total immigration flows into legal and unauthorized is difficult. Although we have measures of the size of the unauthorized population at various points, the flows can be difficult to measure, especially for the period before 1995. Moreover, projection of legal and unauthorized immigration separately requires an assessment of future legislation affecting the legal status of the current and future immigrant populations. Accordingly, both the historical analyses and projections deal with the total immigration flow of both legal and unauthorized immigrants combined without attempting to differentiate them by legal status.
Initial estimates of immigrant arrivals for each five-year period from 1960-1965 through 2010-2015 were generated by tabulating data from the 1970-2000 censuses and 2001-2013 ACS. Generally, the “closest” census to the time interval was used to estimate immigrant arrivals by age, sex, race and Hispanic origin. The 1970 Census provided data for 1960-1964 and 1965-1969 based on a 3% merged sample from IPUMS; the 5% IPUMS data from the 1980 Census was used for 1970-1974 and 1975-1980; the 5% IPUMS data from the 1990 Census was used for the two five-year intervals in the 1980s; and the 5% IPUMS data from the 2000 Census provided the detailed data for 1990-1994 and 1995-1999. Note that only the 2000 Census includes the multiple race category needed for the historical analysis and projections. Detailed tabulations by race from the 2000 Census for pre-1990 periods of arrival were used to modify the estimates of arrivals for the two or more races group for 1960-1964 through 1985-1990 to conform to the post-2000 race categories using the same procedures described above for the benchmark populations.
ACS data provide information on annual arrivals by race for 2000-2013 with multiple observations on most years. For example each of the 13 years of ACS data has an estimate of immigrants arriving in 2000 whereas only the 2012 and 2013 ACS have information on 2012 arrivals (and. even then, the 2012 ACS covers only part of the year). For the initial estimates of immigrant arrivals covering 2000-2004, 2005-2009 and 2010-2012, we selected the data year with the largest number of arrivals in the race/Hispanic group. Generally, this was the data year with the first full-year accounting of the arrivals; for example, an estimate of arrivals for the full calendar year of 2006 is first available from the 2007 ACS. For calendar year 2013, we estimated full-year arrivals from the partial-year data of the 2013 ACS using average inflation factors for the previous three years (e.g. the ratio of full-year arrivals in 2012 from the 2013 ACS to partial-year arrivals for 2012 observed in the 2012 ACS). For 2014 arrivals, we used the average across 2011-2013.
The final estimates for immigrant arrivals for each of the five-year periods through 2010-2015 were developed from the basic population projection model and the population benchmarks for 1960-2015. The first step involved estimating the foreign-born population for 1970 from the benchmark 1960 population and initial estimates of immigrant arrivals for 1960-1965 and 1965-1970 (approximated by the 1960-64 and 1965-70 arrivals just described), together with estimates of mortality and emigration (see below). This initial estimate of the foreign-born population in 1970 fell short of the 1970 benchmarks for each of the race/Hispanic origin foreign-born groups. The estimates of immigrant arrivals were then adjusted upward for each group by the amount necessary to hit the 1970 benchmarks. This process was repeated using the revised estimate of the 1970 foreign-born population as a base for estimating the 1980 foreign-born population. Comparison of this initial 1980 foreign-born estimate yields adjustment factors for the 1970-1975 and 1975-1980 arrivals of each race/Hispanic origin group. This iterative estimation-adjustment process was repeated for 1980-1990, 1990-2000, 2000-2005, 2005-2010 and 2010-2015. The resulting estimates of total immigrant arrivals for each period (expressed as average annual values) are shown in Figure A1.
These data on five-year arrivals for 1965-1970 through 2010-2015 (plus temporary migrants as described below) are the basis for the estimate of 58.5 million arrivals during 1965-2015 shown in Table 1 of this report. Information by country and region of birth for the entire period was generated from the arrivals in each five-year period classified by country or region of birth and race/Hispanic origin. These detailed tabulations were adjusted to the race/Hispanic origin totals estimated from the iterative fitting process just described. Not all of the 58.5 million arrivals are still in the U.S. in 2015. Using the population projection model, it is possible to estimate how many of these immigrants arriving over the 50-year period were still in the U.S., how many had died and how many had left the country. Of the 58.5 million arrivals, about 10.8 million had emigrated from the U.S. and 4.3 million died. The remaining 43.4 million represent about 97% of the 2015 foreign-born population.
Projected Immigration, 2015-2065
The future levels of immigration assumed for these projections incorporate both short-term and long-term trends. Since the mid-1990s, total immigration flows of Hispanics have declined quite sharply—dropping by more than half from about 950,000 per year to about 425,000 per year. The rate of decrease has slowed substantially, but our short-term projection for 2015-2020, which incorporates annual data for recent years, assumes a slight further decrease to about 355,000.
The other large flows in recent years have been Asian immigrants. Here, the absolute flows increased from about 365,000 per year in the late 1990s to 435,000 for 2010-2015 with most of the increase occurring in recent years. Again, the short-term annual changes point the way to a continuation of this trend so we are projecting an increase to about 485,000 for the 2015-2020 period.
Overall then, our projection for 2015-2020 is about 1.2 million immigrants per year or approximately the same as during the 2010-2015 period.
This projected immigration for 2015-2020 represents about 3.7 new immigrants annually per 1,000 people in the country. Viewed in this way— as a rate, immigration flows are projected to be lower than any time since the early 1970s when average annual immigration of less than 700,000 (Figure A1) represented about 3.3 new immigrants per 1,000 people. Over the long history where U.S. immigration has been measure, going back to 1820, the immigration rate averaged about 4.4 immigrants annually per 1,000 people (Passel and Cohn, 2008).
In the longer-range projections for this report, we took into account the immigration rate over the very long term and over the last 40 years. Further, the projected aging of the U.S. population through 2030 inherent in these projections points to a decrease in the share of the U.S. population in the working ages that would be slowed somewhat with increased immigration flows. Thus, immigration levels after 2020 are projected to increase for the next 10 years at a rate slightly above the population growth rate and then after 2030 to increase by about 1% per year, or a rate equivalent to the overall U.S. growth rate over the last 30 to 50 years. With these assumptions, by 2060-2065, the immigration rate will return to a level slightly below the rates over the last 40 years (4.6 per 1,000 versus 4.8). The average number of immigrants per year will climb from about 1.2 million during 2010-2015 to 1.5 million for 2030-2035 to about 2.0 million in 2060-2065 (Figure A1). The projected percentage increases in immigration flows after 2020 are applied to all race/Hispanic origin groups. Consequently, Asian immigration will continue to be higher than Hispanic immigration, and these two groups will account for a large majority of future immigration flows (Figure A2).
Other Components
In addition to the inflows of immigrants, there are several other much smaller flows that are part of a full demographic model of the U.S. population: net temporary migration (a first-generation flow), net movement from Puerto Rico (a flow into the Puerto Rican-born population), net movement of civilian citizens (a flow into the U.S.-born population) and flows accounting for the U.S. armed forces abroad. Each is treated somewhat differently in both the historic population estimates and the projections.
Temporary migration consists mainly of foreign-born people admitted for temporary residence in the U.S for periods of one year or longer. The two largest groups of temporary migrants are foreign students (mainly in colleges and universities) and guest workers (mostly with advanced degrees of special skills). For this temporary group, there tend to be large numbers entering every year and somewhat smaller numbers leaving. Over the last 25 years (since 1990), about 700,000 more temporary migrants have arrived than departed, representing a net increase in the foreign-born population of about 28,000 per year. In recent years the numbers have been increasing by about 1% per year; this rate of increase is assumed to continue to 2050, at which point the flows are assumed to level off. This temporary flow is dominated by Asians who account for almost three-quarters of net temporary migration since the mid-1990s. This flow is treated as part of the total immigration flow discussed above. (See Passel and Cohn, 2008 for a description of data sources for this population.)
The flow into the population born in U.S. territories is largely Hispanic (almost 90% for 1965-2015) and is dominated by movement between Puerto Rico and the United States. For the historic population estimates, the flow into the Puerto Rican-born population was estimated with the iterative process of adjusting initial estimates (in this case from the Census Bureau’s population estimates) to flows required by the benchmark populations. For 1965-2015, net movement into the Puerto Rican-born population amount to almost 1.6 million people or 30,000 per year. Flows have been much higher recently, especially from Puerto Rico to the U.S. (Cohn, Patten and Lopez, 2014). For the projections, this flow is assumed to increase by about 25% for 2015-2020 (to 190,000) over the 2010-2015 levels. It is assumed to remain at this level for the next five years and then decrease slowly to about 130,000. The assumed decrease is a result largely of projected drops in the number of people in Puerto Rico who might migrate, a trend that is a consequence of past outmigration and very low levels of fertility in Puerto Rico.
The projections shown here are for the population residing in the United States. Members of the U.S. military serving outside the country are not part of the resident population, but they almost all came from the resident population before they were sent abroad. To take this group into account, we use estimates of the U.S. military abroad from the Census Bureau (e.g., U.S. Census Bureau 2014) that are available for our estimate dates (i.e., every five years from 1960 to 2015). The data on the armed forces outside the U.S., which are available by age, sex and race/Hispanic origin, are distributed to generation groups using data on the military population residing in the U.S., which comes from the IPUMS census files. The estimate for the initial estimate date in an interval (e.g., 1960) is added to the population before the demographic component rates are applied; then, the estimated figures for the final estimate date (e.g., 1965) are subtracted to give the resident population at the final estimate date. This procedure is used for the historical estimates and for the projections. In the projections beyond 2015, the size and age-sex-race/Hispanic origin-generation distribution of the military overseas is held constant at the 2015 level—a total of about 275,000.
Two other components—net recruits plus deaths to the armed forces overseas and net movement of civilian citizens—have almost no impact on the estimated or projected population. They represent, on average, less than 5,000 people per year and mainly affect the third-and-higher generation which numbers about 240 million currently. For the projection, values are set to the average over the last 20 years and assumed to change in concert with the third-and-higher generation.
Emigration
Emigration of legal immigrants has proved to be another elusive component of population change. The measures used in the historical analysis incorporate revised measures based on variations of “residual” calculations using successive censuses to incorporate the detailed census figures on the foreign-born population (Passel, 2004, has a detailed description of the estimation methodology), as well as estimates used in previous Pew Research Center projections (Passel and Cohn, 2008) and new Census Bureau research for their population projections (U.S. Census Bureau 2014). The new Census Bureau measures, which rely on repeated estimates of emigration by duration of residence from successive ACS data sets, provide rates of emigration by sex for recent arrivals (less than 10 years in the U.S.) and those with 10 or more years in the U.S., separately for Hispanic and non-Hispanic immigrants.
Because emigration rates for recent arrivals are much higher than for longer-term immigrants, we revised the methods used for Pew Research Center estimates and projections to keep track of immigrant arrival cohorts. First, we divided the foreign-born population at each date into three groups based on duration of residence—those in the U.S. for less than five years, those in the U.S. for five to 10 years and those in the U.S for 10 years of more. To carry the foreign-born population forward for the next five years, we applied mortality and emigration rates to each of these groups. Mortality rates were the same for all three groups, but the emigration rates applied to latter two groups were the lower, long-term emigration rates. The survivors of the groups in the U.S. for five to 10 years and for 10 years or more at the initial date were combined into the group at the final date who had been in the country for 10 years or more. To illustrate with a specific example, the foreign-born in 1980 who had been in the U.S. for five to 10 years came in 1970-1975 and those who had been in the U.S. for more than 10 years had come before 1970; the survivors of these two groups who had not emigrated by 1985 represented the foreign-born population that had come to the U.S. before 1975 or the group who, in 1985, had been in the country for 10 or more years.
The higher short-term emigration rates are applied to the foreign born in the U.S. for less than five years at the initial date (e.g., those in 1980 who had come to the U.S. during 1975-1980 in our example). This group at the end of the estimation period (1985) becomes the group in the U.S. for five to 10 years. The new immigrants who arrive during the estimation interval (1980-1985) also are subject to the higher, short-term emigration rates and become the group with less than five years in the U.S. at the end date (e.g., 1985). This procedure of moving the foreign-born population in each duration-of-residence category to the next one over each five-year period is used in the historic estimates and the projections.
Emigration levels increased steadily for most groups from the early 1960s, when the annual average was about 150,000 through the late 1990s, when it was about 275,000. In large part because of the Great Recession of 2007-2009, emigration rates and emigration levels increased for the 2005-2010 period, especially for the Hispanic population. Overall emigration for the five-year period averaged just under 400,000. The Hispanic emigration rate went up by about 50 percent from 44 per 1,000 during 2000-2005 to 62 per 1,000 for 2005-2010. For 2010-2015, emigration rates dropped slightly and average annual emigration dropped to about 350,000. The number of short-term immigrants (i.e., those with the highest emigration rates) had decreased because of the downturn in new immigration so emigration decreased in absolute numbers.
Going forward from 2015, we applied the Census Bureau’s emigration rates without any adjustments beyond the distribution to more detailed age groups. These rates yielded lower levels of emigration for 2015-2020 (about 220,000 per year) than the levels observed in the historic estimates for 1990 and later. Emigration is projected to increase steadily to about 370,000 per year for the 2060-2065 population because of the increasing size of the foreign-born population and the growth in the number of new immigrants.
Fertility
Historical Fertility, 1960-2015
The fertility patterns used in the historical population estimates are drawn from a number of disparate sources. The overall patterns that emerge are relatively consistent across time. Fertility rates for foreign-born women within a race/Hispanic group are generally higher than rates for U.S.-born women. Generally, rates for second-generation women are between those of immigrant women and third-and-higher generation women.
For most of our analysis, the fertility measure used (and reported here) is the total fertility rate (TFR). TFR is an age-standardized measure that can be interpreted as the average lifetime births per woman. Because we have data over a considerable time period, we can report and analyze the TFR in a given year (i.e., the period TFR) which is the sum of the age-specific birth rates across all women during the year, and the cohort TFR which follows cohorts of women over time throughout their childbearing years. The number of births in a year and over time can be affected both by the level of the TFR and by the underlying age pattern of fertility (e.g., whether childbearing in a cohort is concentrated in younger or older ages). Over time in the U.S., there has been a trend to later childbearing, which is captured by increases in the mean age at which women give birth.
A major source for developing the historic measures of fertility is data from the June Supplements to the CPS, which ask questions on date of birth for the most recent child and number of children ever born. CPS supplements for June 1995 and for even-numbered years for June 1996-2010 permit tabulation of births by age for the full five “generations” we defined initially; the sample sizes are quite small for many of the groups so it is necessary to aggregate some categories across multiple years to compute reliable TFRs. The same June CPS Fertility Supplements collect information on children ever born through 2014. These data permit an assessment of lifetime births (essentially) for cohorts that have reached ages beyond 40. (An earlier CPS fertility supplement in June 1986 has some of the same information, but the sample sizes are quite small for many groups.)
The ACS asks women if they had a birth with in the 12 months before they responded to the survey. These data can be used to estimate fertility rates for foreign-born, Puerto Rican-born and U.S.-born women. Because the ACS has a very large sample size (1% of the US population in 2005 and later), generally reliable age-specific rates and TFRs can be estimated for all race/Hispanic groups, even those seriously underrepresented in the CPS. Finally, census data from 1960-1990 provide information on lifetime births. For 1960 and 1970, data can be developed for the full five-generation categorization of women; for 1980 and 1990, it can be developed for the more restricted three generations as with the ACS. Because the data are available across a 30-year period, it is possible to follow birth cohorts over time and develop estimates of completed lifetime births and some age patterns of fertility.
From these disparate data sources, we pieced together an initial set of period TFRs by race/Hispanic origin and generation for 1960 through 2013. Two other sets of estimates were also available—those from Passel and Edmonston (1994) for 1960-1990 and from Passel and Cohn (2008) for 1960-2005. These combined datasets provided the basic input for the historic analysis of generational fertility.
In developing the final fertility estimates for the historical data, we imposed a number of constraints on the resulting TFRs. First, the total number of births in each five-year period (1960-1965 through 2005-2010) had to agree with totals of registered births from the National Center for Health Statistics—by racial/ethnic group when available. Also, the survivors of births at the end of each estimation period had to agree with the totals for the appropriate age group in the benchmark populations. For example, births during 1960-1965, when survived to 1970, had to agree with the U.S. population ages 5-9 years in the 1970 benchmark; similarly births in 1965-1970 survived to 1970 had to agree with the U.S. population younger than 5 in 1970; births for 2000-2005 had to agree with the U.S. population younger than 5 in the 2005 benchmark population. This agreement with benchmarks was only required for the “first” benchmark; thus, survivors of births for 1960-1965 were not required to agree with the population aged 15-19 in 1980 or 25-29 in 1990. Then, finally, the generational distribution of the surviving births at the first benchmark were required to agree with the estimated mainland-born populations of the second and third-and-higher generations at the first benchmark.
The total fertility rates resulting from of this iterative fitting process are shown for 1965-1970 and 2010-2015 in Table A2. Consistent with other data on births and fertility rates, the estimates show sizeable drops in the TFR for all race/Hispanic groups. The TFR increased for Hispanic immigrant women while other groups showed decreases; this anomalous pattern probably reflects a significant change in composition of Hispanic immigrants between 1970 and 2015 as well as differences in the recency of arrival. In general, second-generation women had lower TFRs than immigrant-women in the same group; by 2010-2015, differences between the second generation and third-and-higher generations were not large and not consistently in one direction. Data for 2005-2010 are not shown, but previous Pew Research Center analyses have documented notable declines in fertility following 2007, with especially large drops among immigrant women (Livingston and Cohn, 2012). These declines appear to have continued past 2010 and are reflected in the historical fertility patterns, especially for Hispanic and Asian immigrant women.
In implementing the multigeneration projection methodology, a “G-matrix” is required to distribute the births of mothers in each generation to a generation for the children. Births to immigrant mothers always go into the second generation, and all births to Puerto Rican-born women go into the Puerto Rican-parentage population. For the second and third-and-higher generations, some births are distributed back to the second generation as a result of cross-generational childbearing of mixed-generation couples made up of first-generation men and second generation or third-and-higher generation women. This matrix is estimated for each race group using data on mixed-generation couples from the Current Population Surveys for 1995–2010. Analysis of the initial G-matrices showed a strong relationship between the percentage of cross-generational births and the relative sizes of the generations. Accordingly, this relationship is built into the historical analyses and prospective projections to allow for dynamic changes in cross-generational marriage patterns.
Projected Fertility, 2015-2065
The overall patterns of fertility for the projections are driven by the initial values for 2010-2015 and a set of assumed “ultimate” fertility values for 2060-2065. The basic assumption is an overall convergence of fertility levels across generations and race/Hispanic groups. The ultimate values cluster around 1.9 children per woman. Immigrant women are assumed to have slightly higher ultimate rates (by about 0.1-0.2 children per woman). Hispanic immigrants are assumed to continue to have higher fertility but their TFR is projected to drop from about 3.3 to 2.3 lifetime births. Asian women tend to have lower project fertility with third-and-higher generation women having a projected TFR of 1.7; note that this implies an increase from their estimated fertility level in 2010-2015 of 1.6.
The age patterns for current and ultimate fertility are drawn from the recent Census Bureau (2014) projections that show differential age patterns over time and across groups. Once the initial and ultimate levels and patterns were determined, the intermediate projected fertility rates were developed by imposing smooth trends on cohorts, not on the time period TFRs. The cohorts reaching 25-29 in 2065-2070 (i.e., women born in 2040-2045) are assumed to have the ultimate level and age-pattern of fertility for their race/Hispanic origin group. Fertility projections were developed for 30 groups of women (five generations for six race/Hispanic groups). Some groups have increasing TFRs; others, decreasing; and a few, relatively constant. Notwithstanding the complex pattern of changes assumed, the TFR for the total population stays within a very narrow range, going from 1.89 in 2010-2015 to 1.90 for 2060-2065, and never exceeding 1.96.
Mortality
Survival rates by age, sex and race/Hispanic origin are drawn directly from recent Census Bureau (2014) population projections and official life tables for 1959-61 through 2010. The Census Bureau projections provide estimates of projected deaths (by single year of age for males and females) for every year from 2014 through 2060 for race/Hispanic groups that correspond well with those in the Pew Research Center projections—Hispanics; non-Hispanics for single race white; single races for black, Asian, Native Hawaiian and other Pacific Islanders and American Indians and Alaska Natives; and for people of two or more races. In addition, the projected populations corresponding to the projected deaths are available for the same groups by single ages and sex for every year through 2060.
From the death and population data, we constructed full life tables for every year; then we condensed them to abridged life tables. From these life tables, we estimated five-year survival rates for five-year age groups with standard life table methods. For the first nine five-year periods in our projections (e.g., 2015-2020 through 2055-2060), five-year survival rates were derived by averaging the rates from the starting year and the final year (e.g., 2015 and 2020 for the 2015-2020 period). For our final projection interval (2060-2065), the rates from the 2060 life table were used. In applying the rates from the Census Bureau life tables, the Hispanic and non-Hispanic white rates were applied to those groups in the projections; for the other groups of non-Hispanics in the projection, the rates for the full group (including Hispanics) from the Census Bureau-based life tables were used.
For the historic period of 1960 through 2015, not as much race/Hispanic origin detail is available in the mortality data. For 2014 and 2015, the Census Bureau projections provide the full detail just described. Official life tables for Hispanics are only available for 2006 and later; similarly, life tables for non-Hispanic whites and blacks only cover 2006 and later. There are no official life tables for Asians, American Indians and Alaska Natives or the two or more races population for any of the years. For years where life tables for Hispanics are not available, survival rates for whites and blacks are assumed to apply to the non-Hispanic single-race populations of whites and blacks, respectively; for these same years, survival rates for whites are assumed to apply to Hispanics. When Asian or two or more races populations are not available (i.e., all years before 2014), survival rates from the white population (non-Hispanic, if available) are assumed to apply to the Asian and two or more races populations. For the American Indian and Alaska Native population, survival rates for the group labeled “other than white” are assumed to apply.
The final step in the process of deriving the five-year survival rates involves developing those estimates for specific years and then averaging across the years to get rates applicable to the projection intervals. For 1960, rates were developed from the U.S. Life Tables: 1959-61 (NCHS, 1964); for 1970, from United States Life Tables: 1969-71 (NCHS, 1975); for 1980, from U.S. Decennial Life Tables for 1979-81 (NCHS, 1985); for 1990, from U.S. Decennial Life Tables for 1989-91 (NCHS, 1997); for 2000, from U.S. Decennial Life Tables for 1999-2001 (NCHS, 2008), for 2005, from United States Life Tables by Hispanic Origin (NCHS, 2010 ); and for 2010, from United States Life Tables, 2010 (NCHS, 2014. (Note that the survival rates from the 2006 life tables are assumed to apply to2005 in the estimation process.) For each interval in the historic estimates, survival rates were estimated by averaging the nearest surrounding life tables. So, for 1960-1965, the estimated survival rates were weighted average of the relevant 1960 rates (with a weight of 3.0) and the 1970 rates (with a weight of 1.0); for 1965-1970, the same rates were averaged, but the weights reversed. Finally, for 2010-2015, the survival rates for 2015 from the Census Bureau projections were averaged with the rates from the 2010 official life tables.
Estimates of life expectancies at birth from the averaged life tables used in the population estimates and projections are shown in Table A3. There are large improvements for all groups between 1965-1970 and 2010-2015—nine to 12 years for men and six to 10 years for women. Between 2010-2015 and 2060-2065, all groups show improvements in life expectancy at birth, but not generally as large as the gains over the preceding 50 years. For men, life expectancies improve by another five to nine years and for women, three to seven years. By 2060-2065, female life expectancy at birth is in a range of 85-88 years; for men, the range is 81-84 years.
Contributions to Population and Growth
The contribution of immigration to population growth goes beyond just the numbers of immigrants added to the population because once the immigrants have arrived in the country, they tend to have children in the U.S. In the long run, the immigrants themselves will die, but their U.S.-born offspring will multiply, having children themselves, grandchildren, and subsequent generations. The use of a population projection methodology permits measurement of future contributions of immigrants to population growth as well as an assessment of the role of past immigration in population change.
In measuring the contribution of future immigration to the projected population in 2065 (or any other future date), an alternative population projection is carried out by setting future immigration (after 2015) to zero. In these projections, there are two components of immigration—total immigration, consisting of combined legal and unauthorized immigration, and net temporary migration—that are set to zero. With this assumption, not only are no future immigrants added to the population, there is no other contribution from these immigrants to population change through future births, deaths, or emigration because all of these components are computed by applying rates to the population. The difference between the “zero immigration” projection and the baseline projection represents the contribution of future immigrants to future population change at any future date. (To isolate the “pure” impact of future immigration, the G-matrices used to allocate births across generations are not allowed to vary dynamically but are fixed at the values of the baseline projection.)
Following the work of Passel and Cohn (2008) and Passel and Edmonston (1994), this same methodology can be used to assess the contribution of past immigration to past population change because the time series of historical population estimates was developed with the population projection methodology. Thus, past immigration can be set to zero to estimate what would have happened in the past had there been no immigrants during the 1965–2015 period or during any other historical interval. This methodology works because the time series of population change has been constructed with rates of fertility, mortality, and emigration rather than past numbers of births, deaths, and emigrants. (Again, the G-matrix values are fixed at the values from the historical benchmark population estimates.)
Recent Arrivals: Data Sources
Most of the analysis in this chapter is based on the 1970 to 2000 decennial census public use files and the 2007 and 2013 American Community Survey (ACS) public use files. The ACS is an ongoing survey that was developed by the Census Bureau to provide decennial census information on an annual basis. The ACS questionnaire is similar to the 2000 census questionnaire, with some added questions, and information collected by the ACS is consistent with the earlier decennial censuses.
The public use files utilized are the Integrated Public Use Microdata Series provided by the University of Minnesota Population Center. Documentation can be found at https://usa.ipums.org/usa/.
The 1980, 1990 and 2000 files used are the 5% samples. For 1970, six independent 1% samples are available. However, critical information on citizenship status (needed to identify if the person is foreign born) is available only in the Form 1 samples. So the 1970 file used is a 3% sample. The ACS files are 1% samples.
Recent Arrivals
For foreign-born persons who arrived within five years of the census or survey date, all the observations were utilized. Since the U.S.-born population is much larger, random subsamples of U.S.-born respondents were used to expedite processing times. For 1970, a 1% sample of the U.S.-born population was used. For 1980, 1990 and 2000, a 0.5% subsample of U.S.-born respondents was employed. All the U.S.-born respondents from the ACS samples were included in the analysis. The population weights were adjusted to reflect the subsampling, and all the published figures are weighted. The unweighted sample sizes used in the tabulations are as follows:
The following table shows the countries included in each of the six regions of birth:
Educational Attainment
In 1990, the Census Bureau redesigned the question on educational attainment. Until 1990, the question ascertained the highest year of school completed. Since 1990, years of school completed is available only for those who have not completed high school. For persons who have at least completed high school, the questionnaire queries as to the highest degree completed.
Before 1990, the number of years of college completed beyond four is available but the question did not query whether the respondent completed an advanced degree, so information on graduate degrees is not comparable before and after 1990.
To bridge the education questions over time, standard practice is employed, and respondents before 1990 who have completed 12 years of schooling are assumed to have completed high school. Respondents who have completed four years of college are assumed to have finished at least a bachelor’s degree. Persons indicating that they attended less than one to three years of college are assigned to those who completed at least some college or a two-year degree. For more details, see https://usa.ipums.org/usa-action/variables/EDUC#comparability_section.
Survey Data: The American Trends Panel Surveys
The American Trends Panel (ATP), created by the Pew Research Center, is a nationally representative panel of randomly selected U.S. adults living in households. Respondents who self-identify as internet users (representing 89% of U.S. adults) participate in the panel via monthly self-administered Web surveys, and those who do not use the internet participate via telephone or mail. The panel is being managed by Abt SRBI.
Data in this report are drawn from the March wave of the panel, conducted March 10-April 6, 2015 in English and Spanish among 3,147 respondents (2,833 by Web and 314 by mail). The margin of sampling error at the 95% confidence level for the full sample of 3,147 respondents is plus or minus 2.4 percentage points.
All current members of the American Trends Panel were originally recruited from the 2014 Political Polarization and Typology Survey, a large (n=10,013) national landline and cellphone random digit dial (RDD) survey conducted from Jan. 23 to March 10, 2014, in English and Spanish. At the end of that survey, respondents were invited to join the panel. The invitation was extended to all respondents who use the internet (from any location) and a random subsample of respondents who do not use the internet.26
Of the 10,013 adults interviewed, 9,809 were invited to take part in the panel. A total of 5,338 agreed to participate and provided either a mailing address or an email address to which a welcome packet, a monetary incentive and future survey invitations could be sent. Panelists also receive a small monetary incentive after participating in each wave of the survey.
The ATP data were weighted in a multistep process that begins with a base weight incorporating the respondents’ original survey selection probability and the fact that some panelists were subsampled for invitation to the panel. Next, an adjustment was made for the fact that the propensity to join the panel and remain an active panelist varied across different groups in the sample. The final step in the weighting uses an iterative technique that matches gender, age, education, race, Hispanic origin and region to parameters from the U.S. Census Bureau’s 2013 American Community Survey. Population density is weighted to match the 2010 U.S. Decennial Census. Telephone service is weighted to estimates of telephone coverage for 2014 that were projected from the July-December 2013 National Health Interview Survey. It also adjusts for party affiliation using an average of the three most recent Pew Research Center general public telephone surveys, and for internet use using as a parameter a measure from the 2014 Survey of Political Polarization. Sampling errors and statistical tests of significance take into account the effect of weighting. The Hispanic sample in the American Trends Panel is predominantly U.S. born and English-speaking.
In addition to sampling error, one should bear in mind that question wording and practical difficulties in conducting surveys can introduce error or bias into the findings of opinion polls.
The Web component of the March wave had a response rate of 78% (2,833 responses among 3,634 Web-based individuals enrolled in the panel); the mail component had a response rate of 61% (314 responses among 512 non-Web individuals enrolled in the panel). Taking account of the response rate for the 2014 Survey of Political Polarization (10.6%) and attrition from panel members who were removed at their request or for inactivity, the cumulative response rate for the March ATP wave is 3.4%.27
Statistical Portrait: Data Sources
The statistical profile of the foreign-born population in the 50 states and the District of Columbia is based on Pew Research Center tabulations of the Census Bureau’s 2010 and 2013 American Community Survey (ACS) and the 1960-2000 decennial censuses.
The ACS is the largest household survey in the United States, with a sample of more than 3 million addresses (http://www.census.gov/acs/www/methodology/sample_size_data/index.php). It covers the topics previously covered in the long form of the decennial census. The ACS is designed to provide estimates of the size and characteristics of the resident population, which includes persons living in households and group quarters. For more details about the ACS, including the sampling strategy and associated error, see the 2010 or 2013 American Community Survey’s Accuracy Statement provided by the U.S. Census Bureau: http://www.census.gov/acs/www/data_documentation/documentation_main/.
The specific data sources for this statistical profile are the 1% samples of the 2010 and 2013 ACS Integrated Public Use Microdata Series (IPUMS) provided by the University of Minnesota, the 5% samples of the 1980-2000 decennial censuses, a merged 3% sample of the 1970 decennial census (Form 1), and the 1% samples of the 1960 decennial census. The IPUMS assigns uniform codes, to the extent possible, to data collected by the decennial census and the ACS from 1850 to 2013. For more information about the IPUMS, including variable definition and sampling error, please visit http://usa.ipums.org/usa/design.shtml.
Due to differences in the way in which the IPUMS and Census Bureau adjust income data and assign poverty status, data provided on these topics might differ from data on these variables that are provided by the Census Bureau.
For the purposes of this statistical portrait, the foreign born include those persons who identified as naturalized citizens or non-citizens and are living in the 50 states or the District of Columbia. Persons born in Puerto Rico and other outlying territories of the U.S. and who are now living in the 50 states or the District of Columbia are included in the U.S.-born population.