
Pew Research Center

FOR RELEASE MARCH 26, 2015

Share of Unauthorized Immigrant Workers in Production, Construction Jobs Falls Since 2007

In States, Hospitality, Manufacturing and Construction Are Top Industries

BY Jeffrey S. Passel and D’Vera Cohn

FOR MEDIA OR OTHER INQUIRIES:

Communications Department
202.419.4372
www.pewresearch.org

RECOMMENDED CITATION

Pew Research Center, March 2015, "Share of Unauthorized Immigrant Workers in Production, Construction Jobs Falls Since 2007"

About Pew Research Center

Pew Research Center is a nonpartisan, nonadvocacy fact tank that informs the public about the issues, attitudes and trends shaping the world. It does not take policy positions. The Center conducts public opinion polling, demographic research, computational social science research and other data-driven research. It studies politics and policy; news habits and media; the internet and technology; religion; race and ethnicity; international affairs; social, demographic and economic trends; science; research methodology and data science; and immigration and migration. Pew Research Center is a subsidiary of The Pew Charitable Trusts, its primary funder.

© Pew Research Center 2026

Table of contents

  • About Pew Research Center
  • Share of Unauthorized Immigrant Workers in Production, Construction Jobs Falls Since 2007
  • Chapter 1: Occupations of Unauthorized Immigrant Workers
  • Chapter 2: Industries of Unauthorized Immigrant Workers
  • Appendix A: State Maps and Tables
  • Appendix B: Additional National Tables and Chart
  • Appendix C: Methodology

Share of Unauthorized Immigrant Workers in Production, Construction Jobs Falls Since 2007

In States, Hospitality, Manufacturing and Construction Are Top Industries

In a reflection of changes in the overall economy since the Great Recession, the U.S. unauthorized immigrant workforce now holds fewer blue-collar jobs and more white-collar ones than it did before the 2007-2009 recession, but a solid majority still works in low-skilled service, construction and production occupations, according to new Pew Research Center estimates.

The size of the unauthorized immigrant labor force did not change from 2007 to 2012, but its makeup shifted slightly. The number of unauthorized immigrants in management or professional related jobs grew by 180,000, while the number in construction or production jobs fell by about 475,000, mirroring rises and declines in the overall U.S. economy. The share of all unauthorized immigrant workers with management and professional jobs grew to 13% in 2012 from 10% in 2007, and the share with construction or production jobs declined to 29% from 34%.

Despite these shifts, unauthorized immigrant workers remain concentrated in lower-skill jobs, much more so than U.S.-born workers, according to the new estimates, which are based on government data. In 2012, 62% held service, construction and production jobs, twice the share of U.S.-born workers who did. The 13% share with management or professional jobs is less than half of the 36% of U.S.-born workers in those occupations.
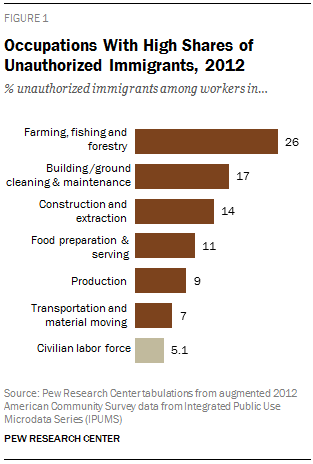
Occupations With High Shares of Unauthorized Immigrants, 2012

Unauthorized immigrants made up 5.1% of the nation’s labor force in 2012, numbering 8.1 million who were working or looking for work, according to previously published Pew Research estimates (Passel and Cohn, 2014). But as this new analysis shows, they account for a far higher share of the total workforce in specific jobs, notably farming (26%), cleaning and maintenance (17%), and construction (14%).

The unauthorized immigrant share of the work force peaked at 5.4% in 2007, when the two-year Great Recession began.

The number in the labor force has ranged from 8.1 million to 8.3 million since 2007. The relative stability of the size of the unauthorized immigrant labor force since 2007 contrasts with a marked decline in the overall U.S. unauthorized immigrant population, which peaked at 12.2 million in 2007, dropped through 2009 and stabilized after that, to total 11.2 million in 2012 (Passel and Cohn, 2014).

The unauthorized immigrant share of the workforce varies markedly by state; states with higher unauthorized immigrant populations also tend to have higher shares of unauthorized immigrants in the labor force. The states whose labor forces have the highest shares of unauthorized immigrants are Nevada (10.2% in 2012), California (9.4%) and Texas (8.9%) (Passel and Cohn, 2014).

Occupation and Industry: What’s the Difference?

This report on the unauthorized immigrant workforce includes estimates about occupation, which is the kind of work that people do on the job, as well as about industry, which is the kind of business conducted by an employing organization.

Some occupation groups are similar to industry categories—for example, many construction workers are employed in the construction industry. The construction industry, however, also employs people in many other occupations, such as manager, clerk, etc.

The Census Bureau obtains data on occupation and industry from responses to write-in and check-box questions; the responses are coded using a standard classification system.

The new Pew Research Center analysis also shows that in most states—39, plus the District of Columbia—the largest number of unauthorized immigrant workers are found in service occupations, which include maids, cooks or groundskeepers.1 Construction and production occupations also have large representation of unauthorized immigrant workers in many states, according to the new Pew Research analysis. However, when looking at the occupation in which unauthorized immigrant employees are the highest share of the workforce, in most states, it is farming.2

There is more variation among states in the industries that employ the most unauthorized immigrants. Leisure and hospitality is the largest industry among unauthorized immigrant workers in 14 states and the District of Columbia, generally in the West or Northeast, as well as Florida. In 11 states, which tend to be in the South, the construction industry employs more unauthorized immigrants than any other. Manufacturing is the dominant employer of this group in 11 states, largely in the Midwest.

See the appendix for tables that show the top occupations (Table A1) and industries (Table A3) for unauthorized immigrants in each state.

In 2012, unauthorized immigrants accounted for 3.5% of the U.S. population and 26% of all immigrants. Unauthorized immigrants make up a larger share of the labor force than of the overall population. A key reason for that is that they are more likely than the overall U.S. population to be of working age, and less likely to be young or older (Passel and Cohn, 2009).

Previous work by the Pew Research Center has found that unauthorized immigrants are far less educated, on average, than legal immigrants or the U.S.-born; they are both more likely not to have graduated high school and less likely to have attended college. That, and limits due to their status, helps explain their concentration in low-skilled occupations (Passel and Cohn, 2009).

The unauthorized immigrant estimates throughout this report are produced using a multistage method that subtracts the legal foreign-born population from the total adjusted foreign-born population; the residual then is used as the source of information about unauthorized immigrants.

The main source of data for estimates since 2005 is the U.S. Census Bureau’s American Community Survey; estimates for 1995 and 2000 use the bureau’s March Current Population Survey.

This report includes two chapters, four maps and detailed appendix tables. The first chapter analyzes the occupations of unauthorized immigrants, compares them with those of U.S.-born workers, examines trends from 2007 to 2012, and discusses differences in dominant occupations by state. The second chapter does the same for industries in which unauthorized immigrants work. Accompanying this report is written testimony by Jeffrey S. Passel, senior demographer, for a March 26, 2015, hearing of the U.S. Senate Committee on Homeland Security and Governmental Affairs.

About This Report

This report provides estimates of the 2012 unauthorized immigrant workforce in the United States, by occupation and industry category, as well as trends since 2007. It provides some comparisons with industry and occupation categories of U.S.-born and legal immigrant workers. The report also includes 2012 estimates of the occupation and industry categories of unauthorized immigrant workers for 43 states and the District of Columbia. In addition to the text, there are extensive appendix tables with detailed data, as well as four maps.

This report was written by Jeffrey S. Passel, senior demographer, and D’Vera Cohn, senior writer. Editorial guidance was provided by Claudia Deane, vice president, research; and Mark Hugo Lopez, director of Hispanic research. Renee Stepler, research assistant, created charts and tables. Michael Keegan, information graphics designer, created the maps. Eileen Patten, research analyst, number-checked the graphics and text. Molly Rohal copy edited the report. All are on the staff of the Pew Research Center.

The estimates shown in this report use the “residual method,” a widely accepted and well-developed technique based on official government data for estimating the size and characteristics of the nation’s unauthorized immigrant population. The data come mainly from the American Community Survey, conducted by the Census Bureau. For more detail, see Methodology.

Find related reports online at pewresearch.org/pewresearch-org/hispanic.

A Note on Terminology

“Foreign born” refers to an individual who is not a U.S. citizen at birth or who, in other words, is born outside the U.S., Puerto Rico or other U.S. territories and whose parents are not U.S. citizens. The terms “foreign born” and “immigrant” are used interchangeably. “U.S. born” refers to an individual who is a U.S. citizen at birth, including people born in the United States, Puerto Rico or other U.S. territories, as well as those born elsewhere to parents who are U.S. citizens.

The “legal immigrant” population is defined as people granted legal permanent residence; those granted asylum; people admitted as refugees; and people admitted under a set of specific authorized temporary statuses for longer-term residence and work. This group includes “naturalized citizens,” legal immigrants who have become U.S. citizens through naturalization; “legal permanent resident aliens” who have been granted permission to stay indefinitely in the U.S. as permanent residents, asylees or refugees; and “legal temporary migrants” (including students, diplomats and “high-tech guest workers”) who are allowed to live and, in some cases, work in the U.S. for specific periods of time (usually longer than one year).

“Unauthorized immigrants” are all foreign-born non citizens residing in the country who are not “legal immigrants.” These definitions reflect standard and customary usage by the U.S. Department of Homeland Security and academic researchers. The vast majority of unauthorized immigrants entered the country without valid documents or arrived with valid visas but stayed past their visa expiration date or otherwise violated the terms of their admission. Some who entered as unauthorized immigrants or violated terms of admission have obtained work authorization by applying for adjustment to legal permanent status, obtaining Temporary Protected Status (TPS) or receiving Deferred Action for Childhood Arrivals (DACA) status. This “quasi-legal” group could account for as much as 10% of the unauthorized population. Many could also revert to unauthorized status.

The “labor force” refers to people ages 16 and older who are employed or looking for work. “Workforce” is used interchangeably with labor force. Similarly, when there is analysis of estimates for occupations, “occupation” and “job” are used interchangeably. And for industries, “industry” and “sector” are used interchangeably.

The occupation and industry category titles used throughout the report have been shortened for display purposes. The full list is included in the Methodology appendix.

Chapter 1: Occupations of Unauthorized Immigrant Workers

In 2012, fully a third of U.S. unauthorized immigrants in the workforce (33%) held service jobs such as janitor, child care worker or cook, nearly double the share of U.S.-born workers (17%) in those types of occupations. An additional 15% hold construction or extraction jobs (mainly construction), triple the share of U.S.-born workers who hold that type of employment. Overall, 11%, compared with 6% of U.S.-born workers, are employed in production jobs, which include manufacturing, food processing and textile workers, among others.

Among major occupational categories, unauthorized immigrant workers are less likely than U.S.-born workers to hold management or professional jobs, which tend to be higher paid. Only 5% hold management jobs, compared with 15% of U.S.-born workers. Some 7% are employed in professional occupations, compared with 21% of U.S.-born workers. Unauthorized immigrants also are less concentrated in sales jobs or in office and administrative support jobs. Some 7% of unauthorized immigrants hold sales jobs, compared with 12% of U.S.-born workers; 6% hold office and administrative support jobs, compared with 15% of U.S.-born workers.

Because they are concentrated in certain types of jobs, unauthorized immigrants represent a higher share of workers within some occupations, especially blue-collar work, than their 5% share of the overall workforce. For example, in 2012, they were 26% of workers in farming, fishing and forestry occupations, mainly working in agricultural occupations. They are 14% of construction and extraction workers and 9% of workers in production and service jobs. However, they are only 2% of workers in management, professional and office support occupations.

Unauthorized immigrant workers hold an especially high share of jobs in subsets of some detailed occupations, in some cases outnumbering legal immigrants, though not U.S.-born workers. These occupations include drywall installers (where 34% of job-holders were estimated to be unauthorized immigrants in 2012), maids or housekeeping cleaners (25%) and construction painters (24%).

See the appendix for tables on unauthorized immigrants in major occupation groups (Table B1), and detailed occupations (Table B2).

Trends in Major Occupations

The number of unauthorized immigrants working in the three largest occupations—construction, production and service—increased from 1995 to 2007, but the total either leveled off or declined after that.

Among construction workers, the number of unauthorized immigrants declined from 1.6 million in 2007 to 1.2 million in 2012 (a 23% decline), a period in which total U.S. construction employment fell to from 9.9 million to 8.5 million (a 15% decline). Unauthorized immigrants rose from 5% of all construction workers in 1995 to 9% in 2000 before peaking at 16% in 2007 and 2008. The share bumped downward to 14% in 2012.

In production jobs, which include assemblers, food processors, machinists, power plant operators and garment workers, the number of unauthorized immigrants grew from about 750,000 in 1995 to 975,000 in 2007, then declined to 875,000 in 2012 (an 11% decrease). The nation’s total production jobs declined to 9.5 million from 10.2 million from 2007 to 2012(a 7% decrease). The unauthorized immigrant share of the total production workforce grew from 6% in 1995 to 10% in 2007, before levelling off at 9% in 2012.

The number of unauthorized immigrant workers holding service jobs changed little (2% increase), but unauthorized immigrants became a smaller share of the service job workforce between 2007 and 2012 because the total number of U.S. service jobs rose, to 29 million from 26 million (a 12% increase). The unauthorized immigrant share of the total workforce in service jobs grew from 6% in 1995 to 10% in 2007, before levelling off at 9% in 2012.

For farming jobs, a sharp rise in the unauthorized immigrant share of these occupations—from 5% of the total in 1995 to 27% in 2007—also ended, and there was little change in this group’s share of farming jobs by 2012 (26%). The number of unauthorized immigrants in farming jobs, about 325,000 in 2012, rose only 2% from 2007 to 2012. Total employment in farming jobs rose by 6% from 2007 to 2012, to 1.2 million.

State Occupation Patterns

This report includes estimates of the number of unauthorized immigrant workers by occupation in 43 states and the District of Columbia where there are enough unauthorized immigrants in the workforce to provide reliable estimates.

Service occupations are the top job category for unauthorized immigrants in most states. In 39 states and the District of Columbia, service occupations have the largest number of unauthorized immigrants (and share of the unauthorized immigrant workforce in those jobs). Overall, service occupations make up 19% of the total U.S. workforce and 33% of the unauthorized immigrant workforce nationwide. Construction and production occupations—which account for 5% and 6%, respectively, of the total U.S. workforce—also have large representation of unauthorized immigrant workers in many states.

However, unauthorized immigrants represent the largest share of the total workforce in farming occupations in most states. In 34 states, the occupation in which unauthorized immigrants are the largest share of the workforce is farming, fishing and forestry. Nationally, 26% of the farming workforce consists of unauthorized immigrants, the highest share among occupation categories. Because farming jobs employ less than 1% of the total U.S. workforce, compared with the larger shares employed in occupations such as service and construction, there are few states where agricultural occupations account for a significant share of the total unauthorized immigrant workforce.

Chapter 2: Industries of Unauthorized Immigrant Workers

Unauthorized immigrants are more likely than U.S.-born workers to be employed in industries that offer low-skilled jobs, due in part to their relatively low education levels and to limits of their status. Of all unauthorized immigrant workers, 22% are in professional, business and other services, which encompasses a wide range of businesses from legal services and advertising, to employment services, landscaping and waste management, to personal services such as dry cleaning, nail salons, car washes and religious organizations.3 Some 18% are in the leisure and hospitality sector, and 16% are in the construction industry. More than half (55%) of unauthorized immigrant workers are employed in these three sectors, compared with only 31% of U.S.-born workers.

Although only 5% of unauthorized immigrant workers are employed in agriculture, that is more than double the share of U.S.-born workers (2%) who are. The 13% of unauthorized immigrant workers employed in the manufacturing industry compares with 10% of U.S.-born workers employed there.

Industries With High Shares of Unauthorized Immigrants, 2012

Although wholesale and retail trade employs 12% of unauthorized immigrant workers, that share is somewhat lower than for U.S.-born workers (15%). Unauthorized immigrants are far less likely than U.S.-born workers to be employed in a broad group of industries that includes education and health services, finance, information and public administration (12% vs. 37%).

Although they were 5% of the overall workforce in 2012, unauthorized immigrants represent a notably higher share of workers in some industries where they are concentrated. They were 16% of employees in the agriculture industry, 12% of employees in the construction industry and 9% of employees in the leisure and hospitality industry.

Unauthorized immigrants are particularly concentrated in some subsets of each major industry. In 2012, they represented 24% of workers in the landscaping industry, 23% of those in private household employment, 20% of those in apparel manufacturing, 20% in crop production, 19% in the dry cleaning and laundry industry and 19% of those in building maintenance.

See the appendix for tables on unauthorized immigrants by major industries (Table B3) and detailed industries (Table B4).

Trends in Major Industries

In a change from an earlier pattern of sharp increase, the number of unauthorized immigrants working in the construction sector and manufacturing industry fell from 2007 to2012.

The number of unauthorized immigrant workers in the construction industry declined, to 1.3 million in 2012 from 1.6 million in 2007, after rising from about 350,000 in 1995. Total U.S. construction industry employment also fell from 2007 to 2012, though at a slower rate than among unauthorized immigrants (16% vs. 24% decrease). As was the story in construction jobs, the construction industry had a decline in the share of its workforce consisting of unauthorized immigrants, to 12% in 2012 from 14% in 2007. The share was only 4% in 1995.

The number of unauthorized immigrants working in the manufacturing industry declined, to 1 million in 2012 from 1.1 million in 2007 (an 8% decrease), after rising from about 775,000 in 1995. The industry’s overall employment also declined, by 5%, from 2007 to 2012. Unauthorized immigrants made up 6% of the manufacturing industry workforce in 2012, statistically unchanged from 2007. The share was 4% in 1995.

State Industry Patterns

The industry concentrations of unauthorized immigrants vary across the states, depending, in part, on the countries of origin of the immigrants and the nature of each state’s economy.4

The leisure and hospitality industry has the most unauthorized immigrant workers in 14 states and the District of Columbia, construction does in 11 states and manufacturing does in 11 states. The states where leisure and hospitality is the largest sector for unauthorized immigrants tend to be in the West or Northeast (plus, not surprisingly, Florida). The states where manufacturing is the largest tend to be in the Midwest, and the construction-dominated states tend to be in the South. (Appendix Table A3 shows the largest three major industries in each state together with the share of the state’s unauthorized immigrant workers in the industry.)

Looked at another way—using the unauthorized immigrant share of each industry’s workforce—the picture of industry concentration changes somewhat.

In almost half of the states (21 of 43), agriculture is the industry with the largest share of total workers who are unauthorized immigrants; in 10 other states, agriculture is the industry with the second largest share of workers who are unauthorized immigrants. These 31 states are spread across all regions of the country. The agriculture industry ranks first in this regard in every Western state for which data are available, except Alaska and Nevada; in Nevada, it ranks second, behind construction.

The construction industry is also one where the share of workers who are unauthorized immigrants tends to be high (first in 10 states and the District of Columbia, second in 15 and third in nine). The states where the construction industry workforce has the largest share of unauthorized immigrants tend to be in the South. (Appendix Table A4 shows the three major industries in each state that have the largest shares of their workers who are unauthorized immigrants.)

Appendix A: State Maps and Tables

Occupations with Highest Shares of Unauthorized Immigrant Workers, by State, 2012
Top Industries for Unauthorized Immigrants, by State, 2012
Industries with Highest Shares of Unauthorized Immigrant Workers, by State, 2012
Top Occupations for Unauthorized Immigrants, by State, 2012
Occupations with Highest Shares of Unauthorized Immigrant Workers, by State, 2012
Top Industries for Unauthorized Immigrants, by State, 2012
Industries with Highest Shares of Unauthorized Immigrant Workers, by State, 2012
Estimates of Unauthorized Immigrants in the Total Population, Labor Force and Foreign-Born Population, by State, 2012

Appendix B: Additional National Tables and Chart

Detailed Occupations with Highest Shares of Unauthorized Immigrant Workers, 2012
Major Industry Groups, by Nativity and Status, 2012
Detailed Industries with Highest Shares of Unauthorized Immigrant Workers, 2012
Unauthorized Immigrants in the U.S. Labor Force, 1995-2012

Appendix C: Methodology

The unauthorized immigrant estimates throughout this report are produced using a multistage method that subtracts the legal foreign-born population from the total adjusted foreign-born population; the residual then is used as the source of information about unauthorized immigrants. The main source of data for estimates from 2005 on is the Census Bureau’s American Community Survey; estimates for 1995 and 2000 use the bureau’s March Current Population Survey. See Passel and Cohn 2014 for more detail.

The labor force includes all people ages 16 and older who are working or looking for work. For the analyses of occupations and industries, we exclude people who did not report an occupation or industry; this exclusion drops about 2.8 million people from the analysis out of a total labor force of roughly 160 million. About 170,000 unauthorized immigrants in the workforce did not report an occupation or industry. People in the military or with a military occupation are also excluded (about 1 million people total, but no unauthorized immigrants). This civilian labor force with reported occupations or industries, about 156 million in total with 7.9 million unauthorized immigrants, is used in computing the shares reported.

Rounding of Estimates. All estimates for immigrant populations, legal and unauthorized, are presented as rounded numbers to avoid the appearance of unwarranted precision in the estimates. The rounding conventions for immigrant estimates, dependent somewhat on data sources, are:

State and national data for the total and U.S.-born populations are rounded to the nearest 10,000. Unrounded numbers are used for significance tests, for plotting charts and for computations of differences and percentages. Where differences are reported, they are computed from unrounded estimates and then rounded separately. Because each figure is rounded separately, the rounded estimates may not add to rounded totals. Similarly, percentages computed from rounded numbers may differ from the percentages shown in this report.

Industry and Occupation Category Labels.

The Census Bureau has three different levels of aggregation each for industry and occupation. At the highest level, there are 12 classifications for “Major Occupation” groups (11 for civilians, plus the Armed Forces). At the next level, there are 23 “Detailed Occupation” groups, but eight of them are identical to the “Major” groups; the three major occupation groups for management, professional and service occupations are subdivided into 15 smaller, detailed groups. Finally, there are a large number of very specific occupation categories–almost 600—which can be grouped into either the “Detailed” or “Major” groups. So, for example, the code for “Aerospace engineers” (1320) is part of the detailed category for “Architecture and engineering occupations” which, in turn, is part of the major category of “Professional and related occupations.”

For industries, the highest level has 14 “Major Industry” groups (13 for civilians and one for the Armed Forces). At the next level, there are 52 “Detailed Industry” groups. Unlike with occupations, only four of the Major groups are identical to “Detailed” groups. Finally, there are 273 very specific industry categories that can be grouped into either the “Detailed” or “Major” groups. So, for example, the industry called “Retail bakeries” (code 1190) is part of the detailed category for “Food manufacturing” which, in turn, is part of the major category of “Manufacturing.”

For ease of presentation, the full titles of many industry and occupation categories have been condensed from the Census Bureau’s terminology. Data on what are called “major” industry categories are shown in Tables A3, A4 and B3, as well as in some figures in the text. Table B3 includes the full names of the industry categories, but in Tables A3 and A4 and the text, they are shortened as follows:

Data on “major” occupation categories are shown in Tables A1, A2 and B1, as well as in some figures in the text. Table B1 includes the full names of the industry categories, but in Tables A1 and A2 and the text, they are shortened as follows:

The specific, detailed categories for industries and occupations used in Tables B2 and B4 are not condensed. References in the text, text charts and tables can be cross-referenced to the lists above.

More information on the Census Bureau’s industry and occupation categories can be found here: http://www.census.gov/people/io/.