Unauthorized Immigrant Totals Rise in 7 States, Fall in 14
Decline in Those From Mexico Fuels Most State Decreases
BYJeffrey S. Passel and D’Vera Cohn
About Pew Research Center
Pew Research Center is a nonpartisan, nonadvocacy fact tank that informs the public about the issues, attitudes and trends shaping the world. It does not take policy positions. The Center conducts public opinion polling, demographic research, computational social science research and other data-driven research. It studies politics and policy; news habits and media; the internet and technology; religion; race and ethnicity; international affairs; social, demographic and economic trends; science; research methodology and data science; and immigration and migration. Pew Research Center is a subsidiary of The Pew Charitable Trusts, its primary funder.
Unauthorized Immigrant Totals Rise in 7 States, Fall in 14
Decline in Those From Mexico Fuels Most State Decreases
Five East Coast states were among those where the number of unauthorized immigrants grew from 2009 to 2012—Florida, Maryland, New Jersey, Pennsylvania and Virginia. Numbers also rose in Idaho and Nebraska, according to the center’s estimates.
Six Western states are among those with declines in unauthorized immigrant populations from 2009 to 2012—Arizona, California, Colorado, Nevada, New Mexico and Oregon. Other states with decreases over that period are in the South (Alabama, Georgia and Kentucky), the Midwest (Illinois, Indiana and Kansas) and the Northeast (Massachusetts and New York).1
Nationally, the population of 11.2 million unauthorized immigrants in 2012 was unchanged from 2009, the year the Great Recession ended (Passel, Cohn, Krogstad and Gonzalez-Barrera). The number had peaked in 2007 at 12.2 million and declined for the next two years during the recession.
In six of the seven states where populations of unauthorized immigrants grew from 2009 to 2012, it was because the number of non-Mexicans increased; the number of Mexicans declined or did not change. The exception was Nebraska, which had a small but statistically significant increase in Mexican unauthorized immigrants in those years.
There has been renewed debate about unauthorized immigration in recent weeks, as President Barack Obama has restated his intention to take executive action that could give relief from deportation and work permits to some of this population (New York Times, 2014). Republican leaders, who will control both houses of Congress next year as a result of the mid-term elections, have cautioned that any executive action would torpedo the chances for a bipartisan immigration reform bill.
Among the groups widely thought to be under consideration for relief from deportation are long-time U.S. residents with U.S.-born children. The Pew Research Center estimates that 4 million unauthorized immigrant parents, or 38% of adults in this population, lived with their U.S.-born children, either minors or adults, in 2012. Of these, 3 million had lived in the U.S. for 10 years or more (Passel, Cohn, Krogstad and Gonzalez-Barrera, 2014).
In addition to unauthorized immigrants, the nation’s foreign-born population of 42.5 million people in 2012 consisted of 11.7 million legal permanent residents, 17.8 million naturalized citizens and 1.9 million legal residents with temporary status (including students, diplomats and “high-tech guest workers”).
The 8.1 million unauthorized immigrants who were working or looking for work in 2012 made up 5.1% of the labor force. Both of those estimates are unchanged from 2009. The number in the labor force has remained between 8.1 million and 8.3 million since 2007. The share of unauthorized immigrants in the workforce peaked in 2007, at 5.4%.
Among states, the share of unauthorized immigrants in the labor force is highest in Nevada (10.2% in 2012). Other states with high shares in 2012 include California (9.4%) and Texas (8.9%).
States with the largest shares of students with unauthorized immigrant parents include Nevada (17.7%), California (13.2%), Texas (13.1%) and Arizona (11.0%).
Decrease in Unauthorized Immigrants from Mexico
As the Mexican numbers continued to drop between 2009 and 2012, unauthorized immigrant populations from South America and from a grouping of Europe and Canada held steady. Unauthorized immigrant populations from Asia, the Caribbean, Central America and the rest of the world grew slightly from 2009 to 2012.
The unauthorized immigrant estimates throughout this report are produced using a multistage method that subtracts the legal foreign-born population from the total adjusted foreign-born population; the residual then is used as the source of information about unauthorized immigrants. The main source of data for estimates from 2005 on is the U.S. Census Bureau’s American Community Survey; estimates for 1995 and 2000 use the bureau’s March Current Population Surveys.
Because they are based on updated data, the new estimates of unauthorized immigrants for states and the nation in this report supersede previously published Pew Research Center estimates. All trends have been updated to reflect the most current data. See Methodology for more details.
About This Report
This report provides estimates of the 2012 unauthorized immigrant population and estimates of recent population trends in each of the 50 states and the District of Columbia (see appendix for full data). It also estimates national and state-level shares of unauthorized immigrants in the overall population, foreign-born population and labor force, and the share of students in kindergarten through 12th grade with at least one unauthorized immigrant parent. The report also includes estimates of the birth countries and regions of unauthorized immigrants at the state and national levels.
The estimates use the “residual method,” a widely accepted and well-developed technique based on official government data. The data come mainly from the American Community Survey and March Supplement to the Current Population Survey, conducted by the U.S. Census Bureau. For more detail, see Methodology.
This report was written by Jeffrey S. Passel, senior demographer, and D’Vera Cohn, senior writer. Editorial guidance was provided by Claudia Deane, director of research practices, and Mark Hugo Lopez, director of Hispanic research. Eileen Patten, research analyst, and Anna Brown, research assistant, created charts and tables; number-checked the text, graphics and interactive maps; and assisted with formatting and production. Michael Keegan, information graphics designer, created the maps used in this report and developed some of its charts; Russell Heimlich, web developer, developed the interactive versions of those maps. Michael Suh, associate digital producer, provided web support. All are on the staff of the Pew Research Center. Marcia Kramer of Kramer Editing Services, was the copy editor.
“Foreign born” refers to an individual who is not a U.S. citizen at birth or who, in other words, was born outside the U.S., Puerto Rico or other U.S. territories and whose parents were not U.S. citizens. The terms “foreign born” and “immigrant” are used interchangeably. “U.S. born” refers to an individual who is a U.S. citizen at birth, including people born in the United States, Puerto Rico or other U.S. territories, as well as those born elsewhere to parents who were U.S. citizens. When referring to children of unauthorized immigrants, the terms “U.S. born” and “U.S. citizen” are used interchangeably; a small number of these children may be naturalized citizens.
The “legal immigrant” population is defined as people who have been granted legal permanent residence; those granted asylum; people admitted as refugees; and people admitted to the U.S. under a set of specific authorized temporary statuses for longer-term residence and work. This group includes “naturalized citizens,” legal immigrants who have become U.S. citizens through naturalization; “legal permanent resident aliens” who have been granted permission to stay indefinitely in the U.S. as permanent residents, asylees or refugees; and “legal temporary migrants” (including students, diplomats and “high-tech guest workers”) who are allowed to live and, in some cases, work in the U.S. for specific periods of time (usually longer than one year).
“Unauthorized immigrants” are all foreign-born non citizens residing in the country who are not “legal immigrants.” These definitions reflect standard and customary usage by the U.S. Department of Homeland Security and academic researchers. The vast majority of unauthorized immigrants entered the country without valid documents or arrived with valid visas but stayed past their visa expiration date or otherwise violated the terms of their admission. Some who entered as unauthorized immigrants or violated terms of admission have obtained work authorization by applying for adjustment to legal permanent status, obtaining Temporary Protected Status (TPS) or receiving Deferred Action for Childhood Arrivals (DACA) status. Data are very limited, but this “quasi-legal” group could account for as much as 10% of the unauthorized population. Many could also revert to unauthorized status.
The “labor force” refers to people ages 16 and older who are employed or looking for work.
Chapter 1: State Unauthorized Immigrant Populations
Twenty-one states had statistically significant changes in their populations of unauthorized immigrants from 2009 to 2012. They comprise seven states where the number of unauthorized immigrants increased and 14 where the number decreased.
These state-level changes are masked by the stability at the national level, according to the Pew Research estimates. The overall number of unauthorized immigrants living in the U.S. in 2012—standing at 11.2 million—was unchanged from 2009, the final year of the Great Recession. The population had fallen since its peak of 12.2 million in 2007, when the recession began.
States that Grew or Declined
The seven states where unauthorized immigrant populations grew from 2009 to 2012 were Florida, Idaho, Maryland, Nebraska, New Jersey, Pennsylvania and Virginia.
In two of these states, Maryland and Virginia, the state-level trends also broke with the national-level trend for 2007 to 2012. During those years, the number of unauthorized immigrants fell in the U.S. overall, but continued to grow in both Maryland and Virginia. In Maryland, the estimated number of unauthorized immigrants grew to 250,000 in 2012, compared with 220,000 in 2007. In Virginia, the estimated number grew to 275,000 in 2012 from 250,000 in 2007. (In the adjacent District of Columbia, the 2012 population of 20,000 was not statistically different from the totals in 2009 or 2007.)
The 14 states where populations of unauthorized immigrants decreased from 2009 to 2012 were Alabama, Arizona, California, Colorado, Georgia, Illinois, Indiana, Kansas, Kentucky, Massachusetts, Nevada, New Mexico, New York and Oregon.
As detailed in Chapter 2, a decline in unauthorized immigrants from Mexico was responsible for the decreases in 13 of the 14 states; in Massachusetts, the decline was due to decreases in unauthorized immigrants from other countries. In six of the seven states with increases in unauthorized immigrants, the changes were driven by increases in unauthorized immigrants from countries other than Mexico. In Nebraska, the increase was driven by a small but statistically significant gain in unauthorized immigrants from Mexico.
Although state trends varied from 2009 to 2012, there was no change in which six states had the largest unauthorized immigrant populations. The six—California, Texas, Florida, New York, New Jersey and Illinois—accounted for 60% of unauthorized immigrants in 2012. California alone had an estimated 2.4 million unauthorized immigrants in 2012, about one-in-five (22%). Texas ranked second, with 1.7 million unauthorized immigrants, 15% of the total. No other state had more than a million.
Long-Term Trend Comes to a Halt
Until the recent slowdown in growth, the unauthorized immigrant population had risen rapidly over nearly two decades—and the sharpest growth rate had been in states without major concentrations of unauthorized immigrants. As a result, there had been a marked shift in the distribution of unauthorized immigrants across the nation.
From 1990 to 2007, the unauthorized immigrant population increased from 3.5 million to 12.2 million, growth of about 250% or an average of more than 500,000 people a year.
The population of unauthorized immigrants increased in every state, but growth was slower in the six states with the largest numbers of such immigrants than in the rest of the nation as a whole.2
California, the state with the largest number of unauthorized immigrants in both 1990 and 2007, experienced the largest numerical growth, but its 88% increase from 1990 to 2007 lagged far behind other large states and nearly all smaller states. As a group, the other five largest states (Florida, Illinois, New Jersey, New York and Texas) experienced growth in their unauthorized immigrant population at the national average of 250%. Meanwhile, though, the unauthorized immigrant population in the rest of the country increased almost sevenfold, from 700,000 in 1990 to 4.7 million in 2007.
These growth differentials led to a marked shift in the distribution of unauthorized immigrants across the country. The share in California dropped to 23% in 2007 from 42% in 1990. The share in the other large states was unchanged at 38%, but the share in the rest of the country essentially doubled, to 39% in 2007 from 20% in 1990. With the overall decreases in the unauthorized population since 2007, these shifts came to a halt.
Unauthorized immigrant populations can grow at the state level for the same reasons they do nationally, when immigrants cross the U.S. border without authorization, or when they overstay a legal visa after it expired. Some states also may have experienced growth in their populations because unauthorized immigrants moved there from other states. A major factor contributing to losses in California, Illinois and New York from 2009 to 2012, according to Pew Research Center analysis, was movement of unauthorized immigrants to other states.
Unauthorized immigrant populations can decline when fewer new immigrants arrive, when a greater number decide to leave the country or through deaths (although there are relatively few deaths because unauthorized immigrants tend to be younger than the population overall). Government action also plays a role: Numbers can decline through deportations or when unauthorized immigrants obtain legal status.
The nation’s foreign-born population totaled 42.5 million in 2012, or 13.5% of U.S. residents. In addition to the nation’s 11.2 million unauthorized immigrants, it was made up of 11.7 million legal permanent residents (27.4% of immigrants in 2012), 17.8 million naturalized citizens (41.8% of immigrants) and 1.9 million legal residents with temporary status (4.5% of immigrants).
Among all immigrants, the share who were unauthorized in 2012 ranged widely by state, from 6% (Maine) to 45% (Arkansas). The states with the largest shares were in the South and Mountain West, some of which are relatively new destinations for unauthorized immigrants.
Unauthorized Immigrant Population Share
Unauthorized immigrants accounted for 3.5% of the U.S. population of nearly 316 million in 2012, down from a peak of 4.0% in 2007. The share varied from less than 1% in 10 states to 7.6% in Nevada. California (6.3%) and Texas (6.3%) also are among the top-ranked states in this regard.
Most of the states with the largest numbers of unauthorized immigrants also have relatively high shares of unauthorized immigrants. The six states with the largest unauthorized immigrant populations—California, Florida, Illinois, New Jersey, New York and Texas—also are among the states with the 10 highest shares of unauthorized immigrants in the overall population. Similarly, states with relatively lower numbers of unauthorized immigrants tend to have lower shares in the overall population.
Nationally, unauthorized immigrants made up about a quarter of the foreign-born population (26%) in 2012. That share peaked in 2007, at 30%, when the size of the unauthorized immigrant population also peaked.
One-in-Twenty People in the Labor Force
In the U.S. overall, unauthorized immigrants account for one-in-twenty people in the labor force, or 8.1 million people in 2012, but the share is markedly higher in some states, especially those with high shares of unauthorized immigrants in the population.
The share of unauthorized immigrants among adults ages 16 and older who are working or looking for work is highest in Nevada (10.2% in 2012); Nevada also has the highest share of unauthorized immigrants in the overall population (7.6%). The share in the labor force also is relatively high in California (9.4%) and Texas (8.9%), which rank second and third in the unauthorized immigrant share of the total population.
Unauthorized immigrants are more likely than the overall U.S. population to be of working age and less likely to be young or older (Passel and Cohn, 2009). That is one reason that the unauthorized immigrant share of the labor force is higher than its share of the population overall.
Students with Unauthorized Immigrant Parents
Children with at least one unauthorized immigrant parent made up 6.9% of students enrolled in kindergarten through 12th grade in 2012. Most (5.5% of all students) are U.S.-born children who are U.S. citizens at birth. The rest (1.4%) are unauthorized immigrants themselves.
Among elementary and secondary school students with unauthorized immigrant parents, the U.S.-born share has grown since 2007 while the share who are themselves unauthorized immigrants has declined. In 2007, for example, when the unauthorized immigrant population was at its peak, 7.2% of elementary and secondary school students had unauthorized immigrant parents: 4.5% were born in the U.S. and 2.6% were themselves unauthorized.
This trend is parallel to a general rise in the number of U.S.-born children of unauthorized immigrants and a decline in juvenile unauthorized immigrants (Passel, Cohn, Krogstad and Gonzalez-Barrera, 2014). As long-term residents make up a growing share of unauthorized immigrants, they are more likely to have U.S.-born children. Among unauthorized immigrant adults in 2012, 4 million (or 38%) lived with U.S.-born children, either minors or adults. In 2000, 2.1 million, or 30%, did.
The number of unauthorized immigrant adults with U.S.-born children may be higher than what is shown here because these numbers do not include those who live separately from their children.
Young unauthorized immigrants have declined in number in part because some have turned 18 and become adults with unauthorized status.
The share of students with unauthorized immigrant parents varies widely by state. The 2012 share was in double digits in four states—Nevada (17.7%), California (13.2%), Texas (13.1%) and Arizona (11.0%). In seven states, the share in 2012 was less than 1%.
Chapter 2: Birthplaces of U.S. Unauthorized Immigrants
The most notable trend in the national origins of unauthorized immigrants over the past five years has been the continued decline in the number and share born in Mexico. The population of Mexican-born unauthorized immigrants, 2.9 million in 1995, peaked in 2007 at 6.9 million and declined to 6.4 million in 2009. Even as the number of unauthorized immigrants stabilized overall, the number of Mexicans continued to decline, to 5.9 million in 2012.
Meanwhile, populations of unauthorized immigrants grew from 2009 to 2012 among all other regions of birth except South America and a grouping of Europe and Canada. There were relatively small but statistically significant increases in totals from Central America, the Caribbean, Asia and a grouping from the world’s remaining nations.
Driven largely by the marked decline in Mexicans, the shares of unauthorized immigrants from other nations and regions have grown. Mexicans were 52% of unauthorized immigrants in 2012, compared with 56% in 2009. Except for South America, shares rose somewhat during that period from all other regions—including Central America (to 15% in 2012), the Caribbean (5%), Asia (12%), a grouping of Europe and Canada (5%) and a grouping from remaining nations (3%). South America accounted for 6% of unauthorized immigrants in 2012.
Mexico has been the top source of the number of unauthorized immigrants since at least 1995, the first year of Pew Research data analysis, and other analyses have found that it has held that place in earlier decades as well.3
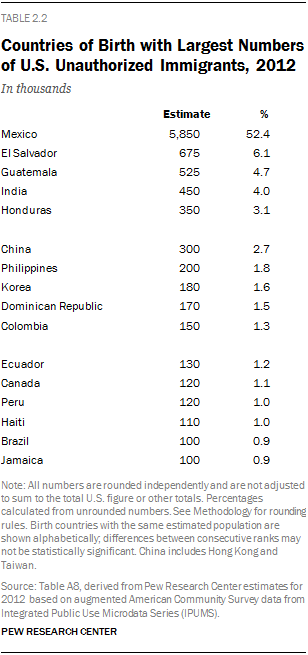
After top-ranked Mexico, the next five top source countries of unauthorized immigrants have been the same since 2005. Ranking second, with considerably fewer unauthorized immigrants than Mexico, is El Salvador (675,000 in 2012). It is followed by Guatemala (525,000), India (450,000) and Honduras (350,000), China (300,000) and the Philippines (200,000). Rounding out the top 10 in 2012 are Korea (180,000), the Dominican Republic (170,000) and Colombia (150,000).
The sudden reversal of a long trend of growth in the number of Mexican unauthorized immigrants probably results from both a marked decline in new arrivals and an increase in departures to Mexico (Passel, Cohn, and Gonzalez-Barrera, 2012). These trends are evident in government data, mainly from the Census Bureau, analyzed by Pew Research.
State-Level Patterns
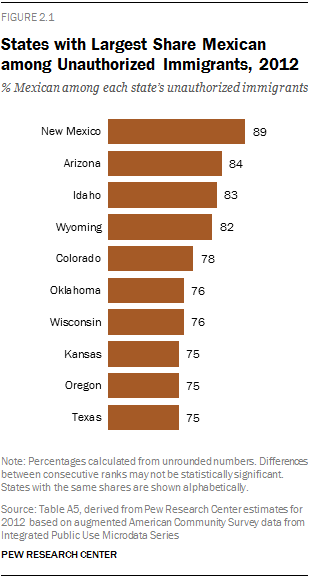
Among the 44 states (and District of Columbia)4 for which data about national origin are available, Mexicans make up the majority of all unauthorized immigrants in 26 of them. The four states where Mexicans make up more than eight-in-ten unauthorized immigrants are all in the West—New Mexico (89%), Arizona (84%), Idaho (83%) and Wyoming (82%).
States with low shares of Mexicans include some in the Northeast: New Hampshire (7%), Rhode Island (6%) and Massachusetts (3%). Hawaii’s share was 7%.
Even in states where Mexicans are not the majority of unauthorized immigrants, they are frequently the largest national origin group—36 states have more Mexicans than any other unauthorized immigrants. Mexicans are not the largest group in three New England states, the area around the nation’s capital (the District of Columbia, Maryland and Virginia), as well as Alaska, Hawaii and Louisiana.
They include New Hampshire (where India is the largest birth country), Massachusetts (El Salvador) and Rhode Island (Guatemala). In Maryland, the District of Columbia and Virginia, unauthorized immigrants from El Salvador constitute the largest group. Hondurans outnumber Mexicans in Louisiana. In Alaska and Hawaii, unauthorized immigrants from the Philippines are the largest group, representing a majority of Alaska’s unauthorized immigrant population and almost half of Hawaii’s.
Because Mexicans are the largest origin group in so many states, their trends have an important impact on state-level populations. In states where unauthorized immigrant populations declined from 2009 to 2012, it was mainly because the number of Mexicans decreased, according to Pew Research analysis.
In 13 of the 14 states where unauthorized immigrant numbers declined from 2009 to 2012, the decreases were due to drops in the number from Mexico, according to Pew Research analysis. Those states were Alabama, Arizona, California, Colorado, Georgia, Illinois, Indiana, Kansas, Kentucky, Nevada, New Mexico, New York and Oregon. In Massachusetts, the overall unauthorized immigrant population decline was due to decreases in unauthorized immigrants from countries other than Mexico.
Bean, Frank D., R. Corona, R. Tuirán and K. Woodrow-Lafield. 1998. “The Quantification of Migration Between Mexico and the United States.” pp. 1-90 in Migration Between Mexico and the United States, Binational Study, Vol. 1. Mexico City and Washington, D.C.: Mexican Ministry of Foreign Affairs and U.S. Commission on Immigration Reform.
Marcelli, Enrico A. and Paul M. Ong. 2002. “2000 Census Coverage of Foreign-Born Mexicans in Los Angeles County: Implications for Demographic Analysis.” Paper presented at the 2002 annual meeting of the Population Association of America, Atlanta, GA, May.
Passel, Jeffrey S. 2001. “Demographic Analysis: An Evaluation.” Section 4 in U.S. Census Monitoring Board, Presidential Members. Final Report to Congress. Washington, D.C., September.
Passel, Jeffrey S., Rebecca L. Clark, and Michael Fix. 1997. “Naturalization and Other Current Issues in U.S. Immigration: Intersections of Data and Policy.” Proceedings of the Social Statistics Section of the American Statistical Association: 1997. Alexandria, VA: American Statistical Association.
Passel, Jeffrey S., Jennifer Van Hook, and Frank D. Bean. 2004. “Estimates of the Legal and Unauthorized Foreign-born Population for the United States and Selected States, Based on Census 2000.” Report prepared for U.S. Census Bureau. Washington, D.C. June.
Warren, Robert and Jeffrey S. Passel. 1987. “A Count of the Uncountable: Estimates of Undocumented Aliens Counted in the 1980 United States Census.” Demography 24 (3, August): 375–393.
The estimates presented in this report for the unauthorized immigrant population are based on a residual estimation methodology that compares a demographic estimate of the number of immigrants residing legally in the country with the total number of immigrants as measured by a survey—either the American Community Survey or the March Supplement to the Current Population Survey. The difference is assumed to be the number of unauthorized immigrants in the survey, a number that later is adjusted for omissions from the survey (see below). The basic estimate is:
The legal resident immigrant population is estimated by applying demographic methods to counts of legal admissions covering the period since 1980 obtained from the Department of Homeland Security’s Office of Immigration Statistics (U.S. Department of Homeland Security, 2012) and its predecessor at the Immigration and Naturalization Service, with projections to current years, when necessary. Initial estimates here are calculated separately for age-gender groups in six states (California, Florida, Illinois, New Jersey, New York and Texas) and the balance of the country; within these areas the estimates are further subdivided into immigrant populations from 35 countries or groups of countries by period of arrival in the United States. Variants of the residual method have been widely used and are generally accepted as the best current estimates (Baker and Rytina, 2013; Warren and Warren, 2013). See also Passel, Cohn and Gonzalez-Barrera (2013), Passel and Cohn (2008), Passel (2007) and Passel et al. (2004) for more details.
The overall estimates for unauthorized immigrants build on these residuals by adjusting for survey omissions for these six states and the balance of the country, subdivided for Mexican immigrants and other groups of immigrants (balance of Latin America, South and East Asia, rest of world) depending on sample size and state.
Once the residual estimates have been produced, individual foreign-born respondents in the survey are assigned a specific status (one option being unauthorized immigrant) based on the individual’s demographic, social, economic, geographic and family characteristics in numbers that agree with the initial residual estimates for the estimated legal immigrant and unauthorized immigrant populations. These status assignments are the basis for the characteristics reported here (including, for example, specific countries of birth, detailed state estimates and labor force participation). A final step in the weighting-estimation process involves developing final state-level estimates that take into account trends over time in the estimates.
Comparability with Previous Estimates
The estimates presented here for 1990-2012 are internally consistent and comparable across years and states. The 2005-2012 estimates are based on the American Community Survey (ACS); those for 1995 and 2000, on the March Current Population Survey (CPS); and for 1990, on the 1990 Census (produced by Warren and Warren, 2013). The Pew Research Center published estimates for these same dates from essentially these same sources in two previous reports issued since September 2013 (Passel et al., 2014; Passel, Cohn and Gonzalez-Barrera, 2013) and related graphics. These earlier reports also included estimates for 1996-1999, 2001-2004 and 2013 based on March Current Population Surveys—estimates that are also consistent with estimates published here.5
The estimates in this report and the previous two reports are based on survey data consistent with the censuses of 1990, 2000 and 2010. For the 1995-2009 surveys, special weights were developed to align with both the preceding and subsequent censuses (see below). As such, population figures for these years are not identical to those published from the original surveys. Moreover, these new estimates of unauthorized immigrants differ from previous estimates published before 2013, even from earlier estimates based on the same surveys. Although differences at the national level are not generally very large, some state-level differences may be relatively greater. The estimates in this report supersede all Pew Research estimates published before September 2013 and the ACS-based estimates in this report supersede earlier estimates for the same date (i.e., 2012) based on the CPS.
The ACS has a much larger sample size than the CPS (see below). As such, state-level estimates of unauthorized immigrants and those for countries of birth are much more precise (i.e., have smaller margins of error) from the ACS than from the CPS. The larger sample sizes also permit more detailed analyses of the characteristics of unauthorized immigrants at the state level and for individual countries of birth.
Rounding of Estimates
All estimates for unauthorized immigrant populations are presented as rounded numbers to avoid the appearance of unwarranted precision in the estimates. The rounding conventions for unauthorized immigrant estimates, dependent somewhat on data sources, are:
Estimates for 1990 are based on the 1990 Census and use ACS-based rounding conventions. These same conventions are used to round the 90% confidence intervals limits, presented as “Range (+ or /),” with one exception—limits that round to less than 5,000 are shown as 2,000. For state and national level data on the total population or total labor force, figures are rounded to the nearest 10,000.
Unrounded numbers are used for significance tests, for plotting charts and for computations of differences and percentages. Where differences are reported, they are computed from unrounded estimates and then rounded separately. Because each figure is rounded separately, the rounded estimates may not add to rounded totals. Similarly, percentages computed from rounded numbers may differ from the percentages shown in this report.
Status Assignments—Legal and Unauthorized Immigrants
Individual survey respondents are assigned a status as a legal or unauthorized immigrant based on the individual’s demographic, social, economic and geographic characteristics so the resulting number of immigrants in various categories agrees with the totals from the residual estimates. The assignment procedure employs a variety of methods, assumptions and data sources.
First, all immigrants entering the U.S. before 1980 are assumed to be legal immigrants. Then, the ACS and CPS data are corrected for known over-reporting of naturalized citizenship on the part of recently-arrived immigrants (Passel et al. 1997). Specifically immigrants in the U.S. less than six years are not eligible to naturalize unless they are married to a U.S. citizen, in which case they can naturalize after three years. Immigrants reporting as naturalized who fail to meet these requirements are moved into the non-citizen category. All remaining naturalized citizens from countries other than Mexico and those in Central America are assigned as legal. Persons entering the U.S. as refugees are identified on the basis of country of birth and year of immigration to align with known admissions of refugees and asylees (persons granted asylum). Then, individuals holding certain kinds of temporary visas (including students, diplomats and “high-tech guest workers”) are identified in the survey and each is assigned a specific legal temporary migration status using information on country of birth, date of entry, occupation, education and certain family characteristics. The specific visa types identified and supporting variables are:
Diplomats and embassy employees (A visa)
Foreign students (F, M visa)
Visiting scholars (J visa)
Physicians (J visa)
Registered nurses (H-1A visas)
Intracompany transfers (L visas)
“High-tech” guest workers (H-1B visas)
International organizations (G visas)
Religious workers (R visas)
Exchange visitors (J visas)
Athletes, artists and entertainers (O, P visas)
Spouses and children within the various categories
Finally, immigrants are screened on the basis of occupations, participation in public programs and relationships with natives and legal immigrants. Some individuals are assigned as legal immigrants because of these characteristics:
Refugees and naturalized citizens
Legal temporary immigrants
Persons working for the government or the Armed Forces
Veterans or members of the Armed Forces
Participants in government programs not open to unauthorized immigrants—Supplemental Security Income (SSI), Temporary Assistance for Needy (TANF), Medicare, Medicaid and Food Stamps
Persons entering the U.S. before 1980
Persons with certain occupations that require legal status or government licensing (e.g. police officers and other law enforcement occupations, lawyers, health care professionals)
Children of citizens and legal temporary migrants
Most immediate relatives of U.S. citizens
Other family members, especially those entering the U.S before legal residents
As result of these steps, the foreign-born population is divided between individuals with “definitely legal” status (including long-term residents, naturalized citizens, refugees and asylees, legal temporary migrants and some legal permanent residents) and a group of “potentially unauthorized” migrants. (See Passel, 2007 and Passel et al., 2004 for additional detail.)
The number of potentially unauthorized migrants typically exceeds the estimated number of unauthorized migrants (from the residual estimates) by 20-35% nationally. So, to have a result consistent with the residual estimate of legal and unauthorized immigrants, probabilistic methods are employed to assign legal or unauthorized status to these potentially unauthorized individuals. The base probability for each assignment is the ratio of the residual estimate to the number of potentially unauthorized immigrants. These initial probabilities are first adjusted separately for parents living with their children and all others (to ensure that an appropriate number of unauthorized children are selected) and then by broad occupation categories.
After this last step in the probabilistic assignment process, there is a check to ensure that the legal statuses of family members are consistent; for example, all family members entering the country at the same time are assumed to have the same legal status. The resulting populations for unauthorized immigrants are compared with the residual estimates; if they disagree, the assignment probabilities are adjusted and the random assignments are repeated. The entire process requires several iterations to produce estimates that agree with the demographically-derived population totals. At the end, the final estimates agree with the residual estimates for the six individual states noted earlier and for the balance of the country; for Mexican-born and other legal and unauthorized immigrants in each area; and for children, working-age men and working-age women within each category. Finally, the survey weights for the foreign-born are adjusted upward for survey omissions (undercount) so the tabulated figures agree with the adjusted analytic, demographic estimates of the total number of legal and unauthorized migrants developed in the very first step.
Data Sources and Survey Weights
The American Community Survey is an ongoing survey conducted by the U.S. Census Bureau. The survey collects detailed information on a broad range of topics, including country of birth, year of immigration and citizenship—the information required for the residual estimates. The ACS has a continuous collection design with monthly samples of about 250,000; the nominal annual sample size was about 2.9 million households for 2005-2009 with about 1.9 million included in the final sample. The initial sample was expanded to almost 3.3 million addresses for 2011 and over 3.5 million for 2012; the final sample included more than 2.1 million address in 2011 and almost 2.4 million in 2012 (http://www.census.gov/acs/www/methodology/sample_size_data/index.php).
For this report, public-use samples of individual survey records from the ACS are tabulated to provide the data used in the estimation process. The public-use file is a representative 1% sample of the entire U.S. (including about 3 million individual records for each year 2005-2012) obtained from the Integrated Public-Use Microdata Series or IPUMS (Ruggles et al., 2010). The ACS began full-scale operation in 2005 covering only the household population; since 2006 it has covered the entire U.S. population. ACS data are released by the Census Bureau in September for the previous year.
The other survey data source used for residual estimates comes from March Supplements to the Current Population Survey. The CPS is a monthly survey currently of about 55,000 households conducted jointly by the U.S. Bureau of Labor Statistics and the Census Bureau. Since 2001, the March supplement sample has been expanded to about 80,000 households; before then, the expanded March Supplement sample included about 50,000 households (U.S. Census Bureau, 2006). The CPS universe covers the civilian noninstitutional population. The CPS was redesigned in 1994 and, for the first time, included the information required for the residual estimates (i.e., country of birth, date of immigration and citizenship). Some limitations of the initial March Supplement of redesigned CPS, 1994, preclude its use in making these estimates, so the first CPS-based estimates are for March 1995. CPS data are released by the Census Bureau in September for the previous March
Population figures from both the ACS and CPS are based on the Census Bureau’s official population estimates for the nation, states and smaller areas through a weighting process that ensures the survey figures agree with pre-specified national population totals by age, sex, race and Hispanic origin. At the sub-national level, the two surveys differ in their target populations. The March CPS data agree with state-level totals by age, sex and race and are based on a process that imposes other conditions on weights for couples (U.S. Census Bureau, 2006). The ACS weights use estimates for much smaller geographic areas that are summed to state totals (U.S. Census Bureau, 2014– especially Chapter 11).
The population estimates for the surveys are based on the latest available figures at the time the survey weights are estimated. This process produces the best estimates available at the time of the survey, but it does not guarantee that a time series produced across multiple surveys is consistent or accurate. Significant discontinuities can be introduced when the Census Bureau changes its population estimation methods, as it did several times early in the 2000s and in 2007 and 2008 (Passel and Cohn, 2010), or when the entire estimates series is recalibrated to take into account the results of a new census.
The estimates shown for unauthorized immigrants and the underlying survey data are derived from ACS IPUMS 1% samples for 2005-2012 and March CPS public-use files for 1995 and 2000, which have been reweighted to take into account population estimates consistent with the 1990 Census, the 2000 Census, the 2010 Census and the most recent population estimates. The population estimates used to reweight the ACS for 2005 through 2009 are the Census Bureau’s intercensal population estimates for the 2000s (http://www.census.gov/popest/data/intercensal/index.html); these population estimates use demographic components of population change for 2000-2010 and are consistent with both the 2000 and 2010 censuses. Similarly, the population estimates used to reweight the CPS for March 1995 and March 2000 are the intercensal population estimates for the 1990s (U.S. Census Bureau, 2013), which are consistent with the 1990 and 2000 censuses. The ACS data for 2010-2012 do not require reweighting as they are weighted to recent population estimates based on the 2010 Census. The original 2005 ACS covered the household population, but not the population living in group quarters (about 8 million people). For Pew Research Center analyses, we augmented the 2005 ACS with group quarters records from the 2006 ACS but weighted to agree with the 2005 population estimates. The reweighting methodology for both the ACS and CPS follows, to the extent possible, the methods used by the Census Bureau in producing the sample weights that equal the population totals. See Passel, Cohn and Gonzalez-Barrera 2013 for more details on weighting and adjustments for survey undercoverage.
Because of the much, much larger sample size in the ACS (3.1 million sample cases in 2012 including more than 350,000 foreign-born cases) than the March CPS (203,000 sample cases in 2012 with about 26,000 foreign-born), the ACS-based estimates should be considered more accurate than the CPS-based estimates. In this publication, we have replaced the previous CPS-based estimate for 2012 with the new ACS-based estimate.
Other Methodological Issues
Adjust for Undercount
Adjustments for omissions from the surveys (also referred to as adjustments for undercount) are introduced into the estimation process at several points. The initial comparisons with the survey (based on the equation shown above) take the difference between the immigrants in the survey and the estimated legal population. Since the comparison is people appearing in the survey, the estimated legal population must be discounted slightly because some legal immigrants are missed by the survey. This initial estimate represents unauthorized immigrants included in the survey. To estimate the total number of unauthorized immigrants in the country, it must be adjusted for those left out. Similarly, the estimated number of legal immigrants appearing in the survey must also be adjusted for undercount to arrive at the total foreign-born population.
These various coverage adjustments are done separately for groups based on age, sex, country of birth and year of arrival. The patterns and levels of adjustments are based on Census Bureau studies of overall census coverage (see U.S. Census Bureau, 2012 for links to evaluation studies of the 1980, 1990, 2000 and 2010 Censuses; also Passel, 2001) that are adjusted up or down to reflect the results of a number of specialized studies that focus on immigrants. Census Bureau undercount estimates have generally been subdivided by race/Hispanic origin, age, and sex. So the adjustments to the Pew Research Center data use rates for countries of birth based on the predominant race of immigrants from the country—Hispanic and non-Hispanic races for white, black and Asian. Undercount rates for children do not differ by gender, but for younger adults (ages 18-29 and 30-49) the undercount rates for males tend to be higher, and for some groups much higher, than those for females. At older ages, the undercount rates are lower than for younger adults with no strong patterns of gender differences (and with some estimated overcounts).
The basic information on specific coverage patterns of immigrants is drawn principally from comparisons with Mexican data, U.S. mortality data and specialized surveys conducted at the time of the 2000 Census (Van Hook et al., 2014; Bean et al., 1998; Capps et al., 2002; Marcelli and Ong, 2002). In these studies, unauthorized immigrants generally have significantly higher undercount rates than legal immigrants who, in turn, tend to have higher undercounts than U.S. natives. More recent immigrants are more likely than longer-term residents to be missed. The most recent study (Van Hook et al., 2014) finds marked improvements in coverage of Mexicans in the ACS and CPS between the late 1990s and the 2000s. This and earlier work suggest very serious coverage problems with immigrants in the data collected before the 2000 Census but fewer issues in the 2000 Census and subsequent data sets. This whole pattern of assumptions leads to adjustments of 10% to 20% for the estimates of unauthorized immigrants in the 1995-2000 CPS, with slightly larger adjustments for unauthorized Mexicans in those years. (Note that this means even larger coverage adjustments, sometimes exceeding 30% for adult men younger than age 40.)
After 2000, the coverage adjustments build in steady improvements in overall coverage and improvements specifically for Mexican immigrants. The improvements are even greater than noted in the research comparing Mexico and U.S. sources because the reweighted ACS and CPS data provide even greater improvements in reducing undercounts, since they incorporate results of the 2010 Census (Passel and Cohn, 2012). With all of these factors, coverage adjustments increase the estimate of the unauthorized immigrant population by 8% to 13% for 2000-2009 and by 5% to 7% for 2010-2012. For the overall immigrant population, coverage adjustments hovered slightly below 5% during the 1990s and trended downward to around 2% to 3% by 2012. Since the population estimates used in weighting the ACS and the CPS come from the same sources, the coverage adjustments tend to be similar.
Margins of Error
Estimates of the unauthorized immigrant population are computed as the difference between a deterministic, administratively based estimate (i.e., the legal foreign-born population, or “L” in the equation above) and a sample-based estimate (i.e., the survey total of the foreign-born population, or “F”). Consequently the margin of error (or variance) for the estimated unauthorized population is the margin of error for “F,” the sample-based estimate of the foreign-born population in the estimates for the U.S. and the six largest states. Thus, for these areas, the margins of error are based on the variance of the foreign-born population entering since 1980. For other states, for countries and regions of birth and for characteristics other than the total number of unauthorized immigrants (e.g., numbers in the labor force), the margins of error are based on the estimated populations themselves and not the larger number of foreign-born who entered since 1980.
For all ACS, variances were computed with replicate weights supplied for the ACS by the Census Bureau through IPUMS (Ruggles et al., 2010; documentation of the weights at U.S. Census Bureau, 2014, especially Chapter 12); for earlier CPS data, generalized variance formulas supplied in Census Bureau documentation were used to compute margins of error (U.S. Census Bureau, 2012b, especially Appendix G).
The ranges reported represent a 90% confidence interval around the estimates. They take into account the sampling error associated with the survey-based estimate. Other sources of potential error—including the variability associated with the random assignment of legal statuses, potential errors in the status assignment process and non-sampling error in the surveys—are not represented in the reported margins of error. For this report, statistical tests rely on a 90% confidence level.
Countries and Regions of Birth
Some modifications in the original CPS countries of birth were introduced to ensure that all foreign-born respondents could be assigned to a specific country or region of birth. See Passel and Cohn (2008) for a detailed treatment of how persons with unknown country of birth were assigned to specific countries.
Defining regions of the world and, in some cases, specific countries using the various data sources requires grouping areas into identifiable units and “drawing lines” on the world map. In the historical data used to construct the legal foreign-born population, it is not possible to differentiate the individual republics within the former Soviet Union. Thus, for analytic purposes in this report, the former republics are grouped together and considered to be part of Europe. For this report, China, Hong Kong and Taiwan are combined and reported as “China” because of potential inconsistencies between the administrative data sources and the surveys and because of concerns over consistency of reporting on the part of respondents. South and East Asia is defined to include Afghanistan, Pakistan and countries east of them. The Middle East includes Southwest Asia from Iran and westward plus countries in North Africa. Data for North and South Korea are not generally separated in the survey data used for the estimates. Thus, data reported for persons born in Korea cover both North and South Koreans; the vast majority of Korean immigrants in the U.S. are from South Korea.