
Pew Research Center

FOR RELEASE JUNE 19, 2014

Latino Jobs Growth Driven by U.S. Born

Immigrants No Longer the Majority of Hispanic Workers

BY Rakesh Kochhar

FOR MEDIA OR OTHER INQUIRIES:

Communications Department
202.419.4372
www.pewresearch.org

RECOMMENDED CITATION

Pew Research Center, June 2014, "Latino Jobs Growth Driven by U.S. Born"

About Pew Research Center

Pew Research Center is a nonpartisan, nonadvocacy fact tank that informs the public about the issues, attitudes and trends shaping the world. It does not take policy positions. The Center conducts public opinion polling, demographic research, computational social science research and other data-driven research. It studies politics and policy; news habits and media; the internet and technology; religion; race and ethnicity; international affairs; social, demographic and economic trends; science; research methodology and data science; and immigration and migration. Pew Research Center is a subsidiary of The Pew Charitable Trusts, its primary funder.

© Pew Research Center 2026

Table of contents

  • About Pew Research Center
  • Latino Jobs Growth Driven by U.S. Born
  • Chapter 1: Employment and Unemployment in the Recession and the Recovery
  • Chapter 2: The Jobs Recovery for Hispanics
  • Chapter 3: The Jobs Recovery for Non-Hispanics
  • Chapter 4: The Jobs Recovery for All Foreign-born and All U.S.-born Workers
  • Chapter 5: Employment Change by Industry
  • Chapter 6: Wages in the Recession and the Recovery
  • References
  • Appendix A: Revisions of the Current Population Survey
  • Appendix B: Data Tables

Latino Jobs Growth Driven by U.S. Born

Immigrants No Longer the Majority of Hispanic Workers

For the first time in nearly two decades, immigrants do not account for the majority of Hispanic workers in the United States. Meanwhile, most of the job gains made by Hispanics during the economic recovery from the Great Recession of 2007-09 have gone to U.S.-born workers, according to a new Pew Research Center analysis of government data.

Immigrants No Longer the Majority of Latino Workers

In 2013, 49.7% of the more than 22 million employed Latinos were immigrants. This share was down sharply from the pre-recession peak of 56.1% in 2007. Although Latinos have gained 2.8 million jobs since the recession ended in 2009, only 453,000 of those went to immigrants. Moreover, all of the increase in employment for Latino immigrants happened in the first two years of the recovery, from 2009 to 2011. Since then, from 2011 to 2013, the employment of Latino immigrants is unchanged.

This development is mostly due to the waning inflow of Hispanic immigrants. The Great Recession, a tepid jobs recovery, tighter border controls and more deportations have served to mitigate migration to the U.S. from Latin America, especially Mexico, in recent years.1 Since the recession started in December 2007, the growth in the Latino immigrant workforce (people ages 16 and older) has slowed dramatically even as the Latino U.S.-born workforce continues to expand at a rapid pace.

The diminished role of Latino immigrants is in stark contrast to trends prior to the Great Recession, and the boom and bust in the U.S. housing market is a key factor. From 2004 to 2007, during the height of the construction boom, immigrant Latinos gained 1.6 million jobs, two times the 829,000 new jobs secured by U.S.-born Latinos.2 During the recession, the construction sector alone let go of 520,000 Latino immigrants, with foreign-born Latinos losing 340,000 jobs overall.3 None of the construction jobs have come back for immigrants. Among foreign-born Latinos, the share working  in construction fell from 19% in 2007 to 15% in 2009 and has stayed at about that level.

It is likely that the share of the Latino workforce that is U.S. born will continue to increase. The U.S. born currently account for most of the growth in the Latino population, and it is uncertain that Latino migrants will return to the U.S. workforce in larger numbers. Some leading economists are of the view that the U.S. has entered a new era of slower economic growth.4 If so, jobs growth in the future may not be strong enough to reinvigorate immigration from Latin America. The future direction of U.S. immigration policy is also unknown. Finally, demographers have noted that sharp declines in birth rates in Mexico and other Latin American countries may ease the pressure to emigrate to the U.S. in the longer run.5

Although the inflow of Hispanic immigrants into the U.S. labor market has diminished since the start of the Great Recession, the role of immigrants overall continues to expand. The baton is now in the hands of non-Hispanic migrants, whose inflow—less driven by unauthorized inflows and less dependent on construction sector jobs—is unaffected by the recession. From the fourth quarter of 2009 to the fourth quarter of 2013, the working-age population of Hispanic immigrants increased by only 382,000, while that of non-Hispanic immigrants increased by 2.3 million. The growth was sufficient to increase the share of all immigrants in U.S. employment from 15.8% in 2009 to 16.5% in 2013.

The Jobs Recovery for Hispanics Is Driven by Demographics

U.S.-born Latinos Gain More Jobs than Immigrant Latinos in the Economic Recovery

Latinos overall have more than made up for the jobs they lost during the recession in terms of numbers, though not necessarily in the share that are employed. That is because jobs growth for Hispanics is just keeping pace with the growth in their working-age population.

Overall, Hispanics secured 2.8 million new jobs from the fourth quarter of 2009 to the fourth quarter of 2013, well in excess of the 378,000 jobs lost during the recession. The growth in Hispanic employment accounted for 43.4% of the total jobs growth of 6.4 million in the U.S. economy from 2009 to 2013. That was similar to the contribution of Latinos (43.6%) to the growth in the U.S. working-age population over the time period.

Meanwhile, U.S.-born Hispanics gained 2.3 million jobs in the recovery, compared with a loss of 37,000 jobs in the recession. For Hispanic immigrants, the 453,000 jobs gained in the recovery are not notably greater than the 340,000 jobs lost in the recession.

But the seemingly strong recovery for Hispanics is more about demographics than good economic fortune. Because jobs growth and population growth are proceeding at similar rates, the proportion of Hispanics with jobs barely edged up in the recovery, from 59% at the end of 2009 to 60% at the end of 2013. The share employed in 2013 is still less than the 64.3% share employed at the start of the recession.

The Unemployment Rate Among Hispanics Has Fallen in the Recovery ...

The Latino unemployment rate decreased during the recovery, falling to 8.8% in the fourth quarter of 2013 from 12.7% in the fourth quarter of 2009. But some of this decrease is likely due to discouraged workers leaving the workforce and therefore no longer being counted as unemployed. Moreover, the unemployment rate for Hispanics remains greater than the 5.9% it was at the start of the recession in the fourth quarter of 2007. Even more progress is to be made before the Hispanic unemployment rate matches its historic low of 5% reached in the fourth quarter of 2006.

The unemployment rates for both U.S.-born and immigrant Latinos are still higher than their levels in 2007. For U.S.-born Latinos, the unemployment rate increased from 6.8% in the fourth quarter of 2007 to 13.8% in the fourth quarter of 2009, and it retreated only to 10.3% by the fourth quarter of 2013. The unemployment rate for Latino immigrants increased from 5.2% in 2007 to 11.8% to 2009, and it had fallen to 7.2% by the end of 2013.

Jobs Growth for Hispanics Is Concentrated in Traditional Industries

Most of the job growth in the recovery for Hispanics has come from industries in which they are traditionally concentrated. About half of Hispanic workers are employed in just four industries—construction; eating, drinking and lodging services; wholesale and retail trade; and professional and other business services. These four industries were also at the center of employment change for Hispanics during the recession and the recovery.

In the construction sector, Hispanics lost 686,000 jobs during the recession and regained only 74,000 of those jobs in the recovery. However, in the other three industries—eating, drinking and lodging services; wholesale and retail trade; and professional and other business services—Hispanics gained jobs during both the recession (236,000 in the three industries combined) and the recovery (1.3 million). These three industries accounted for 45.5% of the jobs growth for Hispanics from 2009 to 2013.

Changes in Earnings Among Hispanics

Median Weekly Earnings Among Hispanics Are Stagnant

The earnings of Hispanic workers have risen modestly since 2007. For full-time Hispanic workers, the median weekly wage in the fourth quarter of 2013 was $570, compared with $556 in the fourth quarter of 2007 (in fourth-quarter 2013 dollars), an increase of 2.5%.

But the estimated increase in earnings for all full-time Hispanic workers is a misleading indicator of economic gain. Considered separately, the median weekly earnings of U.S.-born Hispanics working full time fell from $684 in 2007 to $640 in 2013, a loss of 6.4%. Meanwhile, the earnings of foreign-born Hispanics working full time were unchanged at about $500.

So why did wages for Hispanics overall increase from 2007 to 2013 if neither U.S.-born nor foreign-born Hispanics experienced an increase? The answer lies in the changing composition of the Latino workforce. Because Hispanic immigrants earn less than U.S.-born Hispanics, their retreat from the U.S. workforce raises the estimated earnings of Latinos overall.

This report focuses on employment, unemployment and earnings among Hispanics and non-Hispanics, both U.S. born and foreign born, during the Great Recession and the economic recovery. The report also describes labor market outcomes for whites, blacks and Asians, and it analyzes the sources of jobs growth by industry for the different groups of workers. The recession is defined as the two-year period from the fourth quarter of 2007 to the fourth quarter of 2009.6 The recovery is the four-year period from the fourth quarter of 2009 to the fourth quarter of 2013. An update on labor market trends through the first quarter of 2014 is provided below.


Employment and Unemployment in 2014

This report examines trends in the U.S. labor market from the fourth quarter of 2007 to the fourth quarter of 2013. Because the underlying data are not seasonally adjusted, employment, unemployment and earnings in a given year are always compared with the same quarter in another year. That ensures that seasonal fluctuations are not affecting the results. For that reason, the analysis, which begins with the start of the recession in the fourth quarter of 2007, ends with the fourth quarter of 2013.

Is there anything that can be said about labor market trends through 2014? Since the Bureau of Labor Statistics does not publish seasonally adjusted data for many of the demographic groups included in this study, e.g., for immigrants the analysis cannot be fully extended through the first quarter of 2014. However, the BLS seasonally adjusted data for all workers and for Hispanics show that the pace of the recovery may have picked up in 2014.

For Hispanics, the seasonally adjusted unemployment rate fell from 8.7% in the fourth quarter of 2013 to 8.1% in the first quarter of 2014. For workers overall, the unemployment rate dropped to 6.7% in the first quarter of 2014, down from 7% in the fourth quarter of 2013. The employment rates and labor force participation rates for both groups of workers also showed signs of improvement. Nonetheless, these major labor market indicators still have much ground to cover to get back to their pre-recession levels.

Other main findings of this report include:

All Workers

  • The economy lost 7.7 million jobs in the recession, from the fourth quarter of 2007 to the fourth quarter of 2009.
  • Only 6.4 million jobs have been restored in four years of economic recovery, from the fourth quarter of 2009 to the fourth quarter of 2013. That still leaves the labor market about 1.4 million jobs short compared with the start of the recession in late 2007.
  • The employment rate—the share of the working-age population that is employed—edged up from 58.2% at the end of 2009 to 58.7% at the end of 2013. At the start of the recession in late 2007, the employment rate was 62.8%.
  • The economic recovery has lowered the unemployment rate from 9.6% in 2009 to 6.7% in 2013. Nonetheless, it remains higher than the pre-recession rate of 4.6% at the end of 2007.

Immigrant and U.S.-born Workers

  • Immigrants overall gained 2.1 million jobs in the economic recovery from 2009 to 2013, more than making up for the loss of 0.9 million jobs in the recession from 2007 to 2009. Even so, their employment rate rose modestly, from 60.5% in 2009 to 61.7% in 2013, and is still less than its 65% level in 2007.
  • U.S.-born workers added 4.3 million jobs in the recovery from 2009 to 2013, but they had lost 6.9 million jobs in the recession. Their employment rate is essentially unchanged in the recovery, standing at 58.1% in 2013 compared with 57.8% in 2009, and it remains less than its 62.5% level in 2007.
  • The unemployment rate for immigrants was 6.5% at the end of 2013, down from 10.2% at the end of 2009. Meanwhile, the unemployment rate for U.S.-born workers fell from 9.5% to 6.7%. The rate for each group was 4.6% at the start of the recession in 2007.

Whites, Blacks and Asians

  • Whites gained 1.7 million jobs in the recovery from 2009 to 2013 after losing 6.2 million jobs in the recession. Blacks gained 853,000 jobs in the recovery, less than the 1.1 million they lost in the recession. Jobs growth for Asians in the recovery—1.2 million—outdistanced the modest loss of 103,000 jobs in the recession.
  • The different experiences in jobs growth mirror differences in population growth. The Asian working-age population increased by 14.4% from 2009 to 2013, compared with only 1.6% for whites and 3.3% for blacks. In consistent fashion, the employment of Asians increased by 16.7% from 2009 to 2013, compared with 1.8% for whites and 5.9% for blacks.
  • With jobs growth reflecting population growth, the shares of people employed did not improve much for any group during the economic recovery. At the end of 2013, the employment rate was 59.3% for whites, 53.2% for blacks and 60.9% for Asians. At the end of 2009, when the recovery started, the employment rates had been 59.2% for whites, 51.9% for blacks and 59.7% for Asians. The employment rates for all groups are still less than their 2007 levels.
  • Unemployment rates for all racial groups fell during the economic recovery, down from 8% in 2009 to 5.2% in 2013 for whites, from 15.6% to 12.1% for blacks, and from 7.8% to 5.2% for Asians. When the recession started in 2007, the rates had been 3.7% for whites and Asians, and 8.6% for blacks.

Jobs Growth by Industry

  • The top three industries that led in jobs growth in the recovery from 2009 to 2013 are professional and other business services (1.7 million new jobs), hospitals and other health services (991,000 new jobs) and durable goods manufacturing (974,000 new jobs).
  • Hispanics found the greatest number of new jobs in the recovery in eating, drinking and lodging services (497,000 new jobs), wholesale and retail trade (401,000), and professional other business services (357,000).
  • For non-Hispanics, the leading sources of new jobs in the recovery were professional and other business services (1.3 million new jobs), hospitals and other health services (825,000) and durable goods manufacturing (725,000).
  • Total employment in the construction sector fell from 11.8 million in late 2007 to 9.4 million in late 2009. It was still at 9.4 million at the end of 2013.

Wages

  • The median weekly wage for all full-time workers was $785 in the fourth quarter of 2013, compared with $777 in the fourth quarter of 2007 (expressed in fourth-quarter 2013 dollars).
  • For full-time non-Hispanic workers, the median weekly wage increased from $823 in late 2007 to $840 in late 2013.
  • The median weekly wage of immigrants rose from $623 at the end of 2007 to $646 at the end of 2013. This was driven by gains for non-Hispanic immigrants; the median wage of Hispanic immigrants is unchanged since 2007.
  • The median weekly wage of full-time white workers increased from $856 in the fourth quarter of 2007 to $876 in the fourth quarter of 2013. Wages for full-time black and Asian workers in 2013, $640 and $923, respectively, were about the same as their levels in 2007.

The next section of this report describes economy-wide employment and unemployment trends during the Great Recession, from the fourth quarter of 2007 to the fourth quarter of 2009, and four years of recovery, from the fourth quarter of 2009 to the fourth quarter of 2013. Subsequent sections analyze trends among Hispanics and non-Hispanics, immigrant and U.S.-born workers, and for whites, blacks and Asians. The final two sections discuss changes in employment by industry and changes in the earnings of different groups of workers during the recession and the recovery. Methodological details and supplementary data tables are presented in the appendices.

About this Report

This report focuses on employment, unemployment and earnings among Hispanics and non-Hispanics, both U.S. born and foreign born, during the Great Recession and the economic recovery. The report also describes labor market outcomes for whites, blacks and Asians, and it analyzes the sources of job growth by industry for the different groups of workers. The recession is defined as the two-year period from the fourth quarter of 2007 to the fourth quarter of 2009. The recovery is the four-year period from the fourth quarter of 2009 to the fourth quarter of 2013.

The data for this report are derived from the Current Population Survey (CPS), a monthly survey of about 55,000 households conducted jointly by the Bureau of Labor Statistics (BLS) and the Census Bureau. Most of the analysis is conducted on a quarterly basis as data from three monthly surveys were combined to create larger sample sizes for individual groups of workers. Some estimates are based on annual files constructed from 12 monthly CPS surveys. Unless otherwise noted, the quarterly estimates in this report are not seasonally adjusted.

Estimates in this report are adjusted for annual technical revisions to the CPS and the benchmarking of survey weights to the 2010 Decennial Census. Thus, they do not match estimates published by the BLS that are not similarly revised (Appendix A provides details on this issue). Also, employment estimates in this report are from a survey of households and will not match the payroll estimates of employment published by the BLS from its surveys of employers. Payroll data cannot be used in this report because, except for gender, they do not record the demographic characteristics of workers.

This report was researched and written by Rakesh Kochhar. Jeffrey S. Passel contributed data analysis to the report, and Anna Brown assisted with data preparation. The author thanks Mark Hugo Lopez and Claudia Deane for comments and editorial guidance on earlier drafts of the report. Brown number-checked and formatted the report, and she and Michael Keegan produced the charts and tables. Marcia Kramer of Kramer Editing Services was the copy editor. Find related reports from the Pew Research Center’s Hispanic Trends Project online at pewresearch.org/Hispanic.

A Note on Terminology

The terms “Latino” and “Hispanic” are used interchangeably in this report.

All references to whites, blacks and Asians are to the non-Hispanic components of those populations. Whites, blacks and Asians are single-race-only groups. Asians include Native Hawaiian and Pacific Islanders.

“U.S. born” refers to those who are U.S. citizens at birth, namely people born in the U.S., Puerto Rico or other U.S. territories and those born abroad to at least one parent who was a U.S. citizen.

“Foreign born” refers to people born outside the U.S., Puerto Rico or other U.S. territories to parents neither of whom was a U.S. citizen.

The terms “foreign born” and “immigrant” are used interchangeably.

The term “unauthorized immigrant” is used to describe immigrants who are living in the U.S. illegally.

The terms “working-age population” and “workforce” are used interchangeably in the report to refer to the population of people ages 16 and older.

The term “labor force” refers to people ages 16 and older who are either employed or looking for employment.

Unless otherwise specified, the estimates in this report are nonseasonally adjusted and refer to the fourth quarter of each year. On occasion, these fourth-quarter estimates are referenced simply by the year. For example, an estimate for the fourth quarter of 2007 may be referred to as an estimate for 2007.
Chapter 1: Employment and Unemployment in the Recession and the Recovery

The jobs recovery still lacks momentum: The economy has not restored all of the jobs that were lost in the recession and is adding new jobs at a pace that is barely keeping ahead of the additional supply of workers. At the end of 2013, all major labor market indicators, such as employment and unemployment rates, trailed their pre-recession levels.

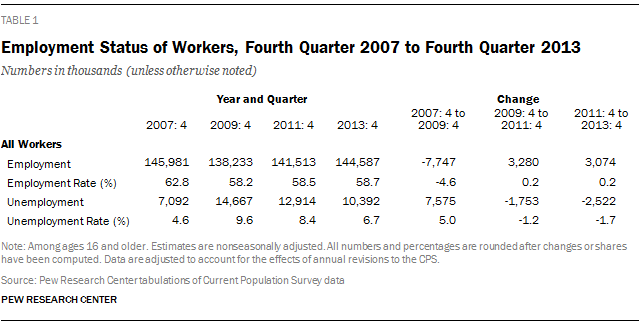
Some 7.7 million jobs were lost during the Great Recession, from the fourth quarter of 2007 to the fourth quarter of 2009. Four years hence, through the fourth quarter of 2013, the economy has restored only 6.4 million of those jobs as the process of hiring has been slow but steady.7 Some 3.3 million jobs were added from 2009 to 2011 and 3.1 million more were added from 2011 to 2013.8

Employment Status of Workers, Fourth Quarter 2007 to Fourth Quarter 2013

The rate at which jobs are returning is only slightly ahead of the rate at which the working-age population is growing. From 2009 to 2013, the working-age population increased by 9.2 million and the economy added 6.4 million jobs. In percentage terms, the population increased 3.9% and employment increased 4.6%. As a result, the employment rate, or the share of the working-age population that is employed, was only a bit higher in 2013 than at the end of 2009—58.7% compared with 58.2%. It remains several percentage points less than the pre-recession employment rate of 62.8% in the fourth quarter of 2007.

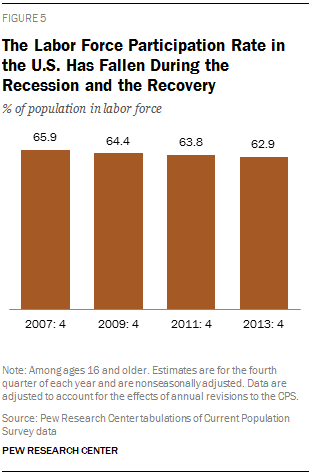
The Labor Force Participation Rate in the U.S. Has Fallen During the Recession and the Recovery

The number of Americans unemployed has fallen in the recovery, from 14.7 million in the fourth quarter of 2009 to 10.4 million in the fourth quarter of 2013. But that is still 3.3 million more than the 7.1 million who were unemployed in the fourth quarter of 2007. Even though the recovery has pushed the unemployment rate down from 9.6% in 2009 to 6.7% in 2013, it remains higher than the pre-recession rate of 4.6% in late 2007.

Perhaps not all of the decrease in the unemployment rate from 2009 to 2013 can be credited to the economy recovery. Some of it may be due to people leaving the labor force because they are discouraged by not being able to find work. People who stop looking for work are not counted as unemployed. The trend in the labor force participation rate—the share of the working-age population that is working or looking for work—supports this hypothesis as it has fallen even during the recovery, from 64.4% in 2009 to 62.9% in 2013.9

Chapter 2: The Jobs Recovery for Hispanics

By one measure, Hispanic workers have fared well in the recovery. The number of Hispanics with jobs increased from 20 million in the fourth quarter of 2009 to 22.7 million in the fourth quarter of 2013. The increase more than made up for the 0.4 million jobs lost by Hispanics during the recession.

However, the strong jobs recovery for Hispanics is more about demographics than improving economic conditions. The Hispanic working-age population is increasing rapidly, by 4 million from the fourth quarter of 2009 to the fourth quarter of 2013. Consequently, even with the sizable number of new jobs, the Hispanic employment rate has risen by only one percentage point during the recovery, from 59% in 2009 to 60% in 2013. That is significantly less than the 64.3% employment rate at the start of the recession in 2007.

Employment Status of Hispanics, Fourth Quarter 2007 to Fourth Quarter 2013

Unemployment among Hispanics rose sharply in the recession. The number of unemployed Hispanics increased from 1.3 million in the fourth quarter of 2007 to 2.9 million in the fourth quarter of 2009, and the unemployment rate for Hispanics jumped from 5.9% to 12.7%. Since 2009, the number of unemployed Hispanics has fallen to 2.2 million, a decrease of 0.7 million, and the unemployment rate has eased down to 8.8% in the fourth quarter of 2013. However, the unemployment rate for Hispanics is still about three percentage points higher than the rate prior to the onset of the recession.

U.S.-born Hispanics to the Forefront

The overall gain in employment for Hispanics conceals a significant disparity in the trends for U.S.-born and foreign-born workers. The vast majority of jobs gained from 2009 to 2013—2.3 million out of 2.8 million—was secured by U.S.-born Hispanics. Meanwhile, the roughly 450,000 new jobs acquired by Hispanic immigrants date to the first two years of the recovery, from 2009 to 2011. Since 2011, the employment of Hispanic immigrants has been at a standstill.

Employment Status of Hispanics, by Nativity, Fourth Quarter 2007 to Fourth Quarter 2013

Once again, the disparity in jobs gained among Latinos is explained by population change in recent years. The working-age population of U.S.-born Latinos swelled 21.9% from the fourth quarter of 2009 to the fourth quarter of 2013. Meanwhile, the Latino immigrant working-age population increased by only 2.2% (see Appendix B for the population data). Previous research by the Pew Research Center found that the population of unauthorized immigrants in the U.S., which is mostly Latino, peaked in 2007.10

Immigrants Are a Declining Share of Hispanic Workers Since the Start of the Recession

Because of these demographic changes, immigrants no longer account for the majority of Hispanic employment, a status they held for about two decades. The decline in the immigrant share has been fairly rapid, from 55% in the fourth quarter of 2007 to 49.7% in the fourth quarter of 2013.11 Because the U.S.-born Hispanic population is growing rapidly—and accounting for most of the growth in the Hispanic population—it is likely that the U.S. born will continue to be the majority of Latino workers unless the economic recovery triggers a new, rising tide of immigration.

In other respects, the experiences of U.S.-born and foreign-born Latinos have been similar through the recession and the recovery. Both experienced a sharp drop in the employment rate from the fourth quarter of 2007 to the fourth quarter of 2009, and both have failed to recoup the loss in its entirety through the end of 2013. For U.S.-born Latinos, the employment rate fell from 61.4% in 2007 to 56.8% in 2013, and for Latino immigrants the rate is down from 67% in 2007 to 63.7% in 2013.

The unemployment rates for U.S.-born and immigrant Latinos also remain higher than their levels in late 2007. For U.S.-born Latinos, the unemployment rate increased from 6.8% to 13.8% during the recession and retreated only to 10.3% by the end of 2013. For Latino immigrants, the unemployment rate also more than doubled in the recession, from 5.2% in the fourth quarter of 2007 to 11.8% in the fourth quarter of 2009. It had fallen to 7.2% by the end of 2013. The somewhat sharper drop in the unemployment rate for Latino immigrants during the recovery may be the result of “selective attrition,” i.e., those with dim job prospects in the U.S. may have returned to their country of origin or not entered the U.S. in the first place.12

Chapter 3: The Jobs Recovery for Non-Hispanics

Jobs growth for non-Hispanics has been relatively slow in the economic recovery. After losing 7.4 million jobs in the recession from 2007 to 2009, non-Hispanics gained only 3.6 million jobs during the recovery from 2009 to 2013. Thus, employment for non-Hispanics in the fourth quarter of 2013—121.8 million—was nearly 4 million less than the 125.6 million it had been in the fourth quarter of 2007.

Employment Status of Non-Hispanics, Fourth Quarter 2007 to Fourth Quarter 2013

The slow growth in jobs for non-Hispanics mirrors the slow growth in their working-age population. From 2009 to 2013, non-Hispanic employment increased by 3% and the working-age population increased by 2.5%. Thus, the employment rate for non-Hispanics is essentially unchanged, moving from 58.1% in 2009 to 58.4% in 2013. The unemployment rate, however, has fallen from 9% to 6.3% in the past four years. But both rates are yet to return to the levels that prevailed before the onset of the recession.

Generally, the gap in the rates at which Hispanics and non-Hispanics are gaining jobs is the result of long-run demographic trends. The Hispanic share of the U.S. working-age population increased from 13.6% in the fourth quarter of 2007 to 15.4% in the fourth quarter of 2013. In line with that, the Hispanic share of employment over that period increased from 13.9% to 15.7%.13

Non-Hispanic Immigrants Continue to Expand their Role in the U.S. Labor Market

The population of non-Hispanic immigrants continued to grow rapidly through the recession and the recovery. Since the influx of non-Hispanic immigrants is less driven by unauthorized immigrant flows and not as dependent as Hispanics on the construction sector, it has served to expand the role of non-Hispanic immigrants in the U.S. labor market.

The non-Hispanic immigrant working-age population increased by 14.7% from the fourth quarter of 2007 to the fourth quarter of 2013, rising from 18.2 million to 20.9 million. But the U.S.-born working-age population of non-Hispanics increased by only 2.9% over this six-year period, from 182.5 million in 2007 to 187.8 million in 2013 (see Appendix B).

The more rapid increase in the supply of immigrant workers among non-Hispanics translated into more rapid employment growth. Employment among non-Hispanic immigrants rose from 10.9 million in the fourth quarter of 2009 to 12.5 million in the fourth quarter of 2013, an increase of 1.6 million. That was more than enough to make up for the loss of 555,000 jobs in the recession.

Employment Status of Non-Hispanics, by Nativity, Fourth Quarter 2007 to Fourth Quarter 2013

Among U.S.-born non-Hispanics, employment rose from 107.3 million at the end of 2009 to 109.3 million at the end of 2013. That amounted to a gain of only 2 million jobs in the recovery, substantially less than the 6.8 million jobs lost by them in the recession.

Immigrants Are a Rising Share of Non-Hispanic Workers

The different rates at which the non-Hispanic U.S.-born and immigrant populations and employment levels are growing mean that the immigrant shares are increasing. The share of immigrants in the non-Hispanic working-age population rose from 9.1% in 2007 to 10% in 2013. In tandem, the immigrant share in non-Hispanic employment increased from 9.1% in 2007 to 10.3% in 2013.

There is little difference in how the employment and unemployment rates have trended for foreign-born and U.S.-born non-Hispanics since the recession started. The employment rate for the U.S. born fell from 62.5% in 2007 to 58.2% in 2013. Among immigrant non-Hispanics, the employment rate dropped from 63.1% in late 2007 to 60.1% in late 2013.

The unemployment rates for U.S.-born and foreign-born non-Hispanics are higher than their pre-recession levels by similar margins. For the U.S. born, the unemployment rate increased from 4.5% to 9.1% in the recession and came down to 6.4% by the end of 2013. For immigrants, the unemployment rate more than doubled in the recession, rising from 3.9% to 8.5%. It has since fallen to 5.9%.

A Slow Recovery for Whites, Blacks and Asians

Labor market outcomes for white, black and Asian workers have generally improved only modestly during the economic recovery. Employment growth for each group has hewn to the rate at which the working-age population for each group is growing. All workers—whites, blacks and Asians—are still looking to recover fully from the setbacks delivered by the recession.

The number of Asians with jobs in the fourth quarter of 2013—8.5 million—exceeded the 7.4 million employed at the start of the recession in the fourth quarter of 2007. But, like Hispanics, Asians are a rapidly growing segment of the U.S. population, and the share of the Asian workforce with a job is still depressed. More specifically, the employment rate for Asians fell from 64.1% in 2007 to 59.7% in 2009 and leveled off thereafter, standing at 60.9% in 2013.

Employment Status of White, Black and Asian Workers, Fourth Quarter 2007 to Fourth Quarter 2013

For whites, the number employed in 2013—95.4 million—is still 4.5 million less than the number employed in 2007. Whites lost 6.2 million jobs from 2007 to 2009 and have restored only 1.7 million jobs through the fourth quarter of 2013. Among blacks, the number employed in 2013—15.3 million—is about the same as the 15.5 million employed in 2007.

Employment growth for whites and blacks in the recovery appears to lag behind the growth observed for Hispanics and Asians. However, the white and black populations are increasing more slowly, and the shares that are employed have trended like they did for Hispanics and Asians, falling sharply in the recession and then recovering modestly. From 2007 to 2013, through the recession and the recovery, the employment rate for whites fell from 63.4% to 59.3%, and for blacks it fell from 57.7% to 53.2%, a loss of about four percentage points for each. The decrease in the employment rate was similar for Hispanics and Asians, four and three percentage points respectively.

The unemployment rates for whites, blacks and Asians are currently less than at the end of the recession but still far from sinking to the pre-recession rates. During the recession from 2007 to 2009, the unemployment rate for whites increased from 3.7% to 8%; for blacks, it increased from 8.6% to 15.6%; and for Asians, it rose from 3.7% to 7.8%. At the end of 2013, the unemployment rates for whites, blacks and Asians were 5.2%, 12.1% and 5.2%, respectively. For each group, the unemployment rate in the fourth quarter of 2013 is 41% higher than the rate in the fourth quarter of 2007.

Chapter 4: The Jobs Recovery for All Foreign-born and All U.S.-born Workers

Immigrants overall, Hispanic and non-Hispanic combined, assumed a greater share of the U.S. workforce and employment in 2013 than they did in 2007. That is because the ongoing inflow of non-Hispanic immigrants was sufficient to compensate for the reduced inflow of Hispanic immigrants. But since the recession started in 2007, both foreign-born and U.S.-born workers have experienced slower growth in employment than in the size of their workforces.

Immigrants, in total, gained 2.1 million jobs in the economic recovery from 2009 to 2013. That is considerably more than the loss of 0.9 million jobs in the recession. Their employment rate rose modestly in the recovery, from 60.5% in the fourth quarter of 2009 to 61.7% in the fourth quarter of 2013.

Employment Status of U.S.-born and Foreign-born Workers, Fourth Quarter 2007 to Fourth Quarter 2013

However, over the full cycle of the recession and the recovery, employment gains for immigrants did not keep pace with population growth. Thus, the 61.7% employment rate for immigrants in the fourth quarter of 2013 was still several percentage points less than the 65% it was in the fourth quarter of 2007.

U.S.-born workers gained 4.3 million jobs in the recovery. But their employment rate was unchanged, standing at 57.8% in the fourth quarter of 2009 and at 58.1% in the fourth quarter of 2013.

But the number of jobs held by U.S.-born workers in the fourth quarter of 2013 was still 2.6 million less than the number employed in the fourth quarter of 2007. Like immigrants, the U.S. born also have experienced a decline in the employment rate in the six years since the start of the recession, from 62.5% in 2007 to 58.1% in 2013.

Immigrants Overall Are a Rising Share of U.S. Workers

Unemployment rates have trended similarly for U.S.-born and foreign-born workers in the recession and the recovery. The unemployment rate for immigrants was 4.6% in the fourth quarter of 2007, on par with the rate for U.S.-born workers. After rising more sharply during the recession, the unemployment rate for immigrants dipped to 6.5% in the fourth quarter of 2013. That is about the same as the 6.7% unemployment rate among U.S.-born workers in 2013.

Because the foreign-born population is growing more rapidly than the U.S.-born population, the role of immigrants in the U.S. labor market continues to expand. In the past, this long-run demographic trend was driven by Latino immigrants. Since the start of the recession, the baton has passed to non-Hispanic immigrants. With respect to the working-age population, the share that is foreign-born rose from 15% in 2007 to 15.7% in 2013.14 Accordingly, the immigrant share in total employment increased from 15.5% in 2007 to 16.5% in 2013.

Chapter 5: Employment Change by Industry

The manufacturing and construction sectors were responsible for the vast majority of jobs lost in the recession. Manufacturing, durable and nondurable combined, eliminated 2.7 million jobs, and the construction sector shed 2.4 million jobs from the fourth quarter of 2007 to the fourth quarter of 2009. Together, these two sectors accounted for two-thirds of the 7.7 million total jobs loss.15

In the recovery, however, the two sectors have taken different paths. Manufacturing restored 1.4 million jobs from the fourth quarter of 2009 to the fourth quarter of 2013. Most of those jobs—974,000—are due to durable goods manufacturing. Meanwhile, employment in the construction sector was unchanged—it is estimated to have lost an additional 264,000 jobs from 2009 to 2011 and then to have added 258,000 jobs from 2011 to 2013.

Some industries added jobs even during the recession. Educational services and hospital and health services led the way, hiring 477,000 and 695,000 new workers, respectively, from 2007 to 2009. Growth in the health sector continued apace in the recovery as it added 991,000 jobs from 2009 to 2013, second only to professional and other business services (1.7 million new jobs in the recovery).

However, educational services reversed course in the recovery, shedding 248,000 jobs from 2009 to 2013, perhaps due to cutbacks in government expenditures. Other leading sources of lost jobs in the recovery are publishing, broadcasting, communication and information services (loss of 356,000 jobs) and public administration (loss of 234,000 jobs).

Employment Change for Hispanics by Industry

Industries in Which Hispanics Gained or Lost the Most Jobs During the Recession and Recovery

Hispanics working in the construction sector were the most vulnerable during the recession. They lost 686,000 jobs in the industry during the recession, and only 74,000 of those jobs have come back in the recovery. The share of Hispanics employed in construction fell from 14.2% in the fourth quarter of 2007 to 10% in the fourth quarter of 2013.

The vast majority of Latinos let go by the construction sector are immigrants. After losing 520,000 construction jobs in the recession, Latino immigrants experienced the loss of an additional 21,000 construction jobs in the recovery.16 Nearly one-in-five (19.4%) Latino immigrants worked in construction in 2007; by late 2013, the share had dropped to one-in-seven (14.4%).

Three sectors—eating, drinking and lodging services, wholesale and retail trade, and business services—account for the lion’s share of jobs gained by Latinos in the recovery. From 2009 to 2013, eating, drinking and lodging services added 497,000 jobs for Latinos, wholesale and retail trade hired 401,000, and professional and other business services absorbed 357,000. Collectively, those make up 45.5% of jobs growth for Latinos from 2009 to 2013.

Latinos lost jobs in one industry during the recovery, giving up 87,000 jobs in nondurable goods manufacturing. However, they also gained 249,000 jobs in durable goods manufacturing industry for a net gain in the manufacturing sector overall. The employment of Latinos in utilities and publishing, broadcasting, communication and information services was essentially unchanged from 2009 to 2013.

Employment Change for Non-Hispanics by Industry

Industries in Which Non-Hispanics Gained or Lost the Most Jobs During the Recession and the Recovery

Non-Hispanics continued to experience job losses in several industries during the economic recovery. Of the 18 industries delineated in this report, non-Hispanics gained jobs in 11 industries from 2009 to 2013 but lost jobs in the other seven. The industries that grew added 4.9 million jobs for non-Hispanics, and the industries that shrank subtracted 1.3 million for a net gain of 3.6 million jobs.

For non-Hispanics, jobs growth in the recovery was centered in three industries—professional and other business services (1.3 million new jobs from 2009 to 2013), hospitals and other health services (825,000), and durable goods manufacturing (725,000). Non-Hispanics also secured 527,000 new jobs in nondurable goods manufacturing for a total gain of 1.3 million manufacturing jobs during the recovery.

Job losses during the recovery for non-Hispanics were concentrated in publishing, broadcasting, communication and information services (378,000 jobs shed from 2009 to 2013), educational services (277,000) and public administration (265,000). Those add up to a loss of 920,000 jobs since late 2009.

Chapter 6: Wages in the Recession and the Recovery

The median weekly wage is unchanged since the recession started in late 2007. For workers overall, full time and part time combined, the median weekly wage in the fourth quarter of 2013 was $673, the same as in the fourth quarter of 2007 (wages expressed in fourth-quarter 2013 dollars.17

Median Weekly Wage

The median weekly wage first increased during the recession, from $673 in 2007 to $690 in 2009. That is likely due to the fact that less-skilled workers are typically let go in greater numbers during recessions. But wages have fallen during the economic recovery, a not unexpected consequence of the enormous slack that continues to exist in the labor market. The median weekly wage fell as low as $668 in the fourth quarter of 2011 and was still at the pre-recession level at the end of 2013.

This general pattern—wages increasing in the recession, falling initially in the recovery, and starting to flatten more recently—also describes the experiences of most individual groups of workers. For full-time workers, the median weekly wage rose from $777 in 2007 to $809 in 2009 and currently stands at $785. For part-time workers, the median weekly wage increased from $225 to $243 during the recession and dropped to $228 by late 2013.18

Wages of Hispanic Workers

The earnings of Hispanic workers are currently a little bit higher than what they were in 2007. For full-time Hispanic workers, the median weekly wage in the fourth quarter of 2013 was $570, compared with $556 in the fourth quarter of 2007. It had risen to $593 in the fourth quarter of 2009. Following the same up-and-down pattern, the weekly earnings of part-time Hispanic workers rose from $222 in 2007 to $242 in 2009, and then settled at $225 in 2013.

Median Weekly Wage for U.S.-born and Foreign-born Hispanics

Although the wages of Hispanic workers are estimated to have risen since 2007, this may not be a sign of real economic progress. Consider, for example, the earnings of U.S.-born Latinos. Among U.S.-born Latinos working full time, median weekly earnings fell from $684 in 2007 to $640 in 2013, a loss of 6.4%. The weekly wages of U.S.-born Latinos working part time dropped from $214 in 2007 to $204 in 2013, a loss of 4.5%. Meanwhile, wages of Latino immigrants, both full-time and part-time workers, were unchanged.

So why did wages for Latinos overall increase from 2007 to 2013? The answer, most likely, is in the changing composition of the Latino workforce. As noted earlier in this report, the immigrant share of the Hispanic workforce has fallen steeply since the start of the recession, from 55% in late 2007 to 49.7% in late 2013. Because Hispanic immigrants earn less than U.S.-born Hispanics, their retreat from the U.S. workforce raises the estimated earnings of Latinos overall.

The slowdown in immigration may have raised the floor on estimated earnings of Latinos via another channel. With replenishment from new arrivals easing up rapidly, the median age of the Hispanic immigrant workforce jumped from 37.6 in 2007 to 41.3 in 2013.19 Because earnings generally increase with age, the rise in median age may be disguising an underlying drop in the earnings of foreign-born Hispanics.

Wages of Non-Hispanic Workers

The earnings of non-Hispanic workers also increased during the recession and then decreased in the first two years of the recovery. This was true for both full-time and part-time workers. But the script for full-time and part-time workers diverged in the past two years. From 2011 to 2013, full-time non-Hispanic workers recouped some of the losses they experienced from 2009 to 2011, but the earnings of part-time non-Hispanic workers continued to decrease.

Median Weekly Wage for U.S.-born and Foreign-born Non-Hispanics

Among full-time non-Hispanic workers, earnings in the fourth quarter of 2013 were at least as high as what they were in the fourth quarter of 2007. For all full-time non-Hispanic workers, the median weekly wage increased from $823 in 2007 to $840 in 2013, or by 2%. Meanwhile, the median weekly wage for U.S.-born non-Hispanics moved from $819 to $828, and for the foreign born they increased from $856 to $903. It is possible that the stronger gain in earnings for immigrants signals a more selective inflow of immigrants.

Wages for part-time non-Hispanic workers fluctuated during the recession and the recovery but ended up unchanged at the end of the six-year period. For all part-time non-Hispanic workers, the median hourly wage in 2013 was $230, virtually the same as its level in 2007. The same is true for U.S.-born and foreign-born non-Hispanics, whose weekly earnings in 2013 were $228 and $250, respectively.

References

Bullard, James. 2014. “The Rise and Fall of Labor Force Participation in the United States.” St. Louis: Federal Reserve Bank of St. Louis Review, April.

Di Natale, Marisa L. 2003. “Creating Comparability in CPS Employment Series.” Washington, D.C.: Bureau of Labor Statistics.

Gordon, Robert J. 2014. “The Demise of U.S. Economic Growth: Restatement, Rebuttal, and Reflections.” Cambridge, MA: National Bureau of Economic Research, February.

Hanson, Gordon H. and Craig McIntosh. 2009. “The Demography of Mexican Migration to the United States.” American Economic Review, May.

Krogstad, Jens Manuel and Mark Hugo Lopez. 2014. “Hispanic Nativity Shift: U.S. Births Drive Population Growth as Immigration Stalls.” Washington, D.C.: Pew Research Center, April.

Passel, Jeffrey S. and D’Vera Cohn. 2010. “U.S. Unauthorized Immigration Flows Are Down Sharply Since Mid-Decade.” Washington, D.C.: Pew Research Center, September.

Passel, Jeffrey S., D’Vera Cohn and Ana Gonzalez-Barrera. 2012. “Net Migration from Mexico Falls to Zero—and Perhaps Less.” Washington, D.C.: Pew Research Center, April.

Passel, Jeffrey S., D’Vera Cohn and Ana Gonzalez-Barrera. 2013. “Population Decline of Unauthorized Immigrants Stalls, May Have Reversed.” Washington, D.C.: Pew Research Center, September.

Summers, Lawrence. 2013. “Why stagnation might prove to be the new normal.” Financial Times, December.

U.S. Census Bureau. 2006. “Design and Methodology: Current Population Survey.” October.

Appendix A: Revisions of the Current Population Survey

The U.S. Census Bureau makes adjustments to the population controls in the Current Population Survey each January. That means the sample weights are revised so that estimates from the CPS agree with pre-specified national population totals by age, sex, race and Hispanic origin and with state level totals by age, sex and race. The annual adjustments to CPS weights are typically based on revised estimates of net international migration and updated vital statistics. Methodological changes also play a role. In the 2007 and 2008 population estimates, introduced into the CPS in January 2008 and January 2009, respectively, the Census Bureau made significant changes in the methodology used to measure international migration from 2000 onward. Another major revision was the introduction of the Census 2010 population base in January 2012.

The effect of the revision in January 2012, incorporating the new population base and other updated information, was to increase the estimate of the working-age population by 1,510,000, the labor force by 258,000 and the number of employed workers by 216,000 (“Adjustments to Household Survey Population Estimates in January 2012,” Bureau of Labor Statistics, February 2012). The effect of the annual revision in January 2013 was to increase the estimate of the working-age population by 138,000, the labor force by 136,000 and the number of employed workers by 127,000 (“Adjustments to Household Survey Population Estimates in January 2013,” Bureau of Labor Statistics, February 2013). Rates—for employment, labor force participation and unemployment—are either not affected or only slightly affected by the January CPS revisions.

The annual revisions of the CPS affect the comparability of labor force statistics over time. For example, the BLS-published estimate of the working-age population in December 2011 is 240,584,000, and the published estimate for January 2012 is 242,269,000 (nonseasonally adjusted). These estimates imply that the working-age population increased by 1,685,000 from December 2011 to January 2012. However, most of this increase—1,510,000 of the 1,685,000—is simply the result of revisions to the CPS in January 2012.

Labor market statistics published by the BLS are not revised historically to account for the effect of annual revisions to CPS weights or for the effect of introducing the Census 2010 population base. The estimates in this report are adjusted in two ways to account for the revisions of the CPS. First, the estimates for 2007 to 2008 are produced using reweighted data that incorporate the Vintage 2008 population estimates for the civilian non-institutional population (Vintage 2008 population controls were introduced into the CPS in January 2009). The new weights are derived using procedures that follow the weighting procedures of the U.S. Census Bureau (2006) to the extent possible with public-use data applied to Vintage 2008 population estimates—both published and unpublished data supplied by the U.S. Census Bureau to the Pew Research Center (see Passel and Cohn, 2010, for additional details).

Second, estimates for 2007 to 2012 are revised to account for the effects of CPS revisions from January 2010 to January 2013 using a BLS-published methodology (Di Natale, 2003). This methodology is used to produce revised estimates for the overall Hispanic and non-Hispanic populations, and for the white, black and Asian populations after making adjustments to remove Hispanics from these racial groups. The overall revisions to the Hispanic and non-Hispanic estimates are further allocated by nativity based on the distributions of the populations by nativity in any given quarter.

Two Estimates of the Hispanic Working-Age Population: BLS-Published and Adjusted by Pew Research for Revisions to Current Population Survey Data, First Quarter 2006 to Fourth Quarter 2013

The main result of adjusting for the effects of the CPS revisions is to produce a smoother time series of the working-age population. This can be seen in the chart that shows the Hispanic working-age population from the first quarter of 2006 to the fourth quarter of 2013 before and after adjusting for CPS revisions. The revised series of CPS data leads to more accurate measures of changes over time in the working-age population, labor force and employment of various racial, ethnic and nativity groups.

Appendix B: Data Tables

Labor Market Status of Racial and Ethnic Groups, Fourth Quarter 2007 to Fourth Quarter 2013
Labor Market Status of Racial and Ethnic Groups, Fourth Quarter 2007 to Fourth Quarter 2013 (Continued)
Labor Market Status of Men and Women, Fourth Quarter 2007 to Fourth Quarter 2013
Labor Market Status of Men and Women, by Ethnicity, Fourth Quarter 2007 to Fourth Quarter 2013
Labor Market Status of Men and Women, by Ethnicity, Fourth Quarter 2007 to Fourth Quarter 2013 (Continued)
Labor Market Status of the Working-Age Population, by Nativity, Fourth Quarter 2007 to Fourth Quarter 2013
Labor Market Status of the Working-Age Population, by Nativity and Ethnicity, Fourth Quarter 2007 to Fourth Quarter 2013
Labor Market Status of the Working-Age Population, by Nativity and Ethnicity, Fourth Quarter 2007 to Fourth Quarter 2013 (Continued)
Employment of Hispanics, by Industry, Fourth Quarter 2007 to Fourth Quarter 2013
Employment of U.S.-born Hispanics, by Industry, Fourth Quarter 2007 to Fourth Quarter 2013
Employment of Foreign-born Hispanics, by Industry, Fourth Quarter 2007 to Fourth Quarter 2013
Employment of Non-Hispanics, by Industry, Fourth Quarter 2007 to Fourth Quarter 2013
Employment of U.S.-born Non-Hispanics, by Industry, Fourth Quarter 2007 to Fourth Quarter 2013
Employment of Foreign-born Non-Hispanics, by Industry, Fourth Quarter 2007 to Fourth Quarter 2013
Median Weekly Wages of Full-time Workers
Median Weekly Wages of Part-time Workers