
Pew Research Center

FOR RELEASE NOVEMBER 15, 2013

Remittances to Latin America Recover—but Not to Mexico

1. Overview Remittances to Spanish-speaking Latin American countries overall have recovered from a decline during the recent recession, with the notable exception of Mexico, according to World Bank data analyzed by the Pew Research Center. Migrants’ remittances to Mexico, an estimated $22 billion in 2013, are 29% below their 2006 peak. For all other Spanish-speaking […]

BY D’Vera Cohn, Ana Gonzalez-Barrera and Danielle Cuddington

FOR MEDIA OR OTHER INQUIRIES:

Communications Department
202.419.4372
www.pewresearch.org

RECOMMENDED CITATION

Pew Research Center, November 2013, "Remittances to Latin America Recover—but Not to Mexico"

About Pew Research Center

Pew Research Center is a nonpartisan, nonadvocacy fact tank that informs the public about the issues, attitudes and trends shaping the world. It does not take policy positions. The Center conducts public opinion polling, demographic research, computational social science research and other data-driven research. It studies politics and policy; news habits and media; the internet and technology; religion; race and ethnicity; international affairs; social, demographic and economic trends; science; research methodology and data science; and immigration and migration. Pew Research Center is a subsidiary of The Pew Charitable Trusts, its primary funder.

© Pew Research Center 2026

Table of contents

  • About Pew Research Center
  • Remittances to Latin America Recover—but Not to Mexico
  • 2. Remittance Trends
  • 3. Sources of Remittances to Latin America
  • References
  • Appendix: Individual Country Trends

Remittances to Latin America Recover—but Not to Mexico

1. Overview Remittances to Spanish-speaking Latin American countries overall have recovered from a decline during the recent recession, with the notable exception of Mexico, according to World Bank data analyzed by the Pew Research Center. Migrants’ remittances to Mexico, an estimated $22 billion in 2013, are 29% below their 2006 peak. For all other Spanish-speaking […]

1. Overview

Total Remittances Received in Latin America and Mexico, 2000-2013

Remittances to Spanish-speaking Latin American countries overall have recovered from a decline during the recent recession, with the notable exception of Mexico, according to World Bank data analyzed by the Pew Research Center.

Migrants’ remittances to Mexico, an estimated $22 billion in 2013, are 29% below their 2006 peak. For all other Spanish-speaking Latin American nations overall, the 2013 estimate of $31.8 billion slightly surpasses the 2008 peak.

Remittances from all sources to Spanish-speaking Latin American countries have more than doubled since 2000 but remain below their peak in 2007, the year in which the U.S. Great Recession began. The 2013 estimated total ($53.8 billion) is 13% below 2007’s $61.6 billion (in 2013 U.S. dollars).

The United States is the most important source of money sent home by migrants to the 17 Latin American nations as a group (including Mexico) that are the focus of this report. U.S. remittances accounted for three-quarters of the total in 2012—$41 billion out of $52.9 billion, according to World Bank data.

Mexico Falls, Latin America Overall Recovers

The decrease for Latin America overall was fueled by a falloff in remittances to Mexico, which receives more than 40% of all remittances to Latin America. If Mexico is excluded, remittance totals to Spanish-speaking Latin American countries as a whole have recovered after dropping during the U.S. recession years of 2007 to 2009. They bounced back in most of the other individual Spanish-speaking Latin American nations with remittances of more than $500 million a year. Of the dozen other nations, seven are estimated to have higher remittances in 2013 than during the U.S. recession years of 2007 to 2009.

Share of Latin America Remittances from Top Sending Countries, 2012

Remittances to Mexico peaked in 2006, a year earlier than the recent high point for Spanish-speaking Latin American nations as a whole. Aside from a single-year increase in 2011, they have fallen each year since then. Other countries in which 2013 estimated remittance flows have not recovered from declines during the U.S. recession years of 2007 to 2009 are Argentina, Colombia, Costa Rica, Dominican Republic and Ecuador.

However, in seven other Spanish-speaking Latin American countries, remittances either have rebounded from declines during the recession years of 2007 to 2009 or did not fall markedly during those years. In Bolivia, El Salvador, Guatemala and Honduras, remittances are estimated to be higher in 2013 than at their peak before the recession. In Nicaragua, Paraguay and Peru, remittances did not decline and have continued to rise.

The decline in remittances to Mexico—nearly all of which come from the U.S.—is linked to economic changes in the U.S., where one-in-ten Mexican-born people live (Passel, Cohn and Gonzalez-Barrera, 2012). The U.S. housing market crash hurt Mexican immigrants for whom the construction industry is a major job source, although a World Bank analysis concludes that the housing market’s link to remittance totals has weakened since 2011 (World Bank, 2013).

Another factor in the fall of remittances to Mexico could be the decline in the Mexican immigrant population in the U.S. since the onset of the recession, due to decreased arrivals and increased departures, including deportations. A Pew Research Center analysis of government data found that recent migration from the U.S. to Mexico equals and possibly exceeds migration from Mexico to the U.S. through at least 2012 (Passel, Cohn and Gonzalez-Barrera, 2012).

Remittance Patterns

Remittances: A Definition

“Remittances” are funds or other assets sent to their home countries by migrants, either themselves or in the form of compensation for border, short-term and seasonal employees (World Bank, 2013). Most funds come directly from migrants; compensation accounts for a single-digit share of remittances in most Latin American nations (World Bank, 2011).

Data in this report are provided by the World Bank and follow World Bank definitions adopted from the International Monetary Fund nations (World Bank, 2013). In some cases, trend analysis is restricted to nations with more than $500 million in annual remittances, where year-to-year trends are less volatile.

The World Bank reports only remittances sent via formal channels, such as banks and other businesses that transfer money. If unofficial remittances were counted, the total could be as much as 50% higher or more, according to household surveys and other evidence cited by the World Bank (World Bank, 2005).

In 2013, the World Bank revised its definition of remittances to delete a category of capital transfers between households. The World Bank also revised previously published numbers back to 2005 to reflect the change.

This change had a particularly large impact on Brazil, reducing the total remittance amounts considerably. It had less impact on other Latin American nations (World Bank, 2013). The 2013 estimates and the 2005-2013 trend data in this report employ the new definition. The 2005 and 2012 data on size of flows from one country to another have not been updated by the World Bank to reflect the new definition, so those may differ somewhat from trend data.

When reporting trends over time in remittance flows, amounts for years before 2013 are adjusted to 2013 dollars, using the average U.S. inflation rate for every preceding year. For this reason, some numbers in this report differ from unadjusted data published by the World Bank.

Remittances from the U.S. to Spanish-speaking Latin American countries are concentrated in countries closest to the U.S. border. Mexico alone receives more than half—$23 billion in 2012. The share rises to four-fifths when three adjacent countries are added in: Guatemala ($4.4 billion), El Salvador ($3.6 billion) and Honduras ($2.6 billion).

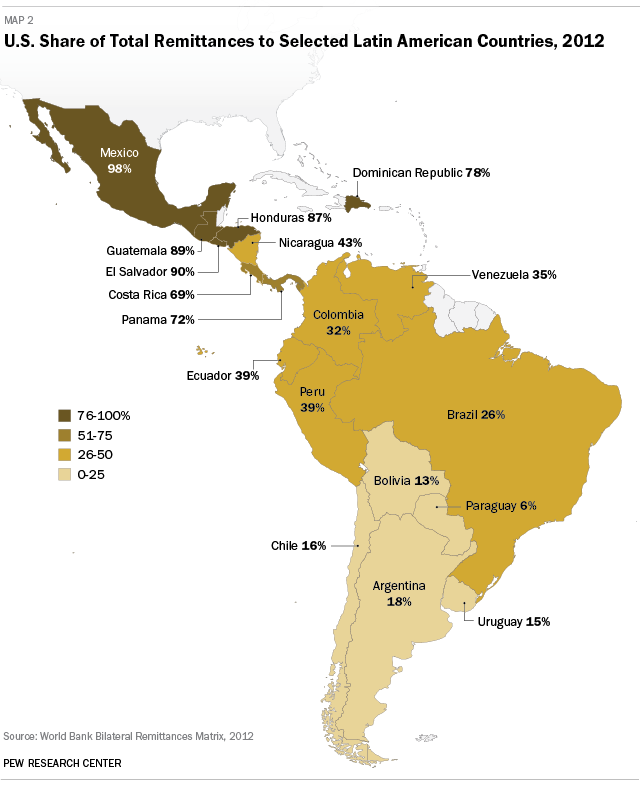
U.S. residents are the source of nearly all remittance money received in Mexico (98% in 2012) and of the majority of remittance money received in six other Spanish-speaking Latin American nations: Costa Rica, Dominican Republic, El Salvador, Guatemala, Honduras and Panama. Remittance amounts from the U.S. are higher than any other nation to three more countries, Colombia, Peru and Venezuela.

Spain, the next-largest sending nation to Spanish-speaking Latin American countries, contributed 8% of 2012 remittances, or $4 billion. Canada, which ranked third, sent 1% of remittances to these countries, or $704 million in 2012.

As is true of Latin America, the U.S. also is the largest source of remittances worldwide, sending a total of $123.3 billion in 2012, according to World Bank data. Saudi Arabia ($27.6 billion in 2012) is next, followed by Canada ($23.9 billion).

Among all countries, the largest recipient of remittances is India, with an estimated $71 billion in 2013. China ranks second ($60.2 billion), followed by the Philippines ($26.1 billion). Mexico ranks fourth.

Impact and Use of Remittances

Remittances as a Share of GDP, 2012

Remittances are a larger source of money to Latin America than official foreign aid. In 2011, when foreign aid to Spanish-speaking Latin America nations totaled $6.2 billion, formal remittances were more than eight times that—$53.1 billion. Foreign aid totals less than remittances in each Spanish-speaking Latin American nation except Chile and Peru.

Money sent home by migrants represents a varying share of the gross domestic product throughout Spanish-speaking Latin America. The highest shares are in three Central American nations, according to the World Bank: El Salvador (16.5% in 2012), Honduras (15.7%) and Guatemala (10.0%).

What is the impact of remittances? On the macro level, the World Bank has included remittance inflows in its measure of creditworthiness since 2009, so nations with high levels of formal remittances may be allowed to borrow more money than they otherwise could. At the household level, as might be expected, those who receive remittances have higher incomes, spend more and are less likely to be extremely poor than those who do not receive remittances (Ratha, 2013).

U.S. Share of International Emigrants and Remittances

A significant part of remittances, often the majority, is spent on food, clothing and other day-to-day needs, according to research. Although there is variation by country, a significant, but smaller, share goes to saving and investment, especially among households that no longer include young children (Massey et al., 2012). Households that receive remittances also are more likely than those that do not to spend money on health care and education (Ratha, 2013).

However, research is inconclusive about the impact of remittances on a receiving nation’s economy. Some studies have found that labor force participation declines in households that receive remittances, which hurts economic growth (Chami et al., 2003). Other studies focused on the impact of remittances in Mexico have found that at the state level remittances improve regional labor markets by raising employment levels (Orrenius et al., 2012).

The average cost of sending remittances to Latin America was 7.3% in late 2013, according to the World Bank, a decline from past years (World Bank, 2013a). The growing role of technology, especially mobile banking and online money transfers, has made it easier to send money home (Orozco, 2012). It also has made it easier, along with improved measurement methods by banks, for governments and central banks to track remittances. Lower costs, improved technology and better tracking have played a role in increasing the sum of formal remittances, and some research suggests that these factors, not fundamental economic changes, likely account for most growth in formal remittances over the 2000s (Orrenius et al., 2012)

Who Sends Remittances Home?

Remittances Received, 2013 estimates

Remittance totals are strongly linked to the size of a particular country’s immigrant population in the U.S. and the share of its emigrants who live in the U.S. For example, the four Latin American nations that get the highest share of their remittances from the U.S.—Mexico, El Salvador, Guatemala and Honduras—also are the top four in terms of the share of their emigrants who live in the U.S. The Latin American nations with the lowest share of remittances from the U.S.—Uruguay, Bolivia and Paraguay—also have the lowest share of emigrants living in the U.S.

Most immigrants do send remittances home, and so do some people born in the U.S.; a Pew Research Center survey in 2008 found that 54% of foreign-born Hispanics and 17% of U.S.-born Hispanics say they send money to their home country (Lopez, Livingston and Kochhar, 2009).

Some research has found that foreign-born U.S. citizens and legal permanent residents are less likely to send remittances than unauthorized immigrants who may have less attachment to the U.S. and more to their home country (Massey et al., 2012).

This report is based mainly on data on remittances compiled by the World Bank, including overall trends for 2000 to 2013 as well as country-to-country flows for 2012. To add context to the remittance findings, the report also uses World Bank data on foreign aid and GNP, as well as 2012 estimates from the U.S. Census Bureau’s American Community Survey on the immigrant population in the U.S. from selected Latin American nations.
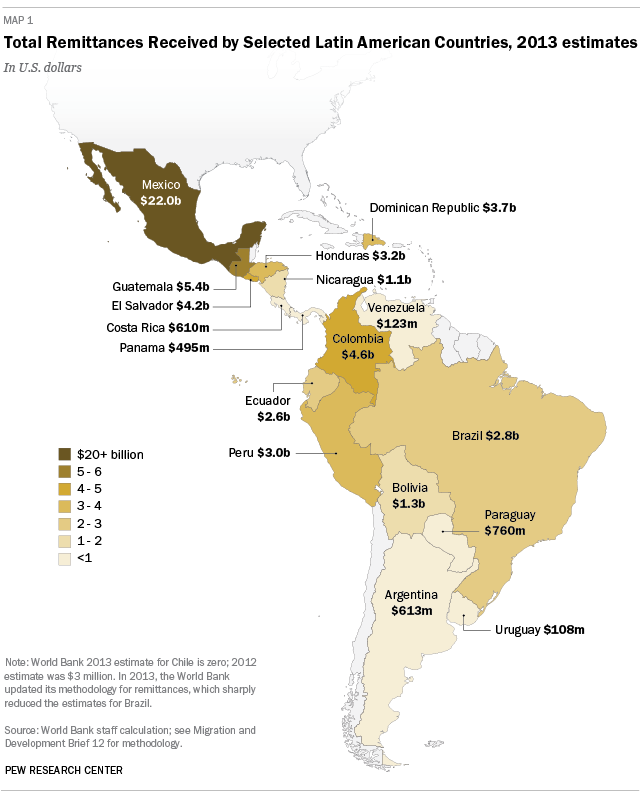
Total Remittances Received by Selected Latin American Countries, 2013 estimates
U.S. Share of Total Remittances to Selected Latin American Countries, 2012

About this Report

This report examines official flows of remittances, including overall trends from 2000 to 2013 as well as contributions from the U.S. in 2005 and 2012, with a particular focus on 17 Spanish-speaking nations in Latin America: Argentina, Bolivia, Chile, Colombia, Costa Rica, Dominican Republic, Ecuador, El Salvador, Guatemala, Honduras, Mexico, Nicaragua, Panama, Paraguay, Peru, Uruguay and Venezuela. Data also are included separately about Brazil. The data in this report, both for remittances and other economic indicators, are derived from the World Bank. Data on immigrant populations in the U.S. come from the U.S. Census Bureau’s American Community Survey. This report was written by D’Vera Cohn, Ana Gonzalez-Barrera and Danielle Cuddington. The authors thank Mark Hugo Lopez, Jon Cohen, Rakesh Kochhar, Jeffrey Passel and Paul Taylor for editorial guidance and data analysis and Dilip Ratha for supplying 2005 data about U.S. remittances to Latin America. Anna Brown number-checked the report. Marcia Kramer was the copy editor. Find related reports from the Pew Research Center’s Hispanic Trends Project online at pewresearch.org/pewresearch-org/hispanic.

A Note on Terminology

The terms “Latino” and “Hispanic” are used interchangeably in this report.

Unless otherwise specified, references to Latin America comprise the following Spanish-speaking countries: Argentina, Bolivia, Chile, Colombia, Costa Rica, Dominican Republic, Ecuador, El Salvador, Guatemala, Honduras, Mexico, Nicaragua, Panama, Paraguay, Peru, Uruguay and Venezuela. Cuba is not included because of lack of available data. Totals for Brazil are included separately.

“Remittances” include money sent via formal channels by migrants themselves, as well as compensation of employees working in other countries. Compensation generally accounts for a small fraction of the total. See text box on page 6 for more detail.

“Adults” refer to those ages 18 and older.

2. Remittance Trends

Overall, remittances to Spanish-speaking Latin America countries have more than doubled since 2000 in real dollars. Those Latin American nations received $22.9 billion in remittances in 2000, a figure that rose to an estimated $53.8 billion in 2013, according to World Bank data.

Looking at trends since 2000, the onset of the U.S. Great Recession interrupted what had been a steady upward trend from 2000 to 2007. Remittances to the 17 nations that are the focus of this report peaked at $61.6 billion in 2007, and then fell in each of the following three years, to $52.6 billion in 2010. Remittances rose in 2011 to $54.2 billion, but decreased to $53.7 billion in 2012 and held steady at an estimated $53.8 billion in 2013. Thus, in 2013, overall remittances to Latin America were 13% short of their 2007 peak.

Remittances to Mexico, 2000-2013

A decline in remittances to Mexico was the main reason for the overall decrease after 2011. Overall remittances to Mexico—nearly all of which come from the U.S.—are estimated to total $22 billion in 2013, according to the World Bank, compared with $10.2 billion in 2000. Remittances to Mexico peaked at $30.8 billion in 2006, a year earlier than for Latin America as a whole. Aside from a single-year increase in 2011, remittances to Mexico have decreased each year since then.

The reduced remittances to Mexico were reflected in the findings of a 2008 survey by the Pew Research Center’s Hispanic Trends Project. Among Hispanic immigrants who had sent remittances in the previous two years, 71% said they sent less in the past year than the year before (Lopez, Livingston and Kochhar, 2009). In addition, immigration from Mexico has declined to the point that the number of Mexicans arriving in the U.S. could be smaller than the number who are leaving (Passel, Cohn and Gonzalez-Barrera, 2012).

The next four sub-sections look at trends from 2000 to 2013 for 12 other Spanish-speaking nations in Latin America with annual remittances of at least $500 million. Bolivia, El Salvador, Guatemala and Honduras had remittance drops during the recession years, but have recovered. Nicaragua, Paraguay and Peru did not have notable declines during the recession and totals have since risen. Argentina, Colombia, Costa Rica, Dominican Republic and Ecuador, like Mexico, have not recovered from remittance declines during the recession years.

Data for the remaining nations (Chile, Panama, Uruguay and Venezuela), as well as for Brazil, and charts for each nation, can be found in Appendix A.

Countries Where Remittances Fell, but Recovered

Trends, 2000-2013: Nations Where Remittances Declined and Recovered

Remittances to Bolivia have risen steeply since 2000—the estimated total in 2013 ($1.3 billion) is more than seven times higher than in 2000 ($172 million). The growth (mainly before 2007) was sharper than for Latin America as a whole, and Bolivian remittances also differed from the pattern for Latin America overall by recovering from their decline during the Great Recession. Remittances to Bolivia generally rose to a peak of $1.2 billion in 2008, and then declined for two years before rising again.

Remittances to El Salvador, which totaled $2.4 billion in 2000, rose to $4.2 billion in 2007 before drifting down and then up again. In 2013, El Salvador received an estimated $4.2 billion in remittances, about equal to its peak total. El Salvador remittances are mainly from the U.S., which was the source of 90% of that country’s remittances in 2012.

Guatemala also receives most of its remittances—89% in 2012—from the U.S. Guatemalan remittances overall grew from $810 million in 2000 to $4.8 billion in 2008, about a sixfold increase. After declining in 2009, remittances to Guatemala have risen again since then, to total an estimated $5.4 billion in 2013, higher than the previous peak.

Honduras, which received 87% of its remittances from the U.S. in 2012, also has recovered from a decline in remittances during the Great Recession. Honduras received $657 million in remittances in 2000, which rose to a peak of $3.1 billion in 2008. Remittances declined for a year before rising again; in 2013, they reached an estimated $3.2 billion.

Countries Where Remittances Continue to Rise

Trends, 2000-2013: Nations Where Remittances Have Risen

Remittances to Nicaragua have risen steadily since 2000, with only a slight dip during the Great Recession. In 2000, $435 million in remittances were sent to Nicaragua, rising to $891 million in 2008. After a relatively small decline in 2009 (to $840 million), remittances began rising again. In 2013, they totaled an estimated $1.1 billion.

Remittances to Paraguay, $378 million in 2000, grew to an estimated $760 million in 2013, according to World Bank data. Remittances declined or stayed about the same from 2001 to 2005 (although a change in World Bank methodology could have affected the trend; see text box on page 6). Remittances grew in 2006 and leveled off or grew slowly through 2010. Remittances grew rapidly after that; the estimated total of $760 million for 2013 is 73% higher than it was in 2010.

In Peru, overall remittances grew from $975 million in 2000 to an estimated $3 billion in 2013. Remittances were relatively level from 2000 to 2002, grew to $2.7 billion in 2008, and remained level or grew through 2013.

Countries Where Remittances Fell and Did Not Recover

Trends, 2000-2013: Nations Where Remittances Fell and Have Not Recovered

Over the 2000-2013 period, remittances to Argentina peaked in 2008, at $758 million, after rising each year before that, according to World Bank data. Since then, totals have been up and down. In 2013, estimated remittances of $613 million were about a fifth lower than at their recent peak but more than five times what they had been in 2000 ($117 million).

Remittances to Colombia have followed a jagged pattern of rise and fall since 2000, when they totaled $2.2 billion. They rose from 2000 to 2003 and leveled off for two years before rising to a peak of $5.3 billion in 2008. Remittances to Colombia declined or leveled off from 2009 to 2012 before rising again to an estimated $4.6 billion in 2013. As explained in the next section, besides the U.S., a notable share of remittances to Colombia come from Venezuela and Spain, two economies that are still struggling.

Remittances to Costa Rica, about two-thirds of which come from the U.S., rose sharply from 2000 ($185 million) to 2007 ($697 million). Remittance totals fell or leveled off after that until resuming their upward climb in 2012. In 2013, Bolivia received an estimated $610 million in remittances.

In the Dominican Republic, which receives three-quarters of its remittances from the U.S., money sent home by migrants has grown by about half since 2000, when it totaled $2.5 billion. Remittances peaked at $3.9 billion in 2008, and have been up and down somewhat since then. In 2013, the Dominican Republic received an estimated $3.7 billion in remittances.

Remittances to Ecuador totaled $1.8 billion in 2000, then rose to a peak of $3.8 billion in 2007 before falling or leveling off. In 2013, Ecuador received an estimated $2.6 billion in remittances, about a third lower than its peak total. Spain is the main contributor of remittances to Ecuador, followed by the U.S.

Comparing 2005 and 2012 U.S. Remittances

Although yearly data showing U.S. remittances to Latin American nations has not been published, the Pew Research Center analyzed an unpublished World Bank database of U.S. remittances in 2005, two years before the start of the Great Recession. A comparison of 2005 to 2012 U.S. remittances shows that the total sent to Spanish-speaking Latin American nations rose 10% over the period in real terms, from $37.3 billion in 2005 to $41 billion in 2012.

However, the change varied greatly among individual nations. U.S. remittances to Mexico—the largest destination country—declined slightly (3%) in real terms, from $23.6 billion in 2005 to $22.8 billion in 2012. Remittances to Colombia fell 18% in real dollars from 2005 to 2012.

However, among other countries with total remittances of $500 million or more, all had double-digit percentage increases in remittance growth from the U.S. since 2005. In three countries, the amount more than doubled: Bolivia (135%), Paraguay (119%) and Honduras (115%). U.S. remittances to Panama, which received 72% of its remittances from the U.S. in 2012, also grew sharply—by 181% between 2005 and 2012.

As a result of these differing trajectories, there were changes in rank among the top 10 recipients of U.S. remittances. Honduras received more remittances in 2012 than Colombia, the reverse of their positions in 2005. Similarly, Peru received somewhat more than Ecuador in 2012 remittances, a reversal from 2005.

Remittances and Other Economic Indicators

Remittances are an important contributor to the economies of some Latin American nations. In 2012, according to World Bank data, remittances accounted for about 10% or more of GDP in four nations: El Salvador (16.5%), Honduras (15.7%), Guatemala (10%) and Nicaragua (9.7%).

However, for most Latin American nations, remittances make up a far smaller share of GDP. In 2012, they amounted to less than 1% of GDP in Argentina, Chile, Uruguay and Venezuela.

Total Remittances from the U.S. per Immigrant Adult Living in the U.S., 2012

According to the World Bank (World Bank, 2013), remittances worldwide amount to nearly three times the size of foreign aid, or official development assistance. In Spanish-speaking Latin America, according to World Bank data for 2011 (the latest available), remittances ($53.1 billion) amount to more than eight times the total of foreign aid to the region ($6.2 billion).

The size of the difference between remittances and foreign aid varies by nation. Remittances are about 34 times the amount of foreign aid in Nicaragua, and about 10 times or more foreign aid in Costa Rica, Dominican Republic, Ecuador and El Salvador. At the other end of the scale, remittances are less than twice foreign aid in Bolivia. In Chile and Peru, remittances are less than foreign aid.

The total amount of remittances sent to each Latin American country from the U.S. is linked to the size of each country’s foreign-born adult population in the U.S. Likewise, the share of remittances to each country that comes from the U.S. is closely linked to the share of that nation’s emigrants who live in the U.S.

Mexico, with by far the largest adult population in the U.S. (10.8 million in 2012) received the largest total remittances.1 Guatemala, fourth-ranked in adult population, ranked second in total remittances. The Dominican Republic, third-ranked in adult population in the U.S., was the fourth-largest remittance recipient in 2012.

However, the per capita amount of remittance sent home has less to do with population size in the U.S. Although Mexicans send home the largest total of remittances, they ranked ninth among 16 Spanish-speaking Latin American nations in remittances per capita in 2012. Similarly, Colombia ranked fifth in adult population size in 2012 but 10th in per capita remittances.

Meanwhile, Costa Rica ranked 15th in adult population size in 2012 but third in per capita remittances. Guatemala, fourth-ranked in adult population size, sent home the highest per capita remittances in 2012. Honduras, ranked sixth for adult population, sent home the second-highest per capita remittance.

3. Sources of Remittances to Latin America

The United States is the single largest source of remittances to Spanish-speaking Latin America, accounting for $41 billion of the $52.9 billion in money sent home by migrants in 2012. Funds transferred to Latin America account for a third (33%) of remittances from the U.S., according to World Bank data analyzed by the Pew Research Center.

Although about three-quarters (78%) of all remittances to Spanish-speaking Latin American countries come from the U.S., the share varies widely from country to country. In Mexico, 98% of remittances are sent from the U.S.; in Paraguay, 6% are. Mexico also towers over other Latin American countries in the amount of U.S. remittances it receives: $22.8 billion in 2012, accounting for more than half of money transferred to the region from the U.S. The nation with the next highest amount—Guatemala—received $4.4 billion.

Of the 17 Spanish-speaking countries that are the focus of this report, the U.S. is the main source of remittances to seven. In addition to Mexico, the U.S. is the source of the majority 0f remittance money received in El Salvador, Guatemala, Honduras, Dominican Republic, Panama and Costa Rica, in order of share from the U.S. It is the largest sending country of remittances to Peru, Colombia and Venezuela.

Spain sends more than the U.S. in remittances to Argentina, Bolivia, Ecuador, Paraguay and Uruguay.

Remittances to Latin America from Other Countries

Remittances to Brazil

Remittances to Brazil are estimated at $2.8 billion in 2013, according to World Bank figures. This reflects a sharp reduction from $4.9 billion in 2012, but the change is due mainly to a revised definition of remittances that removed a category of capital transfers between households (see text box in Chapter 1).

The World Bank has adjusted remittance totals to Brazil from 2005 onward to reflect the new definition. Looking at trends from 2005 to 2013, remittances to Brazil peaked at $4 billion in 2008. Remittances declined from 2009 ($3.1 billion) to 2012 ($2.6 billion). Remittances to Brazil in 2013 are estimated at $2.8 billion.

Brazil receives about a quarter of its remittances from the U.S. (26% in 2012).

Additional data about remittances to Brazil can be found in Appendix A.

In terms of total remittances to Latin America, Spain, which sent $4 billion and supplied 8% of remittances, ranked second to the U.S. in 2012. Canada, which sent $704 million and supplied 1% of remittances, ranked third.

The countries with the highest shares of remittances from Spain are Ecuador (44%) and Bolivia (42%). Spain also supplies about a third of the remittances to Argentina (35%) and Venezuela (31%) and more than a quarter of remittances to Uruguay (29%).

In terms of dollars, Spain also contributed more to Ecuador than to any other Latin American nation ($1.2 billion). The other top destination countries in 2012 were Colombia ($751 million), Peru ($472 million), Bolivia ($431 million) and Dominican Republic ($417 million).

However, a number of Latin American nations receive a notable share of remittance funds from countries other than the U.S. or Spain. Among the 14 Spanish-speaking Latin American nations with $500 million or more in 2012 remittances, six—Argentina, Bolivia, Colombia, Nicaragua, Paraguay and Peru—received more than 40% of those dollars from countries other than the U.S. or Spain. Other countries within Latin America are among the other major sources of remittances; for example Venezuela is the second-largest source of remittances to Colombia, after the U.S.

Percentage of Total Country Remittances from Spain, 2012

Argentina, which received 47% of its $573 million in 2012 remittances from nations other than the U.S. or Spain, did not receive a notably large share from any nation other than those two.

In 2012, Bolivia received 45% of its $1 billion in remittances from nations other than the U.S. or Spain. Spain ($431 million) contributed the largest amount, followed by Argentina ($301 million) and the U.S. ($130 million).

The U.S. was the largest contributor ($1.3 billion) in 2012 to Colombia’s $4.1 billion in remittances, followed by Venezuela ($1.1 billion) and Spain ($751 million). Colombia received half (49%) of its remittances from nations other than the U.S. or Spain in 2012.

Nicaragua received $1 billion in remittances in 2012, 56% of it from nations other than the U.S. or Spain. Costa Rica ($444 million) was the largest source of remittances to Nicaragua in 2012, followed by the U.S. ($430 million) and Spain ($18 million).

Paraguay received $872 million in remittances in 2012; 59% of that amount ($512 million) came from Argentina.

Peru received 44% of its $2.8 billion in 2012 remittances from nations other than the U.S. or Spain. The U.S. ($1.1 billion) and Spain ($472 million) were the top source countries, followed by Italy ($236 million).

References

Chami, Ralph, Connel Fullenkamp and Samir Jahjah. 2003. “Are Remittance Flows a Source of Capital for Development?” International Monetary Fund Working Paper 03/189. Washington, DC: International Monetary Fund.

Connor, Phillip. 2012. “Faith on the Move: The Religious Affiliation of International Migrants.” Washington, DC: Pew Research Center’s Religion & Public Life Project, March.

International Monetary Fund. 2011. Balance of Payments and International Investment Position Manual, Sixth edition. Washington, DC.

Lopez, Mark Hugo, Gretchen Livingston and Rakesh Kochhar. 2009. “Hispanics and the Economic Downturn: Housing Woes and Remittance Cuts.” Washington, DC: Pew Research Center’s Hispanic Trends Project, January.

Massey, Douglas S., Jorge Durand and Karen A. Pren. 2012. “Migradollars in Latin America: A Comparative Analysis.” Chapter 12 in “Migration and Remittances from Mexico: Trends, Impacts and New Challenges.” Alfredo Cuecuecha and Carla Pederzini, eds. Lanham, MD: Lexington Books.

Orozco, Manuel. 2012. “Future Trends in Remittances to Latin America and the Caribbean.” Washington, DC: Inter-American Dialogue, May.

Orrenius, Pia M., Madeline Zavodny, Jesus Canas and Roberto Coronado. 2012. “Remittances as an Economic Development Engine: Regional Evidence from Mexico.” Chapter 10 in “Migration and Remittances from Mexico: Trends, Impacts and New Challenges.” Alfredo Cuecuecha and Carla Pederzini, eds. Lanham, MD: Lexington Books.

Passel, Jeffrey, D’Vera Cohn, and Ana Gonzalez-Barrera. 2012. “Net Migration from Mexico Falls to Zero—and Perhaps Less.” Washington, DC: Pew Research Center’s Hispanic Trends Project, April.

Ratha, Dilip. 2013. “The Impact of Remittances on Economic Growth and Poverty Reduction.” Washington, DC: Migration Policy Institute, September.

World Bank. 2005. Global Economic Prospects 2006: Economic Implications of Remittances and Migration. Washington, DC: World Bank.

World Bank. 2011. Migration and Remittances Factbook 2011. Washington, DC: World Bank.

World Bank. 2013. “Migration and Remittance Flows: Recent Trends and Outlook: 2013-2016.”  Washington, DC: World Bank, October.

World Bank, 2013a. “Remittance Prices Worldwide.” Washington, DC: World Bank, September.

Appendix: Individual Country Trends

Remittances Received by Bolivia
Remittances Received by Chile
Remittances Received by Colombia
Remittances Received by Costa Rica
Remittances Received by Dominican Republic
Remittances Received by Ecuador
Remittances Received by El Salvador
Remittances Received by Guatemala
Remittances Received by Mexico
Remittances Received by Nicaragua
Remittances Received by Panama
Remittances Received by Peru
Remittances Received by Uruguay
Remittances Received by Venezuela
Remittances Received by Brazil