
Pew Research Center

FOR RELEASE AUGUST 29, 2013

Mapping the Latino Population, By State, County and City

I. Overview The nation’s Hispanic population, while still anchored in its traditional settlement areas, continues to disperse across the U.S., according to a Pew Research Center analysis of U.S. Census Bureau data. Today, the 100 largest counties by Hispanic population contain 71% of all Hispanics. Los Angeles County, CA alone contains 4.9 million Hispanics, or […]

BY Anna Brown and Mark Hugo Lopez

FOR MEDIA OR OTHER INQUIRIES:

Communications Department
202.419.4372
www.pewresearch.org

RECOMMENDED CITATION

Pew Research Center, August 2013, "Mapping the Latino Population, By State, County and City"

About Pew Research Center

Pew Research Center is a nonpartisan, nonadvocacy fact tank that informs the public about the issues, attitudes and trends shaping the world. It does not take policy positions. The Center conducts public opinion polling, demographic research, computational social science research and other data-driven research. It studies politics and policy; news habits and media; the internet and technology; religion; race and ethnicity; international affairs; social, demographic and economic trends; science; research methodology and data science; and immigration and migration. Pew Research Center is a subsidiary of The Pew Charitable Trusts, its primary funder.

© Pew Research Center 2026

Table of contents

  • About Pew Research Center
  • Mapping the Latino Population, By State, County and City
  • II. Ranking Latino Populations in the States
  • III. Ranking Latino Populations in the Nation’s Counties
  • IV. Ranking Latino Population’s in the Nation’s Metropolitan Areas
  • References
  • Appendix Tables

Mapping the Latino Population, By State, County and City

I. Overview The nation’s Hispanic population, while still anchored in its traditional settlement areas, continues to disperse across the U.S., according to a Pew Research Center analysis of U.S. Census Bureau data. Today, the 100 largest counties by Hispanic population contain 71% of all Hispanics. Los Angeles County, CA alone contains 4.9 million Hispanics, or […]

I. Overview
PH-2013-08-latino-populations-1-01

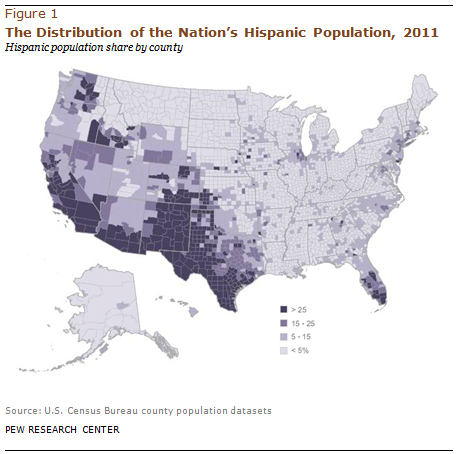
The nation’s Hispanic population, while still anchored in its traditional settlement areas, continues to disperse across the U.S., according to a Pew Research Center analysis of U.S. Census Bureau data.

Today, the 100 largest counties by Hispanic population contain 71% of all Hispanics. Los Angeles County, CA alone contains 4.9 million Hispanics, or 9% of the nation’s Hispanic population. But the share of all Hispanics who live in these same counties has fallen from 75% in 2000 and 78% in 1990 (Fry, 2008), reflecting Hispanic population growth outside of these 100 counties.

Half (52%) of those counties are in three states—California, Texas and Florida. Along with Arizona, New Mexico, New York, New Jersey and Illinois, these eight states contain three-quarters (74%) of the nation’s Latino population. But with the dispersal of the U.S. Latino population across the country, this share too is down from 79% in 2000 and 84% in 1990.

The geographic settlement patterns are to some degree aligned with the diverse countries of origin of the Hispanic population. For example, Mexican origin Hispanics are the dominant group in the Los Angeles-Long Beach metropolitan area, making up 78% of the area’s Hispanics. They are also the dominant group in many metropolitan areas in the border states of Arizona, California, New Mexico and Texas. But along the East Coast the composition of Hispanic origin groups differs. In the New York-New Jersey metropolitan area, Puerto Ricans and Dominicans are the dominant Hispanic origin groups. In Miami-Hialeah, FL, Cubans are the dominant Hispanic group and in the Washington, D.C. metropolitan areas, Salvadorans are the largest Hispanic origin group among that area’s Hispanics. Nationally, Mexicans are the largest Hispanic origin group, making up 64.6% of all Hispanics (Lopez, Gonzalez-Barrera, Cuddington, 2013).

PH-2013-08-latino-populations-1-02

Latinos are the nation’s largest minority group and among its fastest growing populations. According to the U.S. Census Bureau (2013), the Latino population in 2012 was 53 million, making up 17% of the U.S. population.1 Latino population growth between 2000 and 2010 accounted for more than half of the nation’s population growth (Passel, Cohn and Lopez, 2011).

This report examines U.S. Hispanic population rankings in the 50 states and the District of Columbia, the nation’s more than 3,000 counties, and the 60 largest Hispanic metropolitan areas. Accompanying this report are demographic and economic statistical profiles of the Hispanic population in each of the 50 states and the District of Columbia and the 60 largest metropolitan areas by Hispanic population. Also accompanying the report is a database of the Hispanic population in the nation’s counties. Along with the demographic and economic profiles is an interactive map showing key Hispanic population characteristics in all 50 states and the District of Columbia, an interactive map, interactive table and interactive graphics showing Hispanic population characteristics in the 60 largest metropolitan areas by Hispanic population, and interactive maps showing the size, share and growth in the Hispanic population in each of the nation’s counties between 1980 and 2011.

About this Report

This report examines the geographic distribution and demographic characteristics of the U.S. Hispanic population in the 50 states and the District of Columbia, the nation’s more than 3,000 counties, and the 60 largest metropolitan area populations by Hispanic population. The data for this report are derived from the 2011 American Community Survey (1% IPUMS), the 2010 Census (5% IPUMS), and U.S. Census Bureau county population datasets.

Accompanying this report are demographic and economic profiles of the Hispanic population in each of the 50 states and the District of Columbia; a database documenting the Hispanic population in the nation’s counties; and demographic and economic profiles of the Hispanic population in the 60 metropolitan areas with the largest Hispanic populations. Also accompanying this report is an interactive map showing key characteristics in each state and the District of Columbia; interactive maps showing the size, share and growth in the Hispanic population in each of the nation’s counties between 1980 and 2011; an interactive map and table showing the 60 largest metropolitan areas by Hispanic population and a table showing the largest population and shares for the ten largest Hispanic origin groups—Mexicans, Puerto Ricans, Cubans, Salvadorans, Dominicans, Guatemalans, Colombians, Hondurans, Ecuadorians and Peruvians.

This report was written by Anna Brown, Research Assistant, Pew Research Center’s Hispanic Trends Project and Mark Hugo Lopez, Director of Hispanic Research, Pew Research Center. Paul Taylor, Sara Goo, Eileen Patten and Danielle Cuddington provided comments. Eileen Patten and Danielle Cuddington number-checked the report. Bruce Drake was the copy editor.

A Note on Terminology

The terms “Latino” and “Hispanic” are used interchangeably in this report.

“Native born” refers to persons who are U.S. citizens at birth, including those born in the United States, Puerto Rico or other U.S. territories and those born abroad to parents at least one of whom was a U.S. citizen.

“Foreign born” refers to persons born outside of the United States, Puerto Rico or other U.S. territories to parents neither of whom was a U.S. citizen.

II. Ranking Latino Populations in the States

Hispanic Population

  • PH-2013-08-latino-populations-2-01

    More than half (55%) of the U.S. Hispanic population resides in three states: California, Texas, and Florida. California has the nation’s largest Hispanic population, with about 14.4 million Hispanics. California’s Hispanic population alone accounts for more than one-fourth (28%) of U.S. Hispanics.

  • Eight states have a Hispanic population of over one million: California, Texas, Florida, New York, Illinois, Arizona, New Jersey, and Colorado.2
  • In New Mexico, Hispanics make up 46.7% of the state’s population, the highest Hispanic population share among the 50 states and District of Columbia. Maine, West Virginia, and Vermont were among those with the lowest Hispanic population shares, at 1% each.
  • PH-2013-08-latino-populations-2-02

    Over the last decade, some of the fastest growing Latino populations are in the southeastern U.S.

  • States that have experienced the largest percentage increases in their Latino populations all have Latino populations of less than 1 million.
  • As a group, the 10 states with the fastest growing Hispanic populations together accounted for 11% of the growth in the nation’s Hispanic population between 2000 and 2011. By contrast, the 10 most populous Hispanic states together accounted for 69% of the growth in the nation’s Hispanic population during the same period.
  • PH-2013-08-latino-populations-2-03

    Alabama’s Hispanic population grew 158% between 2000 and 2011, more than any other state.

  • Among all states and the District of Columbia, New York had the smallest Hispanic population percentage growth with an increase of 22% between 2000 and 2011. No state experienced a decline in its Hispanic population during the period.

Hispanic Origin

  • Mexicans are the largest Hispanic origin group in seven of the top 10 largest states by Hispanic population. The exceptions are New York, where Puerto Ricans are the largest Hispanic group, making up 33% of the state’s Hispanic population; New Jersey, where Puerto Ricans are the largest Hispanic origin group and make up 29% of New Jersey’s Hispanic population; and Florida where Cubans are the largest Hispanic origin group, accounting for three-in-ten (30%) Hispanics in the state.
  • PH-2013-08-latino-populations-2-04

    The diversity of Hispanic origin varies widely by state, where the dominant group accounts for 29% to 91% of the state’s Hispanic population (among the top 10 states by Hispanic population) and between 5% and 33% of a state’s total population.

  • Mexicans are the largest Hispanic origin group in the U.S., accounting for 65% of the Hispanic population. However in 11 states—Florida, New York, New Jersey, Connecticut, District of Columbia, Hawaii, Maryland, New Hampshire, Pennsylvania, Massachusetts and Rhode Island—Mexicans are not the dominant Hispanic group.3

Nativity

  • PH-2013-08-latino-populations-2-05

    More than half (54%) of Hispanics in the District of Columbia are foreign born, a share greater than any of the 50 states. Among North Dakota’s Hispanics, 6% are foreign born, the lowest share among the 50 states and the District of Columbia.

  • The ranking by foreign-born Hispanic population, though, tells a different story. California has more Hispanic immigrants—5.4 million—than any other state. Overall, they make up 37% of the state’s Hispanic population.

III. Ranking Latino Populations in the Nation’s Counties

  • PH-2013-08-latino-populations-3-01

    Los Angeles County has by far the largest Hispanic population at 4.8 million, accounting for 9% of the U.S. Hispanic population. The next nine largest counties by Hispanic population fall between one and two million Hispanic residents.

  • Together these 10 counties account for almost one-third (30%) of the country’s Hispanic population.
  • The 25 largest counties by Hispanic population together contain 46% of the nation’s Hispanic population.
  • Los Angeles County, though, only ranks fourth among these top 10 counties in share of Hispanics among the total population at 48%. Miami-Dade County is among only two counties in the top 10 that are over 50% Hispanic.
  • Among all 3,143 counties in the U.S., 87 are majority Hispanic. Of those, 56 are in Texas.
  • PH-2013-08-latino-populations-3-02

    Among counties with a Hispanic population of at least 1,000 in 2011, Stewart County in Georgia experienced the most growth in the Hispanic population since 2000, growing 1,754% over 11 years.

  • Among the nation’s 3,143 counties, 3,018 experienced positive growth in their Hispanic population, with the notable exception of New York County which has a Hispanic population of 410,681 and experienced a 2% population decline since 2000. Overall, 114 counties saw a decline in their Hispanic population between 2000 and 2011.
  • PH-2013-08-latino-populations-3-03

    Of the 10 fastest growing counties by Hispanic population growth (that had a Hispanic population of at least 1,000 in 2011), three are located in Georgia.

  • The 10 largest counties by Hispanic population accounted for 22% of the growth in the nation’s Hispanic population. By contrast, the 10 fastest growing counties accounted for less than 1% of the growth in the nation’s Hispanic population.

IV. Ranking Latino Population’s in the Nation’s Metropolitan Areas

Hispanic Population

  • PH-2013-08-latino-populations-4-01

    More than four-in-ten (44%) Hispanics live in the 10 largest metropolitan areas, by Hispanic population.4

  • The Los Angeles-Long Beach, CA, metropolitan area has the nation’s largest Latino population—5.8 million—and alone accounts for about one-in-ten (11%) Latinos nationally.5 The New York-Northeastern New Jersey metropolitan area is the second largest by Latino population (4.3 million) and is home to 8% of Latinos nationwide.
  • Two states contain six of the 10 largest Hispanic metropolitan populations. California has three– Los Angeles (#1), Riverside-San Bernardino (#4) and San Francisco-Oakland-Vallejo (#9). Texas is also home to three of the 10 largest Hispanic metropolitan areas— Houston-Brazoria (#3), Dallas-Fort Worth (#6) and San Antonio (#10). The other four largest Hispanic metropolitan populations are New York (#2); Chicago, IL (#5); Miami-Hialeah, FL (#7); and Phoenix, AZ (#8). Overall, each of the 10 largest Hispanic metropolitan areas has a Hispanic population of more than 1 million and Hispanics are the largest minority group in each.
  • PH-2013-08-latino-populations-4-02

    The Hispanic share of the total population in each of the 10 largest metro areas ranges from a low of 21% in Chicago to a high of 65% in Miami. Miami and San Antonio (55%) are the only two metro areas among the 10 largest where Hispanics are a majority of the population. Among the top 60 metropolitan areas, Hispanics account for half or more in an additional 11.6

  • Among the 60 metropolitan areas with the largest Latino populations, two have populations that are almost entirely Latino. The population of Laredo, TX, metropolitan area—with the 37th largest Latino population—is 95% Latino. The McAllen-Edinburg-Pharr-Mission, TX, metropolitan area—which has the 13th largest Hispanic population—is 91% Latino.
  • From 2000 to 2011, the Hispanic population increased in every one of the top 60 metropolitan areas. The population increase ranged from a low of 14% in Los Angeles (which has the largest Hispanic population overall, and whose overall total population increased by 5%) to a high of 197% in Indianapolis (the 60th largest, and which experienced a total population increase of 16%).
  • Compared with the Hispanic growth, these top 60 metro areas experienced more modest overall population changes in the same time period, from a high of a 43% increase among three areas (Fort Myers, FL, Las Vegas, NV, and Austin, TX) to a low of a slight decrease or no change among another three cities. Providence, RI, experienced no overall population change, while Salinas, CA, and Detroit, MI, saw decreases of 3% and 4% during that period, respectively.

Hispanic Origin7

  • PH-2013-08-latino-populations-4-03

    Among the 10 largest metropolitan areas by Hispanic population, Mexicans are the largest Hispanic origin group in eight. The Mexican share of the Hispanic population in these eight areas ranges from a low of 70% in the San Francisco metropolitan area to a high of 91% in Phoenix.

  • In Miami and New York, Mexicans are not the largest Hispanic origin group. More than half (54%) of the Miami metropolitan area’s Hispanic population is Cuban. In the New York metropolitan area, Puerto Ricans are the largest Hispanic group, making up 28% of all Hispanics. They are closely followed by Dominicans, who make up 21% of the area’s Hispanic population.
  • Mexicans are the largest Hispanic origin group in 49 of the top 60 metro areas, and they account for 95% or more of the Hispanic population in eight metro areas in the top 60. The Mexican share is highest in McAllen, TX, where they account for nearly all (98%) of the area’s Hispanics.8

Nativity

  • PH-2013-08-latino-populations-4-04

    In Miami, two-thirds (66%) of the Hispanic population is foreign born, a share higher than any of the top 60 metro areas and the only top 10 metro area in which more than half of Hispanics are foreign born.

  • By contrast, only 17% of Hispanics in the San Antonio area are foreign born. For U.S. Hispanics overall, the foreign-born share is 36%.
  • Among the top 60 metro areas by Hispanic population, Corpus Christi, TX, has the lowest foreign-born share among Hispanics at 8%. Corpus Christi is the 46th largest metropolitan area by Hispanic population and is the only metropolitan area in the top 60 where fewer than one-in-ten Hispanics were born outside the U.S.
  • From 2000 to 2011, the foreign-born Hispanic population increased in all of the top 60 metro areas by Hispanic population except for one— Los Angeles (a decline of 3%). The greatest change was in Fort Myers, FL, with an increase of 211% among Hispanics born outside the U.S. Including Fort Myers, seven metro areas experienced a growth of more than 100% among the foreign-born Hispanic population between 2000 and 2011.
  • In the same time period, the native-born population was also increasing—and at a generally higher rate. The greatest increase, of 281%, occurred in Raleigh, NC. A total of thirteen metro areas, including Raleigh, experienced growth of greater than 100% among their native-born Hispanic populations. The smallest increase was in Salinas, CA (20%).

References

Fry, Richard. 2008. “Latinos Account for Half of U.S. Population Growth Since 2000.” Washington, D.C.: Pew Hispanic Center, October.

Lopez, Mark Hugo, Ana Gonzalez-Barrera and Danielle Cuddington. 2013. “Diverse Origins: The Nation’s 14 Largest Hispanic-Origin Groups.” Washington, D.C.: Pew Hispanic Center, June.

Passel, Jeffrey, D’Vera Cohn and Mark Hugo Lopez. 2011. “Hispanics Account for More than Half of Nation’s Growth in Past Decade.” Washington, D.C.: Pew Hispanic Center, March.

U.S. Census Bureau. 2013. “Asians Fastest-Growing Race or Ethnic Group in 2012.” Washington, D.C., June.

Appendix Tables

PH-2013-08-latino-populations-A-02
PH-2013-08-latino-populations-A-03
PH-2013-08-latino-populations-A-04
PH-2013-08-latino-populations-A-05