
Pew Research Center

FOR RELEASE FEBRUARY 4, 2013

The Path Not Taken

Two-thirds of legal Mexican immigrants are not U.S. citizens

BY Ana Gonzalez-Barrera, Mark Hugo Lopez, Jeffrey S. Passel and Paul Taylor

FOR MEDIA OR OTHER INQUIRIES:

Communications Department
202.419.4372
www.pewresearch.org

RECOMMENDED CITATION

Pew Research Center, February 2013, "The Path Not Taken"

About Pew Research Center

Pew Research Center is a nonpartisan, nonadvocacy fact tank that informs the public about the issues, attitudes and trends shaping the world. It does not take policy positions. The Center conducts public opinion polling, demographic research, computational social science research and other data-driven research. It studies politics and policy; news habits and media; the internet and technology; religion; race and ethnicity; international affairs; social, demographic and economic trends; science; research methodology and data science; and immigration and migration. Pew Research Center is a subsidiary of The Pew Charitable Trusts, its primary funder.

© Pew Research Center 2026

Table of contents

  • About Pew Research Center
  • The Path Not Taken
  • II. Recent Trends in Naturalization, 2000-2011
  • III. Who Naturalizes: Reasons for Naturalizing
  • IV. Reasons for Not Naturalizing
  • References
  • Appendix A: Additional Charts and Tables
  • Appendix B: 2012 National Survey of Latinos Methodology
  • Appendix C: 2012 National Survey of Latinos Topline

The Path Not Taken

Two-thirds of legal Mexican immigrants are not U.S. citizens

Overview
PHC-2013-02-04-Naturalization-1-01

Nearly two-thirds of the 5.4 million legal immigrants from Mexico who are eligible to become citizens of the United States have not yet taken that step. Their rate of naturalization—36%—is only half that of legal immigrants from all other countries combined, according to an analysis of Census Bureau data by the Pew Hispanic Center, a project of the Pew Research Center.

Creating a pathway to citizenship for immigrants who are in the country illegally is expected to be one of the most contentious elements of the immigration legislation that will be considered by Congress this year. Mexican immigrants are by far the largest group of immigrants who are in the country illegally—accounting for 6.1 million (55%) of the estimated 11.1 million in the U.S. as of 2011.

Mexicans are also the largest group of legal permanent residents—accounting for 3.9 million out of 12 million. The Center’s analysis of current naturalization rates among Mexican legal immigrants suggests that creating a pathway to citizenship for immigrants in the country illegally does not mean all would pursue that option. Many could choose an intermediate status—legal permanent resident—that would remove the threat of deportation, enable them to work legally and require them to pay taxes, but not afford them the full rights of U.S. citizenship, including the right to vote.
PHC-2013-02-04-Naturalization-1-02

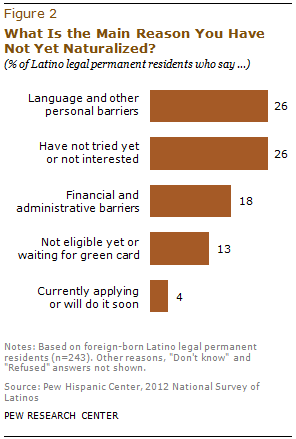
A nationwide survey of Hispanic immigrants by the Pew Hispanic Center finds that more than nine-in-ten (93%) who have not yet naturalized say they would if they could. Asked in an open-ended question why they hadn’t naturalized, 26% identified personal barriers such as a lack of English proficiency, and an additional 18% identified administrative barriers, such as the financial cost of naturalization. The survey also revealed that among Hispanic legal permanent residents, just 30% say they speak English “very well” or “pretty well.” (See Appendix table A2.)

The last time the United States government created a pathway to citizenship for immigrants in the country illegally was in 1986 with the passage of the Immigration Reform and Control Act (IRCA). A 2010 study by the U.S. Department of Homeland Security found that about 40% of the 2.7 million immigrants who obtained a green card derived from IRCA had naturalized by 2009 (Baker, 2010).

This report is based on two main data sources. Latino immigrant attitudes about naturalization come from a nationally representative bilingual telephone survey of 1,765 Latino adults, including 899 immigrants. The margin of error for the full sample is plus or minus 3.2 percentage points at the 95% confidence level; for foreign-born Latinos, the margin of error is plus or minus 4.4 percentage points. For a full description of the survey methodology, see Appendix B.

Data on naturalization trends among legal immigrants are based on a Pew Hispanic Center analysis of the U.S. Census Bureau’s Current Population Survey (CPS). The CPS is a monthly survey of about 55,000 households conducted jointly by the U.S. Bureau of Labor Statistics and the Census Bureau. Each March, the CPS is expanded to produce additional data on the nation’s foreign-born population and other topics. Legal status of immigrants in the CPS is inferred based on methods described in Passel and Cohn (2010).

Among the report’s other findings:

Naturalization rates

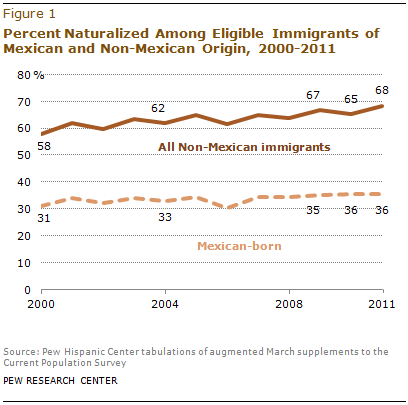
  • In 2011, Mexican immigrants had a comparatively lower rate of naturalization, 36% of those eligible, compared with 61% for all immigrants and 68% for all non-Mexican immigrants.
  • Mexican naturalization rates are also lower than those of immigrants from Latin America and the Caribbean—36% versus 61% in 2011.

Reasons for naturalizing

  • When asked in an open-ended question why they became U.S. citizens, almost one-in-five (18%) naturalized Latino immigrants cite civil and legal rights as their main reason for obtaining U.S. citizenship. Another 16% cite an interest in having access to the benefits and opportunities derived from U.S. citizenship and 15% give family-related reasons.
  • Mexican naturalized citizens are more likely to say they became citizens for practical reasons such as obtaining civil and legal rights (22%) or specific benefits or opportunities derived from citizenship (20%). By comparison, among non-Mexican naturalized Latinos, family reasons are most often cited (16%).

Reasons for not naturalizing

  • Among Latino legal permanent residents (LPRs), when asked the main reason that they had not naturalized thus far, 26% identify personal barriers and another 18% identify administrative barriers.
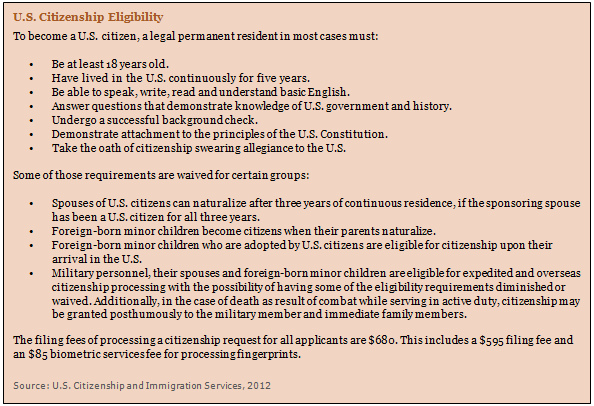
  • Among those citing personal barriers, about two-thirds (65%) say they need to learn English, and close to a fourth (23%) say they find the citizenship test too difficult. Among those who cite administrative barriers, more than nine-in-ten (94%) say the reason they have not naturalized is the cost of the naturalization application, which currently is $680 per application.
  • Almost half (48%) of Mexican-born green card holders say the main reason they have not yet naturalized relates to either personal (33%) or administrative (16%) barriers. This compares with about four-in-ten (39%) Hispanic green card holders who were born in a country other than Mexico who say they have not naturalized due to personal (17%) or administrative (22%) barriers.
PHC-2013-02-04-Naturalization-1-03

About this Report

This report explores the reasons Hispanic immigrants give for naturalizing to become a U.S. citizen—and for not naturalizing. It also shows trends in naturalization rates among immigrants who are in the country legally.

The report uses several data sources. Data on Latino immigrants’ views of naturalization are based on the Pew Hispanic Center’s 2012 National Survey of Latinos (NSL). The NSL was conducted from September 7 through October 4, 2012, in all 50 states and the District of Columbia among a randomly selected, nationally representative sample of 1,765 Latino adults, 899 of whom were foreign born. The survey was conducted in both English and Spanish on cellular as well as landline telephones. The margin of error for the full sample is plus or minus 3.2 percentage points. The margin of error for the foreign-born sample is plus or minus 4.4 percentage points. Interviews were conducted for the Pew Hispanic Center by Social Science Research Solutions (SSRS).

For data on the legal status of immigrants, Pew Hispanic Center estimates use data mainly from the Current Population Survey (CPS), a monthly survey of about 55,000 households conducted jointly by the U.S. Bureau of Labor Statistics and the Census Bureau. It is best known as the source for monthly unemployment statistics. Each March, the CPS sample size and questionnaire are expanded to produce additional data on the foreign-born population and other topics. Legal status of immigrants in the CPS is inferred based on methods described in Passel and Cohn (2010). The Pew Hispanic Center estimates make adjustments to the government data to compensate for undercounting of some groups, and therefore its population totals differ somewhat from the ones the government uses. Estimates of the number of immigrants by legal status for any given year are based on a March reference date.

Data used in this report were originally released in November 2012 as part of the Pew Hispanic Center report “An Awakened Giant: The Hispanic Electorate is Likely to Double by 2030” by Taylor, et al. (2012).

This report was written by Research Associate Ana Gonzalez-Barrera, Associate Director Mark Hugo Lopez, Senior Demographer Jeffrey S. Passel and Director Paul Taylor. Ana Gonzalez-Barrera took the lead in developing the survey questionnaire’s naturalization section. Senior Writer D’Vera Cohn provided comments on earlier drafts of the report. Research Assistant Seth Motel provided excellent research assistance. Senior Research Associate Richard Fry, Senior Editor Rich Morin, Motel and Research Assistant Eileen Patten number-checked the report text and topline. Marcia Kramer and Molly Rohal were the copy editors.

A Note on Terminology

The terms “Latino” and “Hispanic” are used interchangeably in this report.

“Foreign born” refers to persons born outside of the United States, Puerto Rico or other U.S. territories to parents neither of whom was a U.S. citizen.

The following terms are used to describe immigrants and their status in the U.S. In some cases, they differ from official government definitions because of limitations in the available survey data.

Legal permanent resident, legal permanent resident alien, legal immigrant, authorized migrant: A citizen of another country who has been granted a visa that allows work and permanent residence in the U.S. For the analyses in this report, legal permanent residents include persons admitted as refugees or granted asylum.

Naturalized citizen: Legal permanent resident who has fulfilled the length of stay and other requirements to become a U.S. citizen and who has taken the oath of citizenship.

Unauthorized migrant: Citizen of another country who lives in the U.S. without a currently valid visa.

Eligible immigrant: In this report, a legal permanent resident who meets the length of stay qualifications to file a petition to become a citizen but has not yet naturalized.

Legal temporary migrant: A citizen of another country who has been granted a temporary visa that may or may not allow work and temporary residence in the U.S.

II. Recent Trends in Naturalization, 2000-2011

According to Pew Hispanic Center estimates, the share of all legal foreign-born residents who have become naturalized U.S. citizens rose to 56% in 2011, the highest level in three decades and an 18 percentage point increase since 1990.

U.S. citizenship confers a number of benefits on recipients. In addition to the right to vote, naturalized immigrants are eligible to participate in federal programs, gain a number of legal rights and become eligible for federal employment.

PHC-2013-02-04-Naturalization-2-02

The population of naturalized U.S. citizens reached 15.5 million in 2011, a historic high that reflects both a rise in the annual inflow of legal migrants and an increased likelihood that those who are eligible to apply for citizenship actually do so.

The number of legal permanent resident admissions1 has exceeded 1 million annually since 2005, about double the annual number of immigrants admitted legally and granted green cards in the 1970s and 1980s (U.S. Department of Homeland Security, 2012).

PHC-2013-02-04-Naturalization-2-03

As a result, the total number of legal immigrants—naturalized U.S. citizens and legal permanent residents—has more than doubled in the past four decades, reaching 27.8 million in 2011. This has created a large pool of potential new U.S. citizens. In 2011, a majority (56%) of all the legal immigrants living in the country had already become naturalized citizens. The rest—12.4 million—are green card holders who could eventually naturalize and become U.S. citizens.

In 2011, naturalized citizens accounted for 39% of the 39.6 million foreign born living in the U.S., up from 34% of the 32.1 million immigrants in 2000. During this period, the share of legal permanent residents among the foreign-born population shrank from 37% in 2000 to 31% 2011.

Mexican Immigrants Naturalizing at Lower Rates

PHC-2013-02-04-Naturalization-2-04

As of 2011, 9.7 million immigrants were eligible for naturalization but had not yet naturalized; of these, more than a third (3.5 million) were Mexican immigrants.

After a sharp increase in naturalizations of Mexican legal permanent residents in the late 1990s (Passel, 2007), the Mexican naturalization rate has flattened.

PHC-2013-02-04-Naturalization-2-05

In 2011, Mexicans still had a comparatively lower rate of naturalization at 36% than the 61% for all immigrants and 68% for all non-Mexican immigrants.

Compared with other immigrants from Latin America and the Caribbean, Mexicans also have the lowest rate of naturalization—36% versus 61% in 2011 (see Appendix A).2

There are several possible explanations for these differences. Most importantly, Mexican immigrants are more likely than others to maintain close ties to their home country because of the geographic proximity of Mexico to the U.S.

Another possible reason is that not all Mexican immigrants are aware that they can hold both U.S. and Mexican citizenship at the same time. Until 1998 Mexico did not allow its citizens to hold dual citizenship. The change in policy by the Mexican government is one reason the rate of naturalization of Mexican immigrants in the U.S. rose so dramatically in the late 1990s, from 20% in 1995 to 34% in 2001.

The Pew Hispanic survey asked all foreign-born Latinos whether or not their country of origin allowed them to hold citizenship from another country. Among Mexican immigrants, 71% correctly responded that Mexico allows its citizens to hold dual citizenship. But 18% said that Mexico does not allow dual citizenship and an additional 11% said they don’t know. Among non-Mexican Latino immigrants, 62% said their country of origin allows them to hold two citizenships, while 24% said it does not and 14% said they don’t know.3

Other possible deterrents for the naturalization of Mexican immigrants are the cost of the naturalization process and the difficulty of the English and civics test. In July 2007, U.S. Citizenship and Immigration Services nearly doubled the fee for naturalization processing to $595 and added an $85 biometric fee.

III. Who Naturalizes: Reasons for Naturalizing

When asked in an open-ended question,4 almost one-in-five (18%) naturalized Latinos gave reasons related to acquiring civil and legal rights as their main reason for obtaining U.S. citizenship. An interest in having access to the benefits and opportunities derived from citizenship is cited by 16% of respondents, and family-related reasons are cited by 15%.

Another common reason given by naturalized immigrants relates to viewing the U.S. as home (12%).5 This is followed by the 6% who say the main reason for becoming a U.S. citizen has to do with their sense of identity as an American or their love of the U.S. An additional one-fifth (18%) of foreign-born Latino naturalized citizens cite other reasons for naturalizing.

Among the 18% of Latino foreign-born U.S. citizens who identify civil and legal rights as their main reason for naturalizing, about seven in ten (72%) cite gaining the right to vote.

Among those naturalized Latinos who say benefits or opportunities are the main reason that they became U.S. citizens, the most common reason given is for “more or better opportunities” (31%), followed by “more or better benefits” (19%) in general. Being able to travel internationally more easily by holding a U.S. passport is the most commonly mentioned benefit (19%), followed by accessing certain jobs (13%). Utilizing specific benefits, such as Medicare and Social Security, is mentioned by 6% of those who cite benefits or opportunities as their reason for naturalizing—1% of the entire sample of naturalized Latinos.

Among those who cite family reasons for becoming a U.S. citizen, almost half say they were naturalized as a result of parental choice or desire (7%). These respondents were either naturalized as minors when their parents became citizens or were brought to the U.S. legally as children and decided to become naturalized when they came of age.

Having members of the family who are U.S. citizens is another important reason Latinos become naturalized–some 3% cite this as a key reason. Sponsoring a family member to migrate legally to the U.S. is the main motivation of 3% of foreign-born Latino U.S. citizens. In addition, a small share (2%) of naturalized Latinos say they obtained their citizenship for their family or their children, without further specification.

Long-term residence reasons are the primary motivation for 12% of foreign-born Latino citizens who have become naturalized. Among them, about three-quarters say they became naturalized because they lived here or they consider the U.S. home now. For the rest, naturalizing was a way of permanently staying in the U.S.

Differences between Mexican and non-Mexican Naturalized Latinos

PHC-2013-02-04-Naturalization-3-02

Foreign-born naturalized Mexicans are more likely than non-Mexican naturalized Latinos to give practical motivations for becoming U.S. citizens. According to the survey, four-in-ten (42%) Mexican naturalized citizens say they either naturalized to “acquire civil and legal rights” (22%) or “to obtain benefits and opportunities” derived from naturalization (20%), the two most commonly cited reasons among naturalized Mexicans. By contrast, only one-in-four non-Mexican Latinos cite “civil or legal rights” (14%) or “benefits and opportunities” (11%) as the main motivating reason for their decision to naturalize. For non-Mexican naturalized Latinos, family (16%) was the most commonly cited motivation. More sentimental motivations such as “loving, liking or admiring the U.S.” or “wanting to become American” were also more prevalent among non-Mexican naturalized Latinos (8%) than among their Mexican counterparts (3%)

Differences among Demographic Groups

Who Cites Civil and Legal Rights?

PHC-2013-02-04-Naturalization-3-03

Latino naturalized citizens who are currently employed, have a higher family income, speak better English, and are under age 50 are more likely than other demographic subgroups to say the main reason they naturalized was to acquire civil and legal rights.

Some 22% of those who are currently employed say they naturalized to acquire or protect their rights, compared with 10% of those not currently employed. Similarly, the share citing civil and legal rights as a rationale for seeking naturalization increases as family income rises. More than one-fourth (27%) of naturalized Latinos with higher household incomes—$40,000 a year or more—say their main motivation in obtaining citizenship was civil and legal rights. By contrast, naturalized Latinos with incomes below $40,000 are less likely to say this was their main motivation—20% of those with household incomes between $20,000 and $39,999 and 14% or those with household incomes below $20,000 a year.

Among foreign-born naturalized Latinos, those who say they speak English “very well” or “pretty well”6 were more likely to have this motivation (21%) than those who say they speak English “just a little” or “not at all” (13%). Fully one-fourth (25%) of foreign-born naturalized Latino adults under 50 years of age say “civil and legal rights” is the main reason they decided to become naturalized. This compares to about half of that share of those 50 years or older who identify this as their main reason (13%).

Who Cites More Benefits and Opportunities?

PHC-2013-02-04-Naturalization-3-04

Foreign-born Latino citizens who are male, have a high school education or less, and who have been in the U.S. for fewer than 20 years are more likely to say the main reason they became naturalized relates to access to benefits and opportunities derived from U.S. citizenship.

Almost one-in-five (19%) male naturalized Latinos say they decided to become U.S. citizens for the benefits and opportunities that citizenship brings, compared with 12% of their female counterparts.

Naturalized Latinos with a high school diploma or less are more likely than those with some college or more to say the main reason they became U.S. citizens was to obtain certain benefits or opportunities from naturalization—18% versus 12%.

Who Cites Family Reasons?

PHC-2013-02-04-Naturalization-3-05

Among foreign-born naturalized Latinos, those who are female, not employed, or have been in the U.S. for more than three decades are more likely to say the main motivation to become a U.S. citizen was their family.

Almost one-in-five (19%) naturalized Hispanic females say they decided to become U.S. citizens for family reasons, compared with one-in-ten (10%) Hispanic males.

About one-fourth (24%) of naturalized Latinos not currently employed say family reasons were the main motivator for becoming naturalized. This compares with 10% of employed naturalized Latinos.

Twenty-three percent of naturalized Latinos who have been in the country more than 30 years respond similarly. This percentage is higher than that for those who have been in the country 20 years or less (13%) or 21 to 30 years (9%).

IV. Reasons for Not Naturalizing

By 2011, a record 5.6 million immigrants from Latin America and the Caribbean had become naturalized, but an even larger number—5.8 million Latin American and Caribbean immigrants—are currently eligible to apply for citizenship but have not done so7. According to the Pew Hispanic survey, about four-in-ten (45%) say the primary reason for not naturalizing is either personal (26%) or administrative barriers (18%).

Among those who have not yet naturalized, the desire to do so is great. The survey finds that more than nine-in-ten (93%) Hispanic immigrants who have not yet naturalized say they “would” naturalize if they could. Overall, the expressed desire to naturalize is the same among current Hispanic green card holders (including those who have been approved for one) and among those who say they are neither U.S. legal permanent residents nor U.S. citizens8—96% and 92%, respectively.

The former group—green card holders and those who have been approved for a green card—represent those who could become U.S. citizens sometime in the next few years. The latter group—Hispanic immigrants who are neither U.S. citizens nor U.S. legal permanent residents—represent those who would not qualify for naturalization due to their current immigration status.

Among Latino legal permanent residents (LPRs), when asked the main reason that they had not naturalized thus far, 45% identify either personal (26%) or administrative (18%) barriers. Among those citing personal barriers, a large majority (65%) say they need to learn English, and close to a fourth (23%) say they find the citizenship test too difficult. Also, more than nine-in-ten (94%) of those citing administrative barriers say the reason they have not naturalized is the cost of the naturalization application.

For Latinos holding a green card but who have not yet applied to become a U.S. citizen, just 9% say they have no interest in doing so, while 17% say they have not yet tried to get naturalized (or give some other explanation).

Also, some 13% of Latino LPRs interviewed say they are not yet eligible to naturalize. According to U.S. Department of Homeland Security requirements, in order to apply for U.S. citizenship, an LPR needs to spend at least five years holding a resident’s card—or three years for those married to a U.S. citizen—before becoming eligible to apply.

A small share of Latino green card holders (4%) say that they either are currently applying for U.S. citizenship or will so within the next year.9

Differences between Mexican and Non-Mexican Legal Permanent Residents

PHC-2013-02-04-Naturalization-4-02

LPRs of Mexican origin and those of non-Mexican origin cite different reasons for not naturalizing. Almost half (48%) of Mexican-born green card holders say the main reason they have not yet naturalized relates to either personal (33%) or administrative (16%) barriers. This compares with about four-in-ten (39%) green card holders who were born in a country other than Mexico who say they have not naturalized due to personal (17%) or administrative (22%) barriers.

By about a two-to-one ratio, Mexican legal permanent residents are more likely than their non-Mexican counterparts to say the main reason they have not become naturalized is language and other personal barriers (33% versus 17%). Mexicans are almost twice as likely as others to say that they either lack English proficiency (21%), find the test too difficult or are afraid of taking it (8%) or have tried to naturalize but did not succeed (4%).

Financial and administrative issues, such as the cost of naturalizing, are slightly less of a reason that Mexican legal permanent residents (16%) not to naturalize compared with non-Mexican legal permanent residents (22%).

Differences among Demographic Groups

Who Cites Language and Other Personal Barriers?

PHC-2013-02-04-Naturalization-4-03

Latino legal permanent residents with lower levels of educational attainment, income and English proficiency and with fewer years in the U.S. are more likely to cite language and other personal barriers as their main reason for not naturalizing.

Four-in-ten (40%) of those with less than a high school education indicate that language and other personal barriers are the primary reason for not naturalizing, compared with 9% of those with at least a high school diploma. Those who speak English just a little or not all are about three times as likely to respond that language limitations are their primary rationale for not naturalizing (35%), compared with 8% who speak English very well or pretty well.

Non-citizen Latino legal permanent residents with household incomes of less than $20,000 (34%) are almost twice as likely to cite language and other personal barriers as those whose household income is $20,000 or more (19%). Similarly, those who have been in the U.S. more than 20 years (35%) are about twice as likely to select language as their primary reason for not naturalizing as are those who have been in the U.S. less than 20 years (19%). Those who have children under age 18 (32%) are also significantly more likely those who don’t (20%) to cite language and other personal barriers as their primary reason for not naturalizing.

Who Cites Financial and Administrative Barriers?

PHC-2013-02-04-Naturalization-4-04

Financial and administrative barriers—such as the cost of gaining citizenship or its complexity—are more likely to be an impediment for naturalization for older Latino legal immigrants and those with lower household incomes.

Among Latino legal residents, those who are 50 years or older and those who have been in the U.S. for two decades are more likely to say that money or the complexity of the process are the main barrier to them in gaining naturalization. About three-in-ten (28%) of Latino adult green card holders 50 years of age or older identify these barriers, compared with just 14% of those under 50. Likewise, almost a fourth (24%) of those who have been in the U.S. for 20 years or more give these reasons, compared with 13% or those who have been in the U.S. for less than 20 years.

As would be expected, Latino green card holders with household income below $20,000 a year are more likely to identify financial and administrative barriers as the main reason they have not become citizens, compared with those earning $20,000 or more per year—22% versus 13%.

Unmarried Latino legal residents and those without children under 18 living with them are also more likely to identify financial and administrative barriers as the main reason they have not naturalized.

Who Cites “Have Not Tried Yet or Not Interested” for Not Naturalizing?

PHC-2013-02-04-Naturalization-4-05

About four-in-ten Latino green card holders who say they speak English very well or pretty well say the reason they have not naturalized is a lack of initiative or interest. This compares with two-in-ten Latino green card holders who say they speak English less well.

Latino legal immigrants who have household incomes of $20,000 or higher are also more likely than those with lower incomes to say the reason they have not naturalized is that they lack initiative or interest—31% versus 22%.

About a third of those who have been in the U.S. for less than 20 years say the reason they have not naturalized is lack of interest or initiative, compared with about one-in-five (19%) of those who have been in the U.S. for 20 years or more.

Among Latino green card holders, males are 10 percentage points more likely than females to say they have delayed naturalizing mainly because of a lack of interest or initiative—31% versus 21%.

References

Baker, Bryan C. 2010. “Naturalization Rates among IRCA Immigrants: A 2009 Update.” Washington, DC: Office of Immigration Statistics, U.S. Department of Homeland Security, October.

Bittle, Scott et al. 2009. “A Place to Call Home: What Immigrants Say Now about Life in America.” New York, NY: Public Agenda.

Blumberg, Stephen J., and Julian V. Luke. 2012. “Wireless Substitution: Early Release of Estimates from the National Health Interview Survey, July-December 2011.” Hyattsville, MD: National Center for Health Statistics, June.

Farkas, Steve et al. 2003. “Now That I’m Here: What America’s Immigrants Have to Say about Life in the U.S. Today.” New York, NY: Public Agenda.

Livingston, Gretchen. 2009. “Hispanics, Health Insurance and Health Care Access.” Washington, DC: Pew Hispanic Center, September.

Passel, Jeffrey. 2007. “Growing Share of Immigrants Choosing Naturalization.” Washington, DC: Pew Hispanic Center, March.

Passel, Jeffrey, and D’Vera Cohn. 2010. “U.S. Unauthorized Immigration Flows Are Down Sharply Since Mid-Decade.” Washington, DC: Pew Hispanic Center, September.

Passel, Jeffrey, D’Vera Cohn, and Ana Gonzalez-Barrera. 2012. “Net Migration from Mexico Falls to Zero—and Perhaps Less.” Washington, DC: Pew Hispanic Center, April.

Taylor, Paul, Ana Gonzalez-Barrera, Jeffrey Passel, and Mark Hugo Lopez. 2012. “An Awakened Giant: The Hispanic Electorate is Likely to Double by 2030; Aging, Naturalization and Immigration Will Drive Growth.” Washington, DC: Pew Hispanic Center, November.

U.S. Citizenship and Immigration Services. 2012. “A Guide To Naturalization.” Washington, DC: USCIS, Form M-476, March.

U.S. Department of Homeland Security. 2012. 2011 Yearbook of Immigration Statistics. Washington, DC: Office of Immigration Statistics, September.

U.S. Immigration and Customs Enforcement. 2011. “Exercising Prosecutorial Discretion Consistent with the Civil Immigration Enforcement Priorities of the Agency for the Apprehension, Detention, and Removal of Aliens.” Washington, DC: June.

Appendix A: Additional Charts and Tables

Appendix B: 2012 National Survey of Latinos Methodology

Results for this study are based on telephone interviews conducted by Social Science Research Solutions (SSRS), an independent research company, among a nationally representative sample of 1,765 Latino respondents ages 18 and older, conducted from September 7 through October 4, 2012. In order to facilitate a more comprehensive analysis of non-Catholic Latinos, the sample includes interviews with an additional 438 non-Catholic respondents, for a total of 967 non-Catholics.

For the full sample, a total of 866 respondents were native born (including Puerto Rico), and 899 were foreign born (excluding Puerto Rico). Of the foreign born, 375 were U.S. citizens, 256 were legal residents, and 264 were neither U.S. citizens nor legal residents. For results based on the total sample, one can say with 95% confidence that the error attributable to sampling is plus or minus 3.2 percentage points.

For this survey, SSRS used a staff of Spanish-speaking interviewers who, when contacting a household, were able to offer respondents the option of completing the survey in Spanish or English. A total of 805 respondents (46%) were surveyed in Spanish, and 960 respondents (54%) were interviewed in English. Any person ages 18 or older of Latino origin or descent was eligible to complete the survey.

To ensure the highest possible coverage of the eligible population, the study employed a dual-frame landline/cellphone telephone design. The sample consisted of a landline component (yielding 880 completed interviews) and a cellphone component (885 interviews).10 Both the landline and cellphone components consisted of a stratified sampling design, oversampling areas with higher densities of Latino residents. The same sampling plan was used for the main sample and the non-Catholic oversample.

For the landline sampling frame, the sample was run against InfoUSA and other household databases, and phone numbers that matched to known Latino surnames were subdivided into a Surname stratum. The remaining, unmatched and unlisted landline sample was divided into the following mutually exclusive strata, based on Census estimates of the density of the Hispanic population in each: Very High Latino, High Latino, and Medium Latino.

Marketing System Group’s (MSG) GENESYS sample generation system was used to generate cellphone sample, which was divided into High and Medium Latino strata. Overall, the study employed eight strata.

Samples for the low-incidence landline and cell strata were drawn from previously interviewed respondents in SSRS’s weekly dual-frame Excel omnibus survey. Respondents who indicated they were Latino on the omnibus survey were eligible to be recontacted for the present survey. In addition, the incidences in the Very High and Medium landline strata of the non-Catholic oversample were lower than anticipated, so additional interviews with Latinos11 prescreened from the Excel omnibus survey were used to gather additional responses in these strata. Altogether, a total of 293 previously interviewed respondents (17%) were included in this sample.

It is important to note that the existence of a surname stratum does not mean the 2012 National Survey of Latinos was a surname sample design. The sample is RDD, with the randomly selected telephone numbers divided by whether they were found to be associated with or without a Spanish surname. This was done simply to increase the number of strata and thereby increase the ability to meet ethnic targets and ease administration by allowing for more effective assignment of interviewers and labor hours.

A five-stage weighting design was used to ensure an accurate representation of the national Hispanic population.

  • An adjustment was made for all persons found to possess both a landline and a cellphone, as they were twice as likely to be sampled as were respondents who possessed only one phone type.
  • The sample was corrected for a potential bias associated with recontacting previously interviewed respondents in certain strata.
  • The sample was corrected for the likelihood of within-household selection, which depended upon the likelihood that the respondent’s age group would be selected, and within that age group, the particular respondent would be selected.
  • The sample was corrected for the over-sampling of telephone number exchanges known to have higher densities of Latinos and the corresponding undersampling of exchanges known to have lower densities of Latinos.
  • Finally, the data were put through a post-stratification sample balancing routine. The post-stratification weighting utilized national 2012 estimates from the U.S. Census Bureau’s Current Population Survey, March Supplement, on gender, age, education, Census region, heritage, years in the U.S., phone status (i.e., cellphone only, cellphone mostly, mixed/landline only/landline mostly) and density of the Latino population. After the data were raked, the weighted data were used to determine the benchmark for a Catholic/non-Catholic parameter, which was used in the second stage of ranking.12

Appendix C: 2012 National Survey of Latinos Topline