Pew Research Center

FOR RELEASE OCTOBER 11, 2012

Latino Voters Support Obama by 3-1 Ratio, But Are Less Certain than Others about Voting

Latino registered voters prefer President Barack Obama over Republican challenger Mitt Romney by 69% to 21% and express growing satisfaction with the direction of the nation and the state of their personal finances but are somewhat less certain than non-Hispanics that they will vote in this election, according to a new nationwide survey of 1,765 Latinos.

BY Mark Hugo Lopez and Ana Gonzalez-Barrera

FOR MEDIA OR OTHER INQUIRIES:

Communications Department
202.419.4372
www.pewresearch.org

RECOMMENDED CITATION

Pew Research Center, October 2012, "Latino Voters Support Obama by 3-1 Ratio, But Are Less Certain than Others about Voting"

About Pew Research Center

Pew Research Center is a nonpartisan, nonadvocacy fact tank that informs the public about the issues, attitudes and trends shaping the world. It does not take policy positions. The Center conducts public opinion polling, demographic research, computational social science research and other data-driven research. It studies politics and policy; news habits and media; the internet and technology; religion; race and ethnicity; international affairs; social, demographic and economic trends; science; research methodology and data science; and immigration and migration. Pew Research Center is a subsidiary of The Pew Charitable Trusts, its primary funder.

© Pew Research Center 2026

Table of contents

  • About Pew Research Center
  • Latino Voters Support Obama by 3-1 Ratio, But Are Less Certain than Others about Voting
  • II. Latinos and the 2012 Presidential Election
  • III. Latino Voter Interest and Engagement
  • IV. Growing Satisfaction with the Nation’s Direction
  • V. Top Issues in this Year’s Presidential Campaign
  • VI. Latinos and Immigration Policy
  • References
  • Appendix A: Demographics of Latino Registered Voters
  • Appendix B: 2012 National Survey of Latinos Methodology

Latino Voters Support Obama by 3-1 Ratio, But Are Less Certain than Others about Voting

Latino registered voters prefer President Barack Obama over Republican challenger Mitt Romney by 69% to 21% and express growing satisfaction with the direction of the nation and the state of their personal finances but are somewhat less certain than non-Hispanics that they will vote in this election, according to a new nationwide survey of 1,765 Latinos.

Latino registered voters prefer President Barack Obama over Republican challenger Mitt Romney by 69% to 21% and express growing satisfaction with the direction of the nation and the state of their personal finances but are somewhat less certain than non-Hispanics that they will vote in this election, according to a new nationwide survey of 1,765 Latinos. The survey was conducted from September 7 to October 4, 2012, by the Pew Hispanic Center, a project of the Pew Research Center.

Obama’s current lead over Romney among Hispanics has barely budged throughout the 2012 campaign and is larger than in the 2008 election, when he received 67% of the Hispanic vote to 31% for Republican John McCain (Lopez, 2008).

The new survey also finds a sharp rise in the past year in the share of Latinos who identify the Democratic Party as the one that has more concern for Latinos. Some 61% say this now, up from 45% in 2011. Just 10% say this about the Republican Party, down from 12% in 2011.

The Latino electorate is growing in size and importance. Today some 23.7 million Hispanics are eligible to vote, an increase of more than 4 million since 2008. Hispanics now account for a record 11.0% of the nation’s eligible electorate, up from 9.5% in 2008 (Lopez, Motel and Patten, 2012).

With the turnout rate of eligible Latinos voters historically lagging behind that of other groups, the new survey finds that 77% of Latino registered voters say they are “absolutely certain” they will vote this year. By comparison, 89% of all registered voters say the same in a separate Pew Research Center survey (2012b) of the general public taken at the same time.

Likewise, 61% of Latino registered voters say they have thought “quite a lot” about the upcoming presidential election, compared with 70% of registered voters in the general public.

At the same time, however, fully two-thirds (67%) of Latino adults say they believe the Latino vote will have a “major impact” on determining who wins this year’s election.

Latinos and State Photo ID Laws

One recent development that could potentially have an impact on the Latino turnout rate is the passage of state laws that require voters to show photo identification in order to cast a ballot. This year 11 states—Florida, Georgia, Hawaii, Idaho, Indiana, Kansas, Louisiana, Michigan, New Hampshire, South Dakota and Tennessee—have such laws in effect.1  Together, these states are home to 15% of all Latino eligible voters.2

According to the new survey, fully 97% of all Latino registered voters—as well as a nearly identical 95% of Latino registered voters in those 11 states—say they are confident they have the identification they will need to vote on Election Day.

The survey also finds broad support among Latino registered voters for voter photo ID laws; 71% favor them, nearly as high a share as among the general public (77%).

Top Issues among Latino Registered Voters

Education, jobs and the economy, and health care are the top issues for Hispanic registered voters. Some 55% of registered voters say the issue of education is extremely important to them, followed by 54% who cite jobs and the economy, and 50% who cite health care. These three top issues are the same as those cited by Hispanic registered voters in December 2011 (Lopez, Gonzalez-Barrera and Motel, 2011).

About a third (34%) of Hispanic registered voters say immigration is extremely important to them personally; similar shares say the same about the federal budget deficit (36%) and taxes (33%).

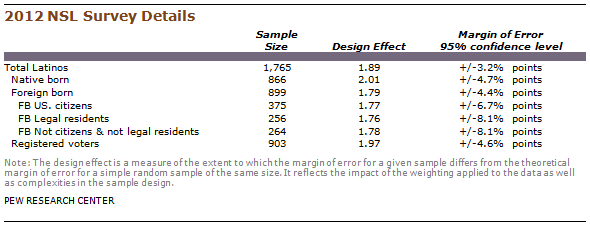
This report is based on a nationally representative bilingual telephone survey of 1,765 Latino adults, including 903 registered voters. The margin of error for the full sample is plus or minus 3.2 percentage points at the 95% confidence level; for registered voters, the margin of error is plus or minus 4.6 percentage points. The survey was largely conducted before the first presidential debate, which occurred on October 3, 2012. For a full description of the survey methodology, see Appendix B.

Among the report’s other findings:

The Presidential Horse Race and Party Affiliation

  • In the nine so-called battleground states in the presidential election—Colorado, Florida, Iowa, Nevada, New Hampshire, North Carolina, Ohio, Virginia and Wisconsin3—Obama holds a 65% to 23% lead over Romney among Latino registered voters. In the non-battleground states, Obama’s lead is 70% to 21%.
  • Obama holds a 72% to 22% lead over Romney among Hispanic registered voters who say they are “absolutely certain they will vote” this year. Among Hispanic registered voters who say they may vote, Obama’s lead over Romney is smaller—66% to 20%.
  • Across nearly all major demographic groups of Latino registered voters—by age, gender, educational attainment, language use and immigrant status—Obama holds a greater than 2-1 lead over Romney.
  • Democrats hold a widening advantage over Republicans among Latino registered voters in party affiliation. Seven-in-ten (70%) Latino registered voters say they identify with or lean toward the Democratic Party, while 22% say the same about the Republican Party. In 2008, this margin was 65% to 26% (Lopez and Minushkin, 2008).

Importance of the Latino Vote

  • Two-thirds (67%) of adult Latinos say the Latino vote will have a major impact in determining who wins the 2012 presidential election.
  • Foreign-born Hispanics are more likely than the native born to say the Latino vote will have a major impact on this year’s election—72% versus 62%.

Approval of Obama’s New Policy on Unauthorized Immigrant Youth

  • Nearly nine-in-ten (89%) adult Latinos say they approve of President Obama’s recently announced policy that allows unauthorized immigrants who were brought to the U.S. as children to remain in the country and apply for temporary work permits if they meet certain conditions. Among Latino registered voters, 86% say they approve of the program.
  • Three-in-ten (31%) Hispanic adults say they know someone who has applied for the new deferred action program. Among Hispanic registered voters, 26% say they know someone who has applied for the program.
  • One-in-four (26%) Hispanic adults say they personally know someone who has been deported or detained by the federal government for immigration reasons in the past 12 months. Among Hispanic registered voters, 22% say the same.

Personal Finances and the State of the Nation

  • About four-in-ten (42%) Hispanic registered voters say their personal finances are in “excellent” or “good” shape, up from 31% who said that in 2011. Among registered voters in the general public, some 48% rate their finances as excellent or good, up from 42% last year.
  • Most Hispanics are optimistic about their financial futures. Seven-in-ten Hispanics (73%) and Hispanic registered voters (70%) say they expect their family’s financial situation will improve in the next year.
  • Hispanic registered voters are more upbeat than the general public about the overall state of the nation. Some 45% say they are satisfied with the direction of the nation, compared with 28% of all registered voters. Both figures have risen in the past year.

About the Report

The 2012 National Survey of Latinos (NSL) focuses on Latinos views and attitudes about the 2012 presidential election. The survey was conducted from September 7 through October 4, 2012, in all 50 states and the District of Columbia among a randomly selected, nationally representative sample of 1,765 Latino adults, 903 of whom say they are registered to vote. The survey was conducted in both English and Spanish on cellular as well as landline telephones. The margin of error for the full sample is plus or minus 3.2 percentage points. The margin of error for the registered voter sample is plus or minus 4.6 percentage points.

Interviews were conducted for the Pew Hispanic Center by Social Science Research Solutions (SSRS).

This report was written by Associate Director Mark Hugo Lopez and Research Associate Ana Gonzalez-Barrera. Paul Taylor provided editorial guidance. The authors thank Paul Taylor, Scott Keeter, Leah Christian, D’Vera Cohn, Michael Dimock, Richard Fry, Cary Funk, Rakesh Kochhar, Luis Lugo, Jessica Martinez, Rich Morin, Seth Motel, Kim Parker, Jeffrey S. Passel, Eileen Patten, Antonio Rodriguez and Greg Smith for guidance on the development of the survey instrument. Taylor provided comments on earlier drafts of the report. Motel, Patten, Martinez and Parker number-checked the report text and topline. Marcia Kramer was the copy editor.

A Note on Terminology

The terms “Latino” and “Hispanic” are used interchangeably in this report.

References to other races and ethnicities are to the non-Hispanic components of those populations. “Asian” does not include Pacific Islanders.

The terms “unauthorized immigrants” and “illegal immigrants” are used interchangeably in this report, as are the terms “unauthorized immigration” and “illegal immigration.”

“Native born” refers to persons who are U.S. citizens at birth, including those born in the United States, Puerto Rico or other U.S. territories and those born abroad to parents at least one of whom was a U.S. citizen.

“Foreign born” refers to persons born outside of the United States, Puerto Rico or other U.S. territories to parents neither of whom was a U.S. citizen.

“Foreign-born U.S. citizens” refers to persons who indicate they are “foreign born” and U.S. citizens. The terms “foreign-born U.S. citizens” and “naturalized U.S. citizens” are used interchangeably in this report.

“Foreign-born legal residents” refers to persons who indicate they are foreign born and who say they have a green card or have been approved for one.

“Foreign born who are not legal residents and not U.S. citizens” refers to persons who indicate they are foreign born and who say they do not have a green card and have not been approved for one.

Language dominance is a composite measure based on self-described assessments of speaking and reading abilities. “Spanish-dominant” persons are more proficient in Spanish than in English, i.e., they speak and read Spanish “very well” or “pretty well” but rate their English-speaking and reading ability lower. “Bilingual” refers to persons who are proficient in both English and Spanish. “English-dominant” persons are more proficient in English than in Spanish.

“Eligible voters” refers to persons ages 18 and older who are U.S. citizens, regardless of whether they are registered to vote.

“Battleground states” were identified by the Pew Research Center using state ratings in September from The Cook Political Report, MSNBC, The New York Times, Real Clear Politics, Karl Rove, CNN, Pollster.com and The Washington Post. These states are Colorado, Florida, Iowa, Nevada, New Hampshire, North Carolina, Ohio, Virginia and Wisconsin.

“Photo ID states” are those classified by the National Conference of State Legislatures (2012) as requiring photo identification in order to vote. For the current presidential election, photo ID laws are in place in these states: Florida, Georgia, Hawaii, Idaho, Indiana, Kansas, Louisiana, Michigan, New Hampshire, South Dakota and Tennessee.

II. Latinos and the 2012 Presidential Election

The Presidential Campaign and Views of the Political Parties

President Barack Obama holds a 3-to-1 lead over Mitt Romney among Latino registered voters. According to the new Pew Hispanic survey, 69% of Latino registered voters say they would vote for Obama if the election were held today, while 21% say they would support Romney. This is similar to the margin among Latinos in the 2008 presidential election, when Obama won two-thirds (67%) of the Latino vote to Republican John McCain’s 31% (Lopez, 2008).

The new survey also finds that a rising share of Latino voters say that the Democratic Party has more concern for Latinos than does the Republican Party. Today 61% of Latino registered voters say this, up from 45% in 2011. This is the highest level recorded in Pew Hispanic surveys since 2002.

By contrast, just 10% of Hispanic registered voters say the Republican Party has more concern for Hispanics than the Democratic Party, down slightly from 2011 when 12% said the same.

Among Latino registered voters who identify with or lean toward the Democratic Party, 92% say they will vote for Obama and 4% say they will vote for Romney. Among those who identify with or lean toward the Republican Party, 78% say they will vote for Romney and 15% say they will vote for Obama. Only 9% of Latino registered voters do not identify with or lean toward either the Democratic Party or the Republican Party. Among them, 24% say they will vote for Obama while 16% say they will vote for Romney and the remainder say they will vote for another candidate or don’t know.

In addition, Obama holds a wider advantage over Romney among Hispanic registered voters who say they are satisfied with the direction of the country than those who say they are dissatisfied with the direction of the country. Among those who are satisfied with the direction of the country, Obama leads Romney 80% to 13%. By contrast, among those who are not satisfied with the direction of the country, Obama still leads Romney, but by a smaller margin—58% versus 30%.

Among Latino registered voters who are Spanish dominant, Obama’s lead over Romney is 59 percentage points. Among those who are bilingual, Obama still leads over Romney, but by a smaller margin of 50 percentage points. And among English-dominant Hispanic registered voters, Obama is favored by a majority, but by a smaller margin of 40 percentage points.

Among Latino registered voters who say they are absolutely certain to vote, Obama’s lead over Romney is wider (72% versus 22%) than it is among those say they are not absolutely certain if they will vote (66% versus 20%).

Recently the Obama administration issued an order that allows some unauthorized young immigrants to stay in the country and apply for temporary work permits. Among Latino registered voters who know someone who has applied for the program, support for Obama is stronger (74%) than it is among those who do not know anyone who has applied (67%).

Party Affiliation among Hispanic Registered Voters

Partisan allegiance to the Democratic Party among Hispanic registered voters is at its highest level since at least 1999. According to the Pew Hispanic survey, seven-in-ten (70%) Hispanic registered voters say they identify with or lean toward the Democratic Party while 22% say the same about the Republican Party.

Across demographic groups of Latino registered voters, identification with the Democratic Party is strong. For more details, see Appendix A.

The Impact of the Latino Vote in 2012

Much has been made of the growing size of the Latino electorate. This election cycle, nearly 24 million Hispanics are eligible to vote, a record number (Lopez, Motel and Patten, 2012). And given this year’s battleground map, Hispanics may play a role in several key states, including Colorado, Florida, Nevada, North Carolina and Virginia.

How do Latinos themselves see their role in this year’s election? The Pew Hispanic survey asked Latinos whether the Latino vote will have a “major impact,” “minor impact” or “no impact at all” in determining who wins the 2012 presidential election. Overall, the assessment is positive.

Among all Hispanics, two-thirds (67%) say the Latino vote will have a major impact this year and 23% say it will have a minor impact. Among Hispanic registered voters, 67% say the Hispanic vote will have a major impact this year while 24% say it will have a minor impact and 8% say it will have no impact at all or say they don’t know.

The view that the Hispanic vote will have a major impact on the outcome of this year’s presidential election is especially high among immigrant Hispanics. Among them, 72% say the Hispanic vote will have a major impact in this year’s election. By contrast, fewer—though still a majority—of the native born say the same, 62%.

Some 73% of Spanish-dominant and 70% of bilingual Latinos say the Latino vote will have a major impact this year. Among English-dominant Latinos, 57% say the same.

Democrats are more likely than Republicans to say the Latino vote will have a major impact on the election. Three-fourths (74%) of Democrats say this, compared with 55% of Republicans.

Those who have thought about the election “quite a lot” are more likely than those who have not given the election as much thought to say the Latino vote will have a major impact—76% versus 60%.

III. Latino Voter Interest and Engagement

The Hispanic electorate has grown in size and importance. Today, the number of Hispanics eligible to vote in the nation’s elections has reached a record 23.7 million, up by more than 4 million since 2008. Overall Hispanics now account for 11% of the nation’s 215 million eligible voters—a new high (Lopez, Motel and Patten, 2012).

However, Hispanic participation in the nation’s elections has historically lagged behind that of other groups. This year, the level of participation remains a key unknown about the Latino vote.

Interest in the 2012 Presidential Election

When it comes to interest in this year’s election, the new survey reveals that 61% of Latino registered voters say they have thought “quite a lot” about the coming presidential election. This is slightly below the level of interest among all registered voters, which stands at 70% (Pew Research Center for the People & the Press, 2012b).

Among nearly all subgroups of Hispanic registered voters, majorities say they have given the election “quite a lot of thought,” though some have done so more than others.

Three-in-four (76%) Republican Latino registered voters say they have given the coming election “quite a lot of thought,” a higher share than that among Democratic Latino registered voters (60%).

Latino registered voters who are foreign born have given the election somewhat more thought than those who are native born—65% versus 60%.

Other differences are also evident. Latino registered voters who have less than a high school diploma are less engaged than those who have at least a high school diploma. Fewer than half (44%) of those with less than a high school diploma have given the election “quite a lot of thought,” compared with 60% of high school graduates and 68% of those with at least some college experience.

Intent to Vote

Latino registered voters are less likely than all registered voters to say they’ll vote in this year’s election. Three-in-four (77%) Latino registered voters say they are “absolutely certain” they will vote, while 89% of all registered voters say the same (Pew Research Center for the People & the Press, 2012b).

Among Hispanic registered voters, the most likely to say they are “absolutely certain” they will vote in this year’s presidential election are those with at least some college education (85%), those ages 50 to 64 (82%) and those who are English dominant (81%). Meanwhile, Hispanic registered voters who are the least likely to say they are “absolutely certain” they will vote are those who have not completed high school (64%), those who are Spanish dominant (65%) and high school graduates (69%).

Voter ID Laws and the Latino Electorate

Since 2011, many states have either passed or considered passing laws that would require potential voters to show official photo identification before voting on Election Day. Currently, according to the National Conference of State Legislatures (2012), 11 states—Florida, Georgia, Hawaii, Idaho, Indiana, Kansas, Louisiana, Michigan, New Hampshire, South Dakota and Tennessee—have such laws in effect for 2012. These developments could have an impact on Latino voter turnout. Together, these states hold 15% of all Latino eligible voters.4

According to the Pew Hispanic survey, nearly all (97%) Hispanic registered voters say they are confident they have the identification they need to cast a ballot; in the 11 states that require photo identification, 95% of Hispanic registered voters are confident they have the necessary ID. Confidence is equally high among the general public; 98% of all registered voters say they are confident they have the identification they need to vote this year.

Confidence in having the ID needed to vote is high across all demographic groups of Hispanic registered voters. However, among those who are eligible to vote (an adult U.S. citizen) but are not registered to vote, fewer (87%)—though still a large majority—are confident they have the identification necessary to cast a vote in their states.

This finding is reflected in the share of Latinos who say they have a valid state-issued driver’s license or photo identification. Among registered voters, 93% say they have a valid state-issued ID. By contrast, 75% of eligible voters who are not registered say they have a valid state-issued ID.

Majority Support for Photo ID Laws

When it comes to Latino attitudes toward voter ID laws, the Pew Hispanic survey finds broad support for these laws, especially among foreign-born Hispanics. Overall, 71% of Hispanic registered voters say voters should be required to show an official identification to be allowed to vote on Election Day.

Among the general public, a slightly greater share of registered voters says the same—77%. But among all registered voters, some differences are evident. For example, nearly eight-in-ten (79%) white registered voters support photo ID laws. By contrast, a smaller share of black registered voters support such laws—62%.

Among Latino registered voters, support for photo ID laws is highest among Republicans (87%), those whose highest educational attainment is a high school diploma (78%) and the foreign born (77%). It is lowest among Latino registered voters ages 18 to 29 (64%) and the English dominant (65%). However, across all major demographic groups of Latino registered voters, a majority support photo ID laws.

Knowledge of Photo ID Laws

With so much discussion about voter and photo ID laws this year, many Hispanics believe their state requires a photo ID to vote, even if it does not. According to the survey, nearly two-thirds (62%) of Hispanic registered voters say their state requires a photo ID to vote. Among Hispanic registered voters who live in states where a photo ID is required, 76% say their state requires this. Among those who live in non-photo-ID states, 59% say their state requires a photo ID.5 This pattern is similar to that of all registered voters among the general public (Pew Research Center for the People & the Press, 2012a).

However, among all registered voters, blacks are more likely than whites to believe their state requires a photo ID to vote—71% versus 58%.

Some 27% of black eligible voters live in the 11 states that currently require a photo ID, a share higher than that for Hispanics (15%) or for whites (22%).6

IV. Growing Satisfaction with the Nation’s Direction

Latino registered voters have grown more optimistic about the country’s direction since 2011. According to the Pew Hispanic survey, 45% of Latino registered voters say they are satisfied with the nation’s direction today, up from 36% in 20117 and 27% in 2008.8 This trend mirrors that seen among all registered voters. Among them, overall, 28%9say they are satisfied with the nation’s direction, up from 15% in 2011.10

In the past year, the unemployment rate among Latinos, and all Americans, has fallen. According to the U.S. Bureau of Labor Statistics, for Latinos, the unemployment rate declined from 11.3% in the third quarter of 2011 to 10.2% in the third quarter of 2012. In September 2012, the unemployment rate among Latinos was 9.9%. This was the lowest rate since December 2008, but still higher than the national unemployment rate of 7.8%.

Among Latino registered voters, half (52%) of those who identify with or lean toward the Democratic Party are satisfied with the nation’s direction, compared with one-quarter (26%) of those who identify with or lean toward the Republican Party.

Latino registered voters who say they their personal finances are in “excellent” or “good” shape are also more upbeat about the way things are going in the country compared with those who say their financial situation is “only fair” or “poor”—51% versus 40%.

Improving Personal Finances

Latino registered voters’ assessments of their current financial situation have improved since 2011. According to the new survey, 42% of Latino registered voters say their personal financial situation is either “excellent” or “good,” compared with 31% who said so in 2011 (Lopez, Gonzalez-Barrera and Motel, 2011).

At the same time, the gap between Latino registered voters and all registered voters on their financial assessments has closed. Today, 48% of all registered voters say their current financial situation is “excellent” or “good,” six percentage points higher than that of Latino registered voters. By contrast, in 2011, there was an 11 percentage point gap between all registered voters and Latino registered voters who had positive assessments of their personal financial situation (42% versus 31%).

Among Hispanic registered voters, demographic differences exist in their personal financial assessments. For example, Hispanic males rate their personal financial situation better than Hispanic females—48% “excellent” or “good” versus 37%. In addition, Hispanic registered voters with college experience rate their financial situation better than those with lower levels of education. Some 53% of those with at least some college and 38% of those with no more than a high school diploma rate their personal finances as “excellent” or “good.” Meanwhile, only 16% of Latinos with less than a high school diploma rate their current financial situation in positive terms.

Among Latino registered voters, bilingual Latinos and those who are English dominant rate their financial situation better than those who primarily speak Spanish—50% and 44%,  respectively, say their personal financial situation is in “excellent” or “good” shape versus 17% among the Spanish dominant.

Confidence in their Future Financial Situation

Even though fewer than half of Hispanic registered voters (42%) say their financial situation is currently “excellent” or “good,” they are optimistic about their financial future. Seven-in-ten Hispanic registered voters (70%) believe their financial situation and that of their family will improve in the next year. The general public shares this optimism, with 66% saying they expect their own financial situation and that of their family to improve in the coming year.

Among Latino registered voters, there are some differences of perceptions of finances in the next year by party identification. Democrats are more optimistic about their future financial situation than Republicans—75% versus 58%.

V. Top Issues in this Year’s Presidential Campaign

The survey finds that education, jobs and the economy, and health care are the top issues for Latinos in this year’s presidential campaign. A majority (55%) of Latino registered voters say the issue of education is “extremely important” to them personally. This is followed closely by jobs and the economy (54%) and health care (50%).

Since 2008, these three issues have ranked highly for Hispanic registered voters, though their relative rankings have changed. In 2011, jobs ranked at the top, followed by education and health care (Lopez, Gonzalez-Barrera and Motel, 2011). In 2010, education ranked at the top, followed by jobs and health care (Lopez, 2010). In 2008, as well, education ranked at the top, this time followed by the cost of living, health care and jobs (Lopez and Minushkin, 2008).

When it comes to immigration, one-third (34%) of Latino registered voters say the issue is “extremely important” to them personally. This is unchanged since 2008 (Lopez and Minushkin, 2008). This year, Latinos rank two other issues—the federal budget deficit (36%) and taxes (33%)—as important as they rank immigration.

The same three top issues are identified by both Latino registered voters and all Latinos. For all Latinos, fewer than half say that jobs and the economy (47%), education (47%) and health care (44%) are extremely important to them.

Immigration is as important to all Latinos (33%) as it is to Latino registered voters and ranks ahead of public finance issues such as the federal budget deficit (28%) and taxes (27%), which are identified as “extremely important” by lower shares of all Latinos.

VI. Latinos and Immigration Policy

In mid-June 2012, President Barack Obama announced a new program that would shield young unauthorized immigrants from deportation and allow them to apply for temporary but renewable work permits. The program, known as Deferred Action for Childhood Arrivals, provides relief from deportation unauthorized immigrants younger than 30 who were brought into the country as children and who are currently enrolled in school or have obtained a high school diploma or GED.11

According to Pew Hispanic Center estimates, up to 1.7 million unauthorized youth could potentially qualify for this program (Passel and Lopez, 2012), with about 85% of potential beneficiaries being of Hispanic origin. After the first 43 days of the program, the U.S. Department of Homeland Security reported that it had received more than 100,000 applications, with most in the last stages of review and 29 confirmed approvals (Preston, 2012).

According to the Pew Hispanic survey, fully 89% of all Latinos—and 86% of Latino registered voters—say they approve of this new immigration program. A majority (63%) of the general public also approves of the new deferred action program, though the share that does so is notably lower than it is among Latinos.12

Among Latinos, support for the program is widespread. Some 93% of foreign-born Latinos and 85% of the native born say they approve of the program. Additionally, Latinos whose primary language is Spanish have a stronger approval rate of the program (95%) than those who speak English as their primary language (82%).

Among Latino registered voters, fully 95% who identify with or lean toward the Democratic Party approve of the program, while a much smaller majority (60%) of those who identify with or lean toward the Republican Party approve of it. Latino registered voters who believe the Latino vote will have a “major impact” in the election approve of the program by a wider margin than those who believe it will have a “minor impact”—92% versus 71%. Latino registered voters who are satisfied with the country’s direction also have a higher rate of approval of the program than those who are dissatisfied—93% versus 80%.

Many Latinos say they know someone who has applied for the new program. According to the Pew Hispanic survey, three-in-ten (31%) Latino adults say they know someone who has applied or is planning to apply. Among Latino registered voters, 26% say they know someone who might be eligible for the program and has applied or is planning to do so.

Hispanics who are foreign born are more likely than those who are native born to say they personally know someone who has applied for the program or is planning to—37% versus 24%.

Among the foreign born, those who do not hold U.S. citizenship and are not legal permanent residents are most likely to say they know someone who has applied or is planning to. Almost half (48%) of those who are neither citizens nor residents say they know someone in these circumstances, compared with 37% of foreign-born Latinos who are legal residents and 28% of foreign-born naturalized Latinos.

Deportations and Detainments

Deportations13 have reached record levels under President Obama, rising to an average of nearly 400,000 per year since 2009 (U.S. Department of Homeland Security, 2012).14 In 2011, the latest year for which figures are available, the U.S. Department of Homeland Security reports that 392,000 immigrants were deported. Among them, 97% are Hispanic.

According to the Pew Hispanic survey, one-quarter (26%) of adult Latinos say they personally know someone who has been deported or detained by the federal government in the last year. Among Latino registered voters, 22% say they know someone who has been detained or deported in the past year.

Among immigrant Hispanics who hold U.S. citizenship, 22% say they personally know someone who has been detained or deported by the federal government in the past year. By contrast, three-in-ten legal resident Hispanics (29%) and Hispanics who are foreign born but do not hold U.S. citizenship and are not a legal resident of the U.S. (32%) say they personally know someone who has been detained or deported in the past year.

References

Blumberg, Stephen J., and Julian V. Luke. 2012. “Wireless Substitution: Early Release of Estimates from the National Health Interview Survey, July-December 2011.” Hyattsville, MD: National Center for Health Statistics, June.

Lopez, Mark Hugo. 2010. “Latinos and the 2010 Elections: Strong Support for Democrats; Weak Voter Motivation.” Washington, DC: Pew Hispanic Center, October.

Lopez, Mark Hugo. 2008. “The Hispanic Vote in the 2008 Election.” Washington, DC: Pew Hispanic Center, November.

Lopez, Mark Hugo, Ana Gonzalez-Barrera, and Seth Motel. 2011. “As Deportations Rise to Record Levels, Most Latinos Oppose Obama’s Policy.” Washington, DC: Pew Hispanic Center, December.

Lopez, Mark Hugo, and Gretchen Livingston. 2009. “Hispanics and the New Administration; Immigration Slips as a Top Priority.” Washington, DC: Pew Hispanic Center, January.

Lopez, Mark Hugo, and Susan Minushkin. 2008. “2008 National Survey of Latinos: Hispanic Voter Attitudes.” Washington, DC: Pew Hispanic Center, July.

Lopez, Mark Hugo, Seth Motel, and Eileen Patten. 2012. “A Record 24 Million Latinos Are Eligible to Vote, But Turnout Rate Has Lagged That of Whites, Blacks.” Washington, DC: Pew Hispanic Center, October.

National Conference of State Legislatures. 2012. “Voter ID: State Requirements.” Denver: October.

Passel, Jeffrey, and Mark Hugo Lopez. 2012. “Up to 1.7 Million Unauthorized Immigrant Youth May Benefit from New Deportation Rules.” Washington, DC: Pew Hispanic Center, August.

Pew Research Center for the People & the Press. 2012a. “Broad Support for Photo ID Voting Requirements.” Washington, DC: October.

Pew Research Center for the People & the Press. 2012b. “Obama Ahead with Stronger Support, Better Image and Lead on Most Issues; Democrats Narrow Engagement Gap.” Washington, DC: September.

Pew Research Center for the People & the Press. 2012c. “Obama Holds Lead; Romney Trails on Most Issues; Record Negatives for Supreme Court Driven by GOP Discontent.” Washington, DC: July.

Pew Research Center for the People & the Press. 2011. “The Generation Gap and the 2012 Election.” Washington, DC: November.

Preston, Julia. 2012. “A Flood of Applications, With a Trickle of Approvals.” New York Times. Sept. 28.

U.S. Department of Homeland Security. 2012. 2011 Yearbook of Immigration Statistics. Washington, DC: Office of Immigration Statistics, September.

U.S. Immigration and Customs Enforcement. 2011. “Exercising Prosecutorial Discretion Consistent with the Civil Immigration Enforcement Priorities of the Agency for the Apprehension, Detention, and Removal of Aliens.” Washington, DC: June.

Appendix A: Demographics of Latino Registered Voters

Appendix B: 2012 National Survey of Latinos Methodology

Results for this study are based on telephone interviews conducted by Social Science Research Solutions (SSRS), an independent research company, among a nationally representative sample of 1,765 Latino respondents ages 18 and older, conducted from September 7 through October 4, 2012. In order to facilitate a more comprehensive analysis of non-Catholic Latinos, the sample includes interviews with an additional 438 non-Catholic respondents, for a total of 967 non-Catholics.

For the full sample, a total of 866 respondents were native born (including Puerto Rico), and 899 were foreign born (excluding Puerto Rico). Of the foreign born, 375 were U.S. citizens, 256 were legal residents, and 264 were neither U.S. citizens nor legal residents. For results based on the total sample, one can say with 95% confidence that the error attributable to sampling is plus or minus 3.2 percentage points.

For this survey, SSRS used a staff of Spanish-speaking interviewers who, when contacting a household, were able to offer respondents the option of completing the survey in Spanish or English. A total of 805 respondents (46%) were surveyed in Spanish, and 960 respondents (54%) were interviewed in English. Any person ages 18 or older of Latino origin or descent was eligible to complete the survey.

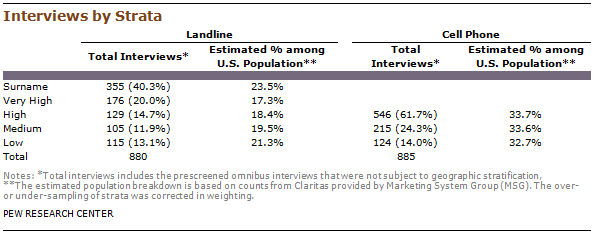
To ensure the highest possible coverage of the eligible population, the study employed a dual-frame landline/cell phone telephone design. The sample consisted of a landline component (yielding 880 completed interviews) and a cell phone component (885 interviews)15 Both the landline and cell phone components consisted of a stratified sampling design, oversampling areas with higher densities of Latino residents. The same sampling plan was used for the main sample and the non-Catholic oversample.

For the landline sampling frame, the sample was run against InfoUSA and other household databases, and phone numbers that matched to known Latino surnames were subdivided into a Surname stratum. The remaining, unmatched and unlisted landline sample was divided into the following mutually exclusive strata, based on Census estimates of the density of the Hispanic population in each: Very High Latino, High Latino, and Medium Latino.

Marketing System Group’s (MSG) GENESYS sample generation system was used to generate cell phone sample, which was divided into High and Medium Latino strata. Overall, the study employed eight strata.

Samples for the low-incidence landline and cell strata were drawn from previously interviewed respondents in SSRS’s weekly dual-frame Excel omnibus survey. Respondents who indicated they were Latino on the omnibus survey were eligible to be re-contacted for the present survey. In addition, the incidences in the Very High and Medium landline strata of the non-Catholic oversample were lower than anticipated, so additional interviews with Latinos16 prescreened from the Excel omnibus survey were used to gather additional responses in these strata. Altogether, a total of 293 previously interviewed respondents (17%) were included in this sample.

It is important to note that the existence of a surname stratum does not mean the 2012 National Survey of Latinos was a surname sample design. The sample is RDD, with the randomly selected telephone numbers divided by whether they were found to be associated with or without a Spanish surname. This was done simply to increase the number of strata and thereby increase the ability to meet ethnic targets and ease administration by allowing for more effective assignment of interviewers and labor hours.

A five-stage weighting design was used to ensure an accurate representation of the national Hispanic population.

  • An adjustment was made for all persons found to possess both a landline and a cell phone, as they were twice as likely to be sampled as were respondents who possessed only one phone type.
  • The sample was corrected for a potential bias associated with re-contacting previously interviewed respondents in certain strata.
  • The sample was corrected for the likelihood of within-household selection, which depended upon the likelihood that the respondent’s age group would be selected, and within that age group, the particular respondent would be selected.
  • The sample was corrected for the over sampling of telephone number exchanges known to have higher densities of Latinos and the corresponding undersampling of exchanges known to have lower densities of Latinos.
  • Finally, the data were put through a post-stratification sample balancing routine. The post-stratification weighting utilized national 2012 estimates from the U.S. Census Bureau’s Current Population Survey, March Supplement, on gender, age, education, Census region, heritage, years in the U.S., phone status (i.e., cell phone only, cell phone mostly, mixed/landline only/landline mostly) and density of the Latino population. After the data were raked, the weighted data were used to determine the benchmark for a Catholic/non-Catholic parameter, which was used in the second stage of raking.17