
Pew Research Center

FOR RELEASE OCTOBER 1, 2012

A Record 24 Million Latinos Are Eligible to Vote, But Turnout Rate Has Lagged That of Whites, Blacks

Due to their ongoing population growth, Latinos comprise a greater share of the nation’s eligible voters than they did just a few years ago—11.0% this year, up from 9.5% in 2008 and 8.2% in 2004. However, the turnout rate of eligible Latino voters has historically lagged that of whites and blacks by substantial margins.

BY Mark Hugo Lopez, Seth Motel and Eileen Patten

FOR MEDIA OR OTHER INQUIRIES:

Communications Department
202.419.4372
www.pewresearch.org

RECOMMENDED CITATION

Pew Research Center, October 2012, "A Record 24 Million Latinos Are Eligible to Vote, But Turnout Rate Has Lagged That of Whites, Blacks"

About Pew Research Center

Pew Research Center is a nonpartisan, nonadvocacy fact tank that informs the public about the issues, attitudes and trends shaping the world. It does not take policy positions. The Center conducts public opinion polling, demographic research, computational social science research and other data-driven research. It studies politics and policy; news habits and media; the internet and technology; religion; race and ethnicity; international affairs; social, demographic and economic trends; science; research methodology and data science; and immigration and migration. Pew Research Center is a subsidiary of The Pew Charitable Trusts, its primary funder.

© Pew Research Center 2026

Table of contents

  • About Pew Research Center
  • A Record 24 Million Latinos Are Eligible to Vote, But Turnout Rate Has Lagged That of Whites, Blacks
  • II. Trends in Latino Voter Registration
  • III. The Geography of the Latino Vote
  • IV. A Profile of Latino Eligible Voters
  • V. References
  • VI. Appendix

A Record 24 Million Latinos Are Eligible to Vote, But Turnout Rate Has Lagged That of Whites, Blacks

Due to their ongoing population growth, Latinos comprise a greater share of the nation’s eligible voters than they did just a few years ago—11.0% this year, up from 9.5% in 2008 and 8.2% in 2004. However, the turnout rate of eligible Latino voters has historically lagged that of whites and blacks by substantial margins.

Trends in Latino Voter Participation

A record 23.7 million Latinos are eligible to vote in the 2012 presidential election, according to an analysis of Census Bureau data by the Pew Hispanic Center, a project of the Pew Research Center. This is up by more than 4 million, or 22%, since 2008, when 19.5 million Latinos were eligible to vote.1

Due to their ongoing  population growth, Latinos comprise a greater share of the nation’s eligible voters than they did just a few years ago—11.0% this year, up from 9.5% in 2008 and 8.2% in 2004 (Lopez and Taylor, 2009).

However, the turnout rate of eligible Latino voters has historically lagged that of whites and blacks by substantial margins. In 2008, for example, 50% of eligible Latino voters cast ballots, compared with 65% of blacks and 66% of whites (Lopez and Taylor, 2009).

Also, despite Latino population growth, the number of Latinos who said they are registered to vote fell by about 600,000 between 2008 and 2010, according to Census Bureau data. This was the only significant decline in the number of Latino registered voters in the past two decades.2

There is not yet any nationwide data on Latino voter registration levels so far in 2012. In the only four states that report such records by ethnicity—Alabama, Florida, Georgia and North Carolina—the 2012 registration levels of Hispanics have already surpassed the 2008 levels. However, these states are not necessarily representative of the nation as a whole; more so than most other states, they have experienced very rapid growth in their Hispanic population in recent years.

Latinos are the nation’s largest minority group. According to the U.S. Census Bureau, in 2011 there were 51.9 million Latinos in the U.S., making up 16.7% of the nation’s population.

As the number of Latino eligible voters has grown, so too has the number of Latinos casting votes in presidential elections. In 2008, 9.7 million Latinos cast a vote—a record then, and up from 7.6 million in 2004, also a record year.3 In addition, Latinos represent a growing share of voters. In 2008, Hispanics made up 7.4% of all voters, up from 6.0% in 2004 (Lopez and Taylor, 2009).

Nonetheless, Hispanics are still a smaller part of the potential electorate than might be expected given their rapid population growth and share of the general population. For example, according to the Pew Hispanic analysis, more than 25 million blacks are eligible to vote in 2012 as are more than 152 million whites—both larger than the Hispanic electorate.

Part of the reason for this difference is that Hispanics are younger and less likely to hold citizenship than other groups. Overall, more than half (55%) of all Hispanics are not eligible to vote because they are under age 18 or are an adult that does not hold U.S. citizenship. By comparison, about one-in-five (21%) whites, less than one-third (31%) of blacks and 46% of Asians are ineligible to vote.

This report explores electoral participation trends among Hispanics in recent presidential election cycles. It also provides a snapshot of the geography and demography of the Hispanic vote in 2012, with a special focus on the so-called “battleground states.” Accompanying this report are state profiles of Latino eligible voters in 41 states and the District of Columbia, each based on data from the 2010 American Community Survey. Also accompanying this report is an interactive mapshowing key characteristics of Latino voters in all 50 states and the District of Columbia.

About This Report

This report explores trends in Latino voter participation in U.S. presidential elections. It also examines the geographic distribution of Latino voters across the U.S.

The data for this report are derived from three main sources. The first is the November Voting and Registration Supplement of the Current Population Survey (CPS). The CPS is a monthly survey of about 55,000 households conducted by the Census Bureau for the U.S. Bureau of Labor Statistics. The CPS is representative of the non-institutionalized population of the U.S. It does not include data on the voting behavior of enlisted military personnel and those who are institutionalized. The November Voting and Registration Supplement of the CPS is one of the richest sources of information available about the characteristics of voters. It is conducted after Election Day and relies on survey respondent self-reports of voting and voter registration. In addition to the November Voting and Registration Supplement to the Current Population Survey, this report also uses the August 2012 Current Population Survey.

The second data source is the 2010 American Community Survey (1% IPUMS). The 2010 provides detailed geographic, demographic and economic characteristics for Latino and non-Latino eligible voters and is the main source for the state-level analysis of this report.

Voter registration data for Latino voters in the states of Alabama, Florida, Georgia and North Carolina are from voter registration statistics published by each state.

Accompanying this report are state profiles of Latino eligible voters in 41 states and the District of Columbia.4 Also accompanying this report is an interactive map showing key characteristics of Latino voters in the 50 states and the District of Columbia.

This report was written by Mark Hugo Lopez. Analysis for the report was provided by Seth Motel and Eileen Patten. Motel and Patten wrote the state fact sheet reports. Paul Taylor provided editorial guidance and comments. Jeffrey Passel and Rakesh Kochhar provided comments. Antonio Rodriguez provided research assistance. Eileen Patten number-checked the report. Bruce Drake was the copy editor.

A Note on Terminology

The terms “Latino” and “Hispanic” are used interchangeably in this report.

References to other races and ethnicities are to the non-Hispanic components of those populations. “Asian” does not include Pacific Islanders.

“Eligible voters” refers to persons ages 18 and older who are U.S. citizens.

For findings based on CPS data, “registered voters” refers to persons who self-report that they are registered to vote in the November Voting and Registration Supplement of the CPS.

For findings based on state voter registration data, “registered voters” refers to tallies of registered voters reported by state election officials.

“Voters” are those who say they voted in the Voting and Registration Supplement of the CPS.

“Voter turnout rate” is the share of eligible voters who say they voted.

“Battleground states” were identified by the Pew Research Center using state ratings in September from The Cook Political Report, MSNBC, The New York Times, Real Clear Politics, Karl Rove, CNN, Pollster.com and the Washington Post.
II. Trends in Latino Voter Registration

Just as the number of Hispanics eligible to vote in the nation’s elections has grown, so too has the number of Hispanics who are registered to vote. Since 1986, the number of Hispanic registered voters has more than doubled, reaching a record 11.6 million in 2008.

However, in 2010, according to an analysis of data from the Voting and Registration supplement of the November CPS supplement, the number of Hispanic registered voters was 11.0 million, down from the record 11.6 million in 2008.5

There are several possible reasons for this decline. First, 2008 was an historic election year with a record voter turnout. The Democratic primary contest between Barack Obama and Hillary Clinton generated high level of interest among Latino voters, including the many who live in California and Texas, states that, because of their position on the primary calendar, often don’t have much of a say in the outcome of the race (Minushkin and Lopez, 2008). This may have contributed to a spike in Latino voter registration to 11.6 million from 9.3 million in 2006. Overall, nearly half (48%) of all Hispanic eligible voters reside in California and Texas.

Second, the economic downturn may have impacted voter registration of Latinos. Because the foreclosure and housing crisis hit Hispanics harder than other groups, many Hispanics may have had to move. That could mean that a disproportionate share of their voter registrations lapsed as a result of a change of address (Gonzalez, 2012).

While national data on voter registrations among Hispanics won’t be available until after the November election, some states do publish voter registration statistics for Hispanics.

According to the Florida Department of State Division of Elections, the number of Hispanics registered to vote in that battleground state stood at 1.6 million as of July 16, 2012, up from 1.4 million in 2008. In Georgia, the Secretary of State Elections Division reports that 105,000 Hispanics are registered to vote this year, up from 82,000 in 2008. In the case of North Carolina, another battleground state, the State Board of Elections reports that 102,000 Hispanics are registered to vote as of September 22, up from 68,000 in 2008. The Secretary of State Elections Division in Alabama reports that 15,000 Hispanics were registered to vote as of August, up from 12,000 in 2008.

Growth in the number of Hispanic registered voters in each state may reflect Hispanic population growth. Between 2000 and 2010, Alabama, Georgia and North Carolina experienced some of the fastest Hispanic population growth. In each, the Hispanic population doubled or nearly doubled (Passel, Cohn and Lopez, 2011).

III. The Geography of the Latino Vote

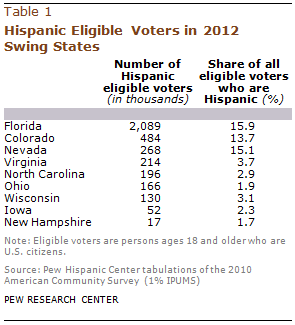
Some 17% of all Hispanic eligible voters live in this year’s battleground states—Colorado, Florida, Iowa, Nevada, New Hampshire, North Carolina, Ohio, Virginia and Wisconsin.6 And among eligible voters in the battleground states, 8% are Hispanic. In some battleground states, there is a sizeable number of Hispanic eligible voters. For example, in Florida there are more than 2 million Hispanics who are eligible to vote, making up 15.9% of the state’s eligible voters.

However, most potential Latino voters do not live in battleground states. More than half (55%) live in just three states—California, Texas and New York. When other non-battleground states with large Latino populations are included—Arizona, Illinois, New Jersey and New Mexico—two-thirds (68%) of the Latino electorate is accounted for.

Nonetheless the presence of Hispanics in this year’s battleground states has grown since 2008. The battleground states of Florida, Colorado and Nevada each have large Hispanic populations that have grown in size and share since 2008. In Florida, for example, the number of Hispanics eligible to vote grew by 244,000 between 2008 and 2010. Their share also increased, rising to 15.9% from 14.5% in 2008.

In Virginia and North Carolina, Hispanics are also a larger presence among eligible voters in 2012 compared with 2008, though their shares remain small—3.7% and 2.9% respectively. In some other battlegrounds, the number of Hispanic eligible voters is below 2%. For example, in Ohio, while there are 166,000 Hispanic eligible voters, they make up just 1.9% of the all eligible voters there. In the case of New Hampshire, the size and share of the Hispanic electorate is even smaller—17,000 and 1.7%, respectively.

IV. A Profile of Latino Eligible Voters

The Latino electorate is demographically different from other groups of eligible voters, and also it is different than the nation’s Hispanic population overall.

According to Pew Hispanic tabulations of the 2012 August Current Population Survey, Latino eligible voters are younger than either white or black eligible voters. Overall, nearly one-third (32%) of all Hispanic eligible voters are ages 18 to 29, compared with 19% among whites and 25% among blacks.  In addition, a smaller share (11%) of Latino eligible voters are ages 65 or older, compared with white (21%) or black (14%) eligible voters.

Hispanic eligible voters are also more likely to be naturalized U.S. citizens than either white eligible voters or black eligible voters. One-quarter of all Hispanic eligible voters are naturalized U.S. citizens, while just 3% of white eligible voters and 7% of black eligible voters are naturalized U.S. citizens.

Among Latino eligible voters, 58% are of Mexican origin, 14% are of Puerto Rican origin, 6% are of Cuban origin and 22% are of Central American, South American or other Hispanic origin, according to the Pew Hispanic analysis. This differs from the overall Hispanic origin distribution of the general U.S. Hispanic population in which some 64% are of Mexican origin, 9% are Puerto Rican and 5% are Cuban origin.

V. References

Gonzalez, Antonio. 2012. “Recent Trends and Challenges for the Latino Vote.” San Antonio, TX: William C. Velasquez Institute, March.

Lopez, Mark Hugo. 2011. “The Latino Electorate in 2010: More Voters, More Non-Voters.” Washington, DC: Pew Hispanic Center, April.

Lopez, Mark Hugo, and Paul Taylor. 2009. “Dissecting the 2008 Electorate: Most Diverse in U.S. History.” Washington, DC: Pew Hispanic Center, April.

Minushkin, Susan, and Mark Hugo Lopez. 2008. “The Hispanic Vote in the 2008 Democratic Presidential Primaries.” Washington, DC: Pew Hispanic Center, March.

Passel, Jeffrey, and D’Vera Cohn. 2010. “U.S. Unauthorized Immigrant Flows Are Down Sharply Since Mid-Decade.” Washington, DC: Pew Hispanic Center, September.

Passel, Jeffrey, D’Vera Cohn and Mark Hugo Lopez. 2011. “Hispanics Account for More than Half of Nation’s Growth in Past Decade.” Washington, DC: Pew Hispanic Center, March.

VI. Appendix