
Pew Research Center

FOR RELEASE SEPTEMBER 19, 2012

Characteristics of the 60 Largest Metropolitan Areas by Hispanic Population

Nearly half (45%) of the nation’s Hispanic population lives in just 10 metropolitan areas and over 75% live in 60 of the largest Hispanic metropolitan areas, according to an analysis of Census Bureau data by the Pew Hispanic Center.

BY Seth Motel and Eileen Patten

FOR MEDIA OR OTHER INQUIRIES:

Communications Department
202.419.4372
www.pewresearch.org

RECOMMENDED CITATION

Pew Research Center, September 2012, "Characteristics of the 60 Largest Metropolitan Areas by Hispanic Population"

About Pew Research Center

Pew Research Center is a nonpartisan, nonadvocacy fact tank that informs the public about the issues, attitudes and trends shaping the world. It does not take policy positions. The Center conducts public opinion polling, demographic research, computational social science research and other data-driven research. It studies politics and policy; news habits and media; the internet and technology; religion; race and ethnicity; international affairs; social, demographic and economic trends; science; research methodology and data science; and immigration and migration. Pew Research Center is a subsidiary of The Pew Charitable Trusts, its primary funder.

© Pew Research Center 2026

Table of contents

  • About Pew Research Center
  • Characteristics of the 60 Largest Metropolitan Areas by Hispanic Population
  • II. Demographics
  • III. Educational Attainment
  • IV. English Proficiency and U.S. Citizenship
  • V. Economics and Health Insurance
  • VI. Appendix A

Characteristics of the 60 Largest Metropolitan Areas by Hispanic Population

Nearly half (45%) of the nation’s Hispanic population lives in just 10 metropolitan areas and over 75% live in 60 of the largest Hispanic metropolitan areas, according to an analysis of Census Bureau data by the Pew Hispanic Center.

Overview
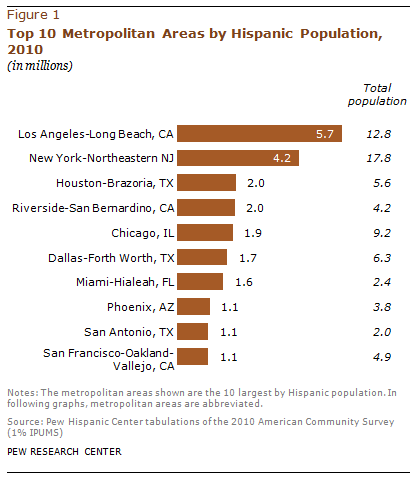
Nearly half (45%) of the nation’s Hispanic1 population lives in just 10 metropolitan areas, according to tabulations of the 2010 American Community Survey (ACS) by the Pew Hispanic Center, a project of the Pew Research Center.2

The Los Angeles-Long Beach, Calif., metropolitan area has the nation’s largest Hispanic population—5.7 million—and alone accounts for more than one-in-ten (11%) Hispanics nationally.3 All population estimates presented in this report are for Hispanics living in the 50 states and the District of Columbia.  The New York-Northeastern New Jersey metropolitan area is the second largest by Hispanic population (4.2 million) and is home to 8% of Hispanics nationwide.

Six of the 10 largest Hispanic metropolitan populations are in just two states. California has three–Los Angeles (#1), Riverside-San Bernardino (#4) and San Francisco-Oakland-Vallejo (#10). Texas is also home to three of the 10 largest Hispanic metropolitan areas—Houston-Brazoria (#3), Dallas-Fort Worth (#6) and San Antonio (#9). The other four largest Hispanic metropolitan populations are New York (#2); Chicago, Ill. (#5); Miami-Hialeah, Fla. (#7); and Phoenix, Ariz. (#8). Overall, each of the 10 largest Hispanic metropolitan areas has a Hispanic population of more than 1 million and Hispanics are the largest minority or ethnic group in each.

While these 10 metropolitan areas represent the largest Hispanic populations, within each area, the Hispanic share varies, as do the characteristics of the Hispanic population that resides in each area.

For example, the Hispanic share in each of the 10 largest metro area populations ranges from a low of 21% in Chicago to a high of 66% in Miami. Miami and San Antonio (55%) are the only two metro areas among the 10 largest where Hispanics are a majority of the population. Among the top 60, Hispanics are a majority in 11 additional metropolitan areas.

Overall, Los Angeles and New York have the largest Hispanic populations. In Los Angeles, Hispanics make up 45% of the area’s residents. In the New York metropolitan area, Hispanics make up about one-in-four (24%) of all residents.

Among the 60 metropolitan areas with the largest Latino populations, two have Latino population shares above 90%. The population of Laredo, Texas—with the 36th largest Latino population—is 96% Latino. The McAllen-Edinburg-Pharr-Mission, Texas, metropolitan area—which has the 13th largest Hispanic population—is 91% Latino.

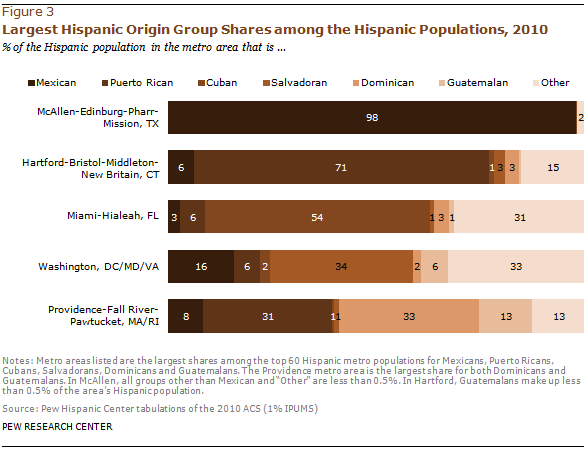
The Hispanic origin composition in the top 60 metropolitan areas also varies. For example, Cubans are the largest Hispanic origin group in Miami and make up more than half (54%) of all Hispanics there. In the Washington, D.C./Maryland/Virginia, area—the 12th largest Hispanic metropolitan population—the largest Hispanic origin group is Salvadoran, making up 34% of the area’s Hispanic population. Puerto Ricans are the largest Hispanic origin group in Philadelphia, Pennsylvania/New Jersey—the 24th largest Hispanic metropolitan area—making up more than half (53%) of all Hispanics there.

Mexican-Americans are by far the nation’s largest Hispanic origin group, comprising 65% of the total Hispanic population in the United States. They are also the largest Hispanic origin group in 50 of the 60 metropolitan areas covered by this report, and make up more than half of the Hispanic population in 46 of them. In 33 of these metro areas Mexicans are not only the largest Hispanic origin group, they are also bigger than any other racial or ethnic group.

This report compares the 10 metropolitan areas with the largest Hispanic populations on a range of demographic and socioeconomic variables—including Hispanic origin, age, nativity, citizenship, education, English proficiency, household income, homeownership, poverty and health insurance.

Accompanying this report are statistical profiles for each of the 60 largest metropolitan areas by Hispanic population. Each statistical profile describes the demographic, employment and income characteristics of the Hispanic population in that metropolitan area, as well as the area’s non-Hispanic white and black populations. Also accompanying the report are two interactive maps showing key characteristics of the Hispanic population in each of the nation’s 60 largest metropolitan areas by Hispanic population and the distribution of the six largest Hispanic origin groups across the nation’s more than 3,000 counties.

About this Report

This report examines the Hispanic populations in the United States’ 10 metropolitan areas with the largest number of Hispanics. It also contains detailed information on the next 50 largest metropolitan areas by Hispanic population.

The data for this report are derived from the 2010 American Community Survey (1% IPUMS), which provides detailed geographic, demographic and economic characteristics for each group.

Accompanying this report are statistical profiles of the 60 largest metropolitan areas by Hispanic population. Each statistical profile describes the demographic and economic characteristics of the Hispanic, non-Hispanic white and non-Hispanic black populations in that metropolitan area.

Also accompanying the report are two interactive maps. The first shows key characteristics of the Hispanic population in each of the nation’s 60 largest Hispanic metropolitan areas. The interactive also shows the largest Hispanic metropolitan populations and shares for the six largest Hispanic origin groups—Mexicans, Puerto Ricans, Salvadorans, Cubans, Dominicans and Guatemalans. The second interactive map shows the distribution of the six largest Hispanic origin groups across the nation’s more than 3,000 counties.

About the Authors

Seth Motel is a research assistant at the Pew Hispanic Center. Motel earned his B.A. in political science from Brown University.

Eileen Patten is a research assistant at the Pew Hispanic Center. Patten earned her B.A. in sociology and English from the University of Michigan.

Acknowledgements

The authors thank Paul Taylor and Mark Hugo Lopez for editorial guidance. Lopez and Rakesh Kochhar provided comments on earlier drafts of this report. Lopez checked numbers in the report. Molly Rohal was the copy editor.

II. Demographics

Hispanic Origin4

  • Among the 10 largest metropolitan areas by Hispanic population, Mexicans are the largest Hispanic origin group in eight. The Mexican share in these eight areas ranges from a low of 71% in the San Francisco metropolitan area to a high of 91% in San Antonio. In Miami and New York, by contrast, Mexicans are not the largest group. More than half (54%) of the Miami metropolitan area’s Hispanic population is Cuban. In the New York metropolitan area, Puerto Ricans are the largest Hispanic group, making up 27% of all Hispanics. They are closely followed by Dominicans, who make up 21% of the New York metropolitan area’s Hispanic population.

  • Mexicans are the largest Hispanic origin group in 50 of the top 60 metro areas, and they account for 95% or more of the Hispanic population in eight metro areas in the top 60. The Mexican share is highest in McAllen, Texas, where they account for nearly all (98%) of the area’s Hispanics.5
  • Among the top 60 metro areas, Hartford-Bristol-Middleton-New Britain, Conn.—the 53rd largest Hispanic population—has the largest share of Puerto Ricans among its Hispanic population (71%). Miami, whose Hispanic population is 54% Cuban, is the only top 60 metro area with a Hispanic population that is more than one-quarter Cuban. The greatest share of Hispanics that are Salvadoran (34%) reside in the Washington area, which is 12th largest by Hispanic population. The top 60 metro area with the highest share of Dominicans among its Hispanic population (33%) is Providence-Fall River-Pawtucket, Mass./R.I., which ranks 51st by Hispanic population. Providence also has the highest Guatemalan share (13%) among the top 60 metro areas.

Age

  • Median ages among Hispanics in the top 10 Hispanic metro areas range from a low of 24 years (Phoenix) to a high of 39 years (Miami). For all U.S. Hispanics, the median age is 27. For the total U.S. population, the median age is 37.
  • The Hispanic population residing in metropolitan areas tends to be younger than the total population in those areas. This is true in each of the top 10 Hispanic metropolitan populations, with the exception of Miami, where the median Hispanic age is only one year higher than that of the total population (39 years vs. 38 years).
  • In the Phoenix and Dallas areas, 38% of the Hispanic population is younger than 18—the highest among the top 10. By contrast, in Miami that share is only 20%, the lowest in the top 60. Four metro areas in the top 60 have Hispanic populations with 40% younger than age 18.6

  • Miami also has the largest share of Hispanic adults ages 65 and older among the top 60 metro areas (15%). Dallas has the lowest share of elderly Latinos among the top 10 metro areas—just 3%. Among Hispanics in the Indianapolis, Ind. metro area (the 60th largest by Hispanic population), just 1% are ages 65 and older.

Nativity

  • In Miami, two-thirds (67%) of the Hispanic population is foreign born. This is the highest foreign-born share among Hispanics in any of the top 60 metro areas and the only top 10 metro area in which more than half of Hispanics are foreign born. By contrast, only 18% of Hispanics in the San Antonio area are foreign born. For U.S. Hispanics overall, the foreign-born share is 37%.

  • Among the top 60 metro areas by Hispanic population, Corpus Christi, Texas has the lowest foreign-born share at 7%. Corpus Christi is the 46th largest metropolitan area by Hispanic population and is the only metropolitan area in the top 60 where fewer than one-in-ten Hispanics were born outside the U.S.

III. Educational Attainment

Less than High School Diploma

  • Among Hispanics ages 25 and older in the top 10 metro areas, Dallas has the highest share without a high school diploma—46%. Dallas is followed closely by the Los Angeles and Houston areas—both with 44%.

  • Miami has the lowest share (26%) of Hispanics without a high school diploma among the top 10 metropolitan areas.
  • In each of these metro areas, the share of Hispanics without a high school diploma is larger than that of the area’s total population. Similarly, for U.S. Hispanics overall, the share of those ages 25 and older without a high school diploma is 38%, compared with 14% of the total U.S. population ages 25 and older.
  • In the top 60 Hispanic metro areas more broadly, three have a majority of Hispanic adults lacking high school diplomas. Some 52% of Hispanic adults in Salinas-Sea Side-Monterey, Calif. (49th biggest Hispanic population) and 51% of Hispanic adults in Visalia-Tulare-Porterville, Calif. (32nd biggest) and Bakersfield, Calif. (25th biggest) lack a high school diploma.
  • Fort Lauderdale-Hollywood-Pompano Beach, Fla., which has the 23rd largest Hispanic population, has the smallest share of Hispanic adults without a high school diploma (17%).

Bachelor’s Degree or More

  • Among the top 10 metropolitan areas by Hispanic population, the share of Hispanics ages 25 and older with at least a bachelor’s degree is highest in the Miami area—23%. Miami leads the next most highly educated metro area, San Francisco (16%), by seven percentage points.

  • The metro area in the top 10 with the lowest share of Hispanics who are college-educated is Riverside, where less than one-in-ten Hispanics (8%) ages 25 and older have a four-year college degree.
  • In each of these metro areas, the share of Hispanics with a bachelor’s degree or more is lower than the share of the total population in that area that has a bachelor’s degree. Similarly, among all U.S. Hispanics ages 25 and older, the share with a bachelor’s degree or more is 13%, compared with 28% of the total U.S. population ages 25 and older.
  • Fort Lauderdale, Fla. (the 23rd largest Hispanic population), leads the 60 metropolitan areas in the share of Hispanic adults with a bachelor’s degree or higher—more than one-in-four (28%) Hispanic adults 25 and older have a bachelor’s degree.
  • Among the top 60 metropolitan areas, the share of Hispanic adults 25 and older with a bachelor’s degree is lowest in Visalia, Calif. (the 32nd largest Hispanic population), and Bakersfield, Calif. (25th largest). In both metro areas, just 5% of Hispanic adults have a bachelor’s degree.

IV. English Proficiency and U.S. Citizenship

English Proficiency

  • Among the 10 largest Hispanic metropolitan areas, San Antonio has the highest share of Hispanics ages 5 and older who are proficient in English (81%)—that is, who speak only English at home or who otherwise speak English “very well.”

  • By comparison, slightly more than half (52%) of Hispanics ages 5 and older in Miami are proficient in English.
  • Nearly two-thirds (65%) of all U.S. Hispanics ages 5 and older are proficient in English.
  • Other than San Antonio, two metropolitan areas among the top 60 have rates of English proficiency above 80%. Albuquerque, N.M., has an 85% proficiency rate among Hispanics ages 5 and older and Corpus Christi, Texas, is second with 84%; they are ranked 26th and 46th in Hispanic population, respectively.

U.S. Citizenship

  • San Antonio has the highest rate of U.S. citizenship among Hispanics in the top 10 metropolitan areas (88%). Its share is well above the other metro areas in the top 10. (Riverside is second with 78%.)

  • Miami has the lowest rate of U.S. citizenship among its Hispanic population (66%).
  • Nearly three-quarters (74%) of all U.S. Hispanics are U.S. citizens by birth or naturalization.

V. Economics and Health Insurance

Household Income

  • The median annual household incomes among Hispanics in the 10 largest metropolitan areas range from a low of $35,600 in Phoenix to a high of $55,000 in San Francisco.

  • The San Francisco area also ranks highest in terms of median annual personal earnings of full-time workers ($36,000). By that metric, Hispanics in the Dallas area have the lowest personal earnings among the 10 areas ($26,000).
  • In each of the 10 metro areas, the median annual household income for Hispanics is less than that of the general population. Similarly, the median annual household income of all U.S. Hispanics is $40,000, compared with $49,800 for the total U.S. population.
  • The highest Hispanic median household incomes among the top 60 metropolitan areas are in the Washington metro area ($62,000) and Baltimore, Md. ($56,400)—which have the 12th and 56th largest Hispanic populations, respectively.
  • Brownsville-Harlingen-San Benito, Texas, which is the 29th largest metropolitan area by Hispanic population, has the lowest median Hispanic household income in the top 60, at $28,600.

Homeownership

  • Hispanics living in the San Antonio and Riverside metro areas have the highest rates of homeownership among the 10 largest Hispanic metropolitan areas (both 58%).

  • Only a quarter of Hispanic household heads living in the New York area own their homes—the lowest share among the top 60 metro areas. The San Francisco and Los Angeles metro areas are the only others in the top 10 to have homeownership rates below 50%.
  • The homeownership rate of Hispanics in each of the 10 metro areas is less than the area’s overall rate. Similarly, the homeownership rate of all U.S. Hispanics (47%) is lower than that of the total U.S. population (65%).
  • Among the top 60 metro areas, McAllen, Texas, has the highest share of homeowners among Hispanics, with 68%.

Poverty

  • As well as having the lowest household income, the Phoenix area has the highest Hispanic poverty rate (28%) among the top 10 Hispanic metropolitan areas.

  • Additionally, one-third (34%) of Hispanic children younger than 18 in Phoenix live below the poverty line. An equal share of children in the Houston area live below the poverty line.
  • Among these 10 metro areas, Hispanics in San Francisco have the lowest poverty rates overall (17%) and among children (23%).
  • In nine of the 10 metro areas, the Hispanic poverty rates are higher both overall and for children than among the areas’ general populations. In the Miami area, an equal share (20%) of all Hispanic residents and all residents live below the poverty line, and the share is similar for Hispanics younger than 18 (24%) and all residents younger than 18 (25%).
  • Among the top 60 Hispanic metro areas, Brownsville, Texas—which has the 29th largest Hispanic population—has the highest rate of poverty among both all Hispanics (40%) and Hispanic children (51%). It is the only metro area among the top 60 that has a Hispanic poverty rate of at least 40% and the only one with a Hispanic child poverty rate of more than 50%.
  • The Washington metro area (the 12th largest Hispanic metro population) has the lowest share of poverty among both all Hispanics (12%) and Hispanics younger than age 18 (15%), followed by the 56th largest Hispanic metro population, Baltimore, which has an overall Hispanic poverty rate of 14% and a Hispanic child poverty rate of 17%.

Health Insurance

  • Houston has the highest share of Hispanics without health insurance among the top 10 Hispanic metropolitan areas (43%); it also has the highest share of children younger than 18 without health insurance (25%).

  • San Francisco has the lowest rate of uninsured among the top 10 Hispanic metro areas (24%). Chicago has the lowest share of children younger than 18 without health insurance (7%).
  • In all of the 10 metro areas, the share of Hispanics without health insurance (both total and children) is greater than that of the area’s total population.
  • Atlanta, Ga.—the 19th largest metropolitan area by Hispanic population—is the only top 60 metro area in which a majority of Hispanics are uninsured (51%). Salt Lake City-Ogden, Utah—the 35th largest metro area—has the highest share of Hispanic children without health insurance, at 28%.
  • The Boston, Mass.-N.H., metro area—the 27th largest Hispanic population—has the lowest share of all Hispanics (11%) and Hispanics younger than 18 (2%) without health insurance among the top 60 metro areas.

VI. Appendix A