
Pew Research Center

FOR RELEASE JUNE 27, 2012

The 10 Largest Hispanic Origin Groups: Characteristics, Rankings, Top Counties

Among the 50.7 million Hispanics in the United States, nearly two-thirds (65%), or 33 million, self-identify as being of Mexican origin, according to tabulations of the 2010 American Community Survey.

BY Seth Motel and Eileen Patten

FOR MEDIA OR OTHER INQUIRIES:

Communications Department
202.419.4372
www.pewresearch.org

RECOMMENDED CITATION

Pew Research Center, June 2012, "The 10 Largest Hispanic Origin Groups: Characteristics, Rankings, Top Counties"

About Pew Research Center

Pew Research Center is a nonpartisan, nonadvocacy fact tank that informs the public about the issues, attitudes and trends shaping the world. It does not take policy positions. The Center conducts public opinion polling, demographic research, computational social science research and other data-driven research. It studies politics and policy; news habits and media; the internet and technology; religion; race and ethnicity; international affairs; social, demographic and economic trends; science; research methodology and data science; and immigration and migration. Pew Research Center is a subsidiary of The Pew Charitable Trusts, its primary funder.

© Pew Research Center 2026

Table of contents

  • About Pew Research Center
  • The 10 Largest Hispanic Origin Groups: Characteristics, Rankings, Top Counties
  • II. Demographics
  • III. Educational Attainment
  • IV. English Proficiency and Citizenship
  • V. Economics and Health Insurance
  • VI. Regional Distribution of Hispanic Origin Groups
  • VII. Changes in the Characteristics of the Hispanic Population, 2000 to 2010
  • Appendix A

The 10 Largest Hispanic Origin Groups: Characteristics, Rankings, Top Counties

Among the 50.7 million Hispanics in the United States, nearly two-thirds (65%), or 33 million, self-identify as being of Mexican origin, according to tabulations of the 2010 American Community Survey.

I. Overview
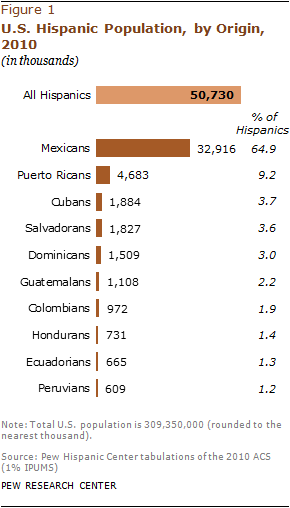
Among the 50.7 million Hispanics in the United States, nearly two-thirds (65%), or 33 million, self-identify as being of Mexican origin, according to tabulations of the 2010 American Community Survey (ACS) by the Pew Hispanic Center, a project of the Pew Research Center. No other Hispanic subgroup rivals the size of the Mexican-origin population. Puerto Ricans, the nation’s second largest Hispanic origin group, make up just 9% of the total Hispanic population in the 50 states and the District of Columbia.1

Overall, the 10 largest Hispanic origin groups—Mexicans, Puerto Ricans, Cubans, Salvadorans, Dominicans, Guatemalans, Colombians, Hondurans, Ecuadorians and Peruvians—make up 92% of the U.S. Hispanic population.2 Six Hispanic origin groups have populations greater than 1 million.

Hispanic origin groups differ from each other in a number of ways. For instance, U.S. Hispanics of Mexican origin have the lowest median age, at 25 years, while Hispanics of Cuban origin have the highest median age, at 40 years. Colombians are the most likely to have a college degree (32%) while Salvadorans are the least likely (7%). Ecuadorians have the highest annual median household income ($50,000) while Dominicans have the lowest ($34,000). Half of Hondurans do not have health insurance—the highest share among Hispanic origin groups. By contrast, just 15% of Puerto Ricans do not have health insurance.

Top Regions and Counties

Hispanic subgroups also differ in their states, regions and counties of geographic concentration. Mexicans, Salvadorans and Guatemalans are largely concentrated in western states, while Cubans, Colombians, Hondurans and Peruvians are largely concentrated in the South. The largest numbers of Puerto Ricans, Dominicans and Ecuadorians are in the Northeast.

The nation’s Cuban population is the most concentrated. Nearly half (48%) live in one county—Miami-Dade County in Florida. Miami-Dade County is also home to the nation’s largest Colombian, Honduran and Peruvian communities.

For Mexicans, Salvadorans and Guatemalans, Los Angeles County in California contains each group’s largest community. Los Angeles County alone contains 9% of the nation’s Hispanic population. Bronx County in New York contains the largest Puerto Rican and Dominican populations. And Queens County in New York contains the largest Ecuadorian population.

Changes since 2000

This report also includes an analysis of changes in the characteristics of the 10 largest Hispanic origin groups from 2000 to 2010.

During the decade, the foreign-born share of each major Hispanic origin group declined. Among all Hispanics, the share foreign born fell from 40% in 2000 to 37% in 2010. Meanwhile the share holding U.S. citizenship increased from 71% in 2000 to 74% in 2010. Among all foreign-born Hispanics, the share holding U.S. citizenship increased from 28% in 2000 to 29% in 2010.

Hispanics have made gains in terms of their educational attainment during the decade. In each of the 10 groups, the share ages 25 and older with a college degree increased. Among all Hispanics, the share with a college degree increased from 10% in 2000 to 13% in 2010.

Defining Hispanic Origin

Hispanic origin is based on self-described family ancestry or place of birth in response to a question on the Census Bureau’s American Community Survey. Ancestry is not necessarily the same as the place of birth of the respondent, nor is it indicative of immigrant or citizenship status. For example a U.S. citizen born in Los Angeles of Mexican immigrant parents or grandparents may (or may not) identify his or her Hispanic origin as Mexico. Likewise, some immigrants born in Mexico may identify another country as their origin depending on the place of birth of their ancestors.

However, most Hispanic origin groups had lower median household incomes in 2010 than in 2000 (adjusted to 2010 dollars). Overall, median household income among Hispanics fell from $43,100 in 2000 to $40,000 in 2010—a decrease of 7%. And the share living in poverty increased two percentage points, from 23% in 2000 to 25% in 2010.3 Among all U.S. households, median household income (in 2010 dollars) fell from $54,200 in 2000 to $49,800 in 2010—a drop of $4,400 or 8%.4 The poverty rate for all Americans increased by three percentage points over the same period.

Hispanics are the nation’s largest minority group, representing 16.4% of the U.S. population. By comparison, non-Hispanic blacks, who are the nation’s second largest minority group, represent 12.3% of the nation’s population and non-Hispanic Asians rank third at 4.7%.5

Hispanics are also the nation’s largest immigrant group and one of its fastest growing populations. According to the Census Bureau, Hispanic population growth between 2000 and 2010 accounted for more than half of the nation’s population growth (Passel, Cohn and Lopez, 2011). Among the nation’s 40 million immigrants, nearly half (47%) are Hispanic (Pew Hispanic Center, 2012).

2011). Among the nation’s 40 million immigrants, nearly half (47%) are Hispanic (Pew Hispanic Center, 2012).

This report compares the 10 largest Hispanic origin groups in the U.S. on several characteristics. In addition, accompanying this report are 10 statistical profiles—one for each Hispanic origin group. Each statistical profile describes the demographic, employment and income characteristics of a Hispanic origin population residing in the 50 states and the District of Columbia. The characteristics of an origin group are also compared with all Hispanics and the U.S. population overall.

This report uses data from the 2010 American Community Survey (ACS), the 2010 U.S. Census and the 2000 U.S. Census (5% IPUMS). The accompanying Hispanic origin profiles use data from the 2010 ACS.

About this Report

This report examines the Hispanic population of the United States by its 10 largest origin groups.

The data for this report are derived from the 2010 American Community Survey (1% IPUMS), which provides detailed geographic, demographic and economic characteristics for each group. The 2000 Census (5% IPUMS) provides data for comparisons in the summary.

Accompanying this report are profiles of the 10 largest Hispanic origin groups—Mexicans, Puerto Ricans, Salvadorans, Cubans, Dominicans, Guatemalans, Colombians, Hondurans, Ecuadorians and Peruvians. Also accompanying this report is an interactive graphic ranking these groups on several characteristics.

About the Authors

Seth Motel is a research assistant at the Pew Hispanic Center. Motel earned his B.A. in political science from Brown University.

Eileen Patten is a research assistant at the Pew Hispanic Center. Patten earned her B.A. in sociology and English from the University of Michigan.

Acknowledgements

The authors thank Paul Taylor for editorial guidance. Mark Lopez and Rakesh Kochhar provided comments. Antonio Rodriguez checked numbers in the report. Molly Rohal was the copy editor.

II. Demographics

Nativity

  • Nearly two-fifths (37%) of all Hispanics are foreign born, compared with 13% of the overall U.S. population.

  • The groups with the largest foreign-born shares are Guatemalans, Hondurans and Peruvians (all 67%).
  • Mexicans and Puerto Ricans are the only Hispanic origin groups with majority native-born shares. Only 36% of Mexicans and 1% of Puerto Ricans6 are foreign born.

Median Age

  • Hispanics on the whole are younger than the general U.S. population. The median age for Hispanics is 27 years while for the U.S. population it is 37 years.

  • The youngest Hispanic groups are Mexicans (25), Puerto Ricans (27) and Guatemalans (27).
  • Cubans are the oldest Hispanic group, with a median age of 40 years. Their median age is also higher than that of the U.S. population (37 years).

III. Educational Attainment

High School Diploma Only

  • About one-quarter (26%) of Hispanics ages 25 and older have only a high school diploma. This compares with 28% of the total U.S. population.

  • Puerto Ricans (30%), Cubans (29%), Colombians (27%) and Peruvians (27%) all have slightly higher shares with only a high school diploma compared with the total U.S. Hispanic population.
  • Guatemalans (22%) and Salvadorans (24%) have lower-than-average shares of adults ages 25 and older who have only a high school diploma.

Bachelor’s Degree or More

  • Some 13% of U.S. Hispanics ages 25 and older have at least a bachelor’s degree, compared with 28% of the total U.S. population of the same age.

  • The shares of Colombians (32%) and Peruvians (30%) who have a college degree or more are higher than the share of the total U.S. population with at least a bachelor’s degree.
  • Salvadorans (7%), Guatemalans (8%) and Mexicans (9%) have the lowest rates of college completion; fewer than one-in-ten adults ages 25 and older in these Hispanic groups have a bachelor’s degree.

IV. English Proficiency and Citizenship

English Proficiency

  • Nearly two-thirds (65%) of all U.S. Hispanics ages five and older either speak only English at home or speak English very well. This compares with 91% of the total U.S. population who are English proficient.

  • The Hispanic origin groups with the highest rates of English proficiency are Puerto Ricans (82%), Mexicans (64%), Colombians (59%) and Peruvians (59%).
  • Guatemalans (41%), Hondurans (42%) and Salvadorans (46%) have the lowest rates of English proficiency and are the only groups in which less than half of the population ages five and older is proficient in English.

Citizenship

  • Nearly three-in-four (74%) Hispanics are U.S. citizens, compared with 93% of the entire U.S. population.

  • Those born in Puerto Rico are U.S. citizens by birth, and fully 99% of Puerto Ricans hold citizenship.7 Cubans (74%) and Mexicans (73%) have the next highest shares of U.S. citizens.
  • Hondurans (47%) and Guatemalans (49%) are the only groups among the 10 most populous Hispanic origin groups in which less than half of their populations are U.S. citizens. Hispanics of Salvadoran origin (55%) are the third least likely group to be U.S. citizens.

V. Economics and Health Insurance

Income

  • In 2010, the median household income for Hispanics in the U.S. was $40,000, less than the U.S. median of $49,800.

  • Ecuadorians have the highest median household income among these groups, at $50,000. The median household incomes for Colombians ($49,500) and Peruvians ($48,000) are slightly less than that.
  • Dominicans ($34,000), Puerto Ricans ($36,000) and Hondurans ($38,900) rank in the bottom three on the measure of median household income.

Poverty

  • The poverty rate among Hispanics was 25% in 2010. That compares with a 15% rate for the entire U.S. A recent Pew Hispanic Center report showed that more Latino children are living in poverty than any other major racial or ethnic group (Lopez and Velasco, 2011).

  • The poverty rate is highest among Hondurans, Puerto Ricans and Mexicans (27%). They are closely followed by two groups at 26%— Dominicans and Guatemalans.
  • Only Colombians and Peruvians have poverty rates below the total U.S. rate (15%). At 13%, the poverty rate is lowest among Columbians. They are followed closely by Peruvians (14%).

Health Insurance

  • Some 31% of Hispanics do not have health insurance, about twice the share of the overall U.S. population (16%).

  • Half of Hondurans are uninsured. The next most likely to lack insurance are Guatemalans (48%) and Salvadorans (41%).
  • Puerto Ricans (15%), Dominicans (22%) and Cubans (25%) are the groups least likely to lack health insurance.

Homeownership

  • Fewer than half (47%) of Hispanic household heads own their homes, lower than the overall U.S. rate of 65%.

  • Nearly six-in-ten (57%) Cubans own their homes—the highest homeownership rate among the 10 largest Hispanic origin groups. Mexicans have the second highest homeownership rate at 50%. They are followed by Colombians and Peruvians—both with homeownership rates of 49%.
  • The three groups least likely to be homeowners are Dominicans (24%), Hondurans (29%) and Guatemalans (30%).

VI. Regional Distribution of Hispanic Origin Groups

  • Among the 10 largest Hispanic origin groups,8 all have their largest populations in just three states: California (Mexicans, Salvadorans and Guatemalans), Florida (Cubans, Colombians, Hondurans and Peruvians) or New York (Puerto Ricans, Dominicans and Ecuadorians).
  • The largest single Hispanic origin group population in a state is the Mexican population in California at 11.8 million people. Texas is home to another 8.4 million Mexicans. Together, these two states contain 61% of the total Mexican population in the U.S.
  • Among Cubans, two-thirds (67%) reside in Florida, making it the greatest population by share of any top 10 Hispanic origin group among the 50 states and the District of Colombia.

  • Miami-Dade County, Florida, has the largest populations of Cubans, Colombians, Hondurans and Peruvians of any county. For Cubans, this is particularly notable—nearly half (48%) of the nation’s Cuban population resides in Miami-Dade County.
  • Three of the 10 groups have their largest populations in Los Angeles County, California. This is the most populous county in the country for Mexicans, Salvadorans and Guatemalans. While only 11% of Mexicans residing in the U.S. live in Los Angeles County, more than one-in-five Salvadorans (22%) and Guatemalans (21%) reside there.
  • Bronx County in New York has the largest Puerto Rican and Dominican county populations. Queens County in New York has the largest Ecuadoran population among the nation’s counties.

VII. Changes in the Characteristics of the Hispanic Population, 2000 to 2010

  • The Hispanic population grew by about 15.5 million people from 2000 to 2010—a 44% increase. In 2000, there were 35.2 million Hispanics living in the U.S. Today, there are 50.7 million Hispanics.9

  • Since 2000, the foreign-born share of each major Hispanic origin group has declined. Overall, the share of Hispanics that is foreign born decreased from 40% in 2000 to 37% in 2010. The largest decline in the share foreign born—13 percentage points—was among Salvadorans (from 76% to 62%).10
  • The median age among Hispanics has risen from 25 in 2000 to 27 in 2010. The median age increased by one year among Mexicans, Salvadorans, Colombians and Peruvians. The other six Hispanic origin groups saw no increase in their median age.
  • The educational attainment of Hispanics has improved over the past 10 years. Among all Hispanics ages 25 and older, the share with less than a high school diploma is down 10 percentage points, from 48% in 2000 to 38% in 2010. The share of Dominicans without a high school education dropped the most—from 49% in 2000 to 34% in 2010.
  • Additionally, both the shares of Hispanics with a high school diploma only and Hispanics with a college degree have risen over the past decade. Between 2000 and 2010, the share with only a high school diploma increased four percentage points—from 22% to 26%. Similarly, the share with at least a bachelor’s degree increased three percentage points during the same period—from 10% to 13%.
  • English proficiency has improved across the board over the past decade. The largest growth in proficiency has been among Colombians (10 percentage points). The smallest increase has been among Hondurans (three percentage points).

  • A greater share of each of the 10 Hispanic origin groups held U.S. citizenship in 2010 compared with 2000. The greatest change was among Dominicans (13 percentage points).
  • The median household income of Hispanics overall dropped by more than $3,000 between 2000 to 2010 (in 2010 dollars). The largest decrease in income was among Peruvians ($7,723), who had the highest household income among the 10 groups in 2000 (they now rank third). Other groups experiencing large drops in household incomes from 2000 to 2010 are Cubans ($6,651) and Guatemalans ($5,578). Only one group—Colombians—experienced a net gain in its income over the decade (up about $200).
  • As household incomes declined, the share of Hispanics below the poverty line increased by two percentage points overall from 2000 to 2010. The greatest rise was among Guatemalans, for whom the share in poverty increased four percentage points. Colombians saw the largest decrease in poverty, with a drop of four percentage points.
  • Over the course of the decade, the Hispanic homeownership rate was unchanged.Only Cubans saw their homeownership rate decline—by less than one percentage point. Every other Hispanic origin subgroup saw an increase. The largest increase was among Salvadorans, with an increase of 10 percentage points.

See Appendix figure A.2 for 2000-2010 details by Hispanic origin group.

About the American Community Survey Data

The statistical profiles of U.S. Hispanics in this report and the accompanying statistical profiles are based on the Census Bureau’s 2010 American Community Survey (ACS). The ACS is the largest household survey in the United States, with a sample of about 3 million addresses. The data used come from 2010 ACS Integrated Public Use Microdata Series (IPUMS), representing a 1% sample of the U.S. population.

Like any survey, estimates from the ACS are subject to sampling error and (potentially) measurement error. Information on the ACS sampling strategy and associated error is available at http://www.census.gov/acs/www/methodology/methodology_main/. An example of measurement error is that citizenship rates for the foreign born are estimated to be overstated in the Decennial Census and other official surveys, such as the ACS (see Jeffrey Passel. “Growing Share of Immigrants Choosing Naturalization,” Pew Hispanic Center, Washington, D.C. (March 28, 2007)).

Finally, estimates from the ACS may differ from the Decennial Census or other Census Bureau surveys due to differences in methodology and data collection procedures (see, for example, http://www.census.gov/acs/www/Downloads/methodology/ASA_nelson.pdf, http://www.census.gov/hhes/www/laborfor/laborfactsheet092209.html and http://www.census.gov/hhes/www/poverty/about/datasources/factsheet.html).

Appendix A