Pew Research Center

FOR RELEASE DECEMBER 28, 2011

As Deportations Rise to Record Levels, Most Latinos Oppose Obama’s Policy

President’s Approval Rating Drops, but He Leads 2012 Rivals

FOR MEDIA OR OTHER INQUIRIES:

Communications Department
202.419.4372
www.pewresearch.org

RECOMMENDED CITATION

Pew Research Center, December 2011, "As Deportations Rise to Record Levels, Most Latinos Oppose Obama’s Policy"

About Pew Research Center

Pew Research Center is a nonpartisan, nonadvocacy fact tank that informs the public about the issues, attitudes and trends shaping the world. It does not take policy positions. The Center conducts public opinion polling, demographic research, computational social science research and other data-driven research. It studies politics and policy; news habits and media; the internet and technology; religion; race and ethnicity; international affairs; social, demographic and economic trends; science; research methodology and data science; and immigration and migration. Pew Research Center is a subsidiary of The Pew Charitable Trusts, its primary funder.

© Pew Research Center 2026

Table of contents

  • About Pew Research Center
  • As Deportations Rise to Record Levels, Most Latinos Oppose Obama’s Policy
  • II. Recent Trends in U.S. Immigration Enforcement
  • III. Awareness and Views of Immigrant Deportations
  • IV. Views of Immigration Policy
  • V. Dissatisfaction with the Nation’s Direction
  • VI. Latinos and the 2012 Presidential Election
  • VII. Views of the Political Parties and Party Identification
  • Appendix A: Deportations Reported by ICE
  • Appendix B: 2011 National Survey of Latinos Survey Methodology

As Deportations Rise to Record Levels, Most Latinos Oppose Obama’s Policy

President’s Approval Rating Drops, but He Leads 2012 Rivals

I. Overview

By a ratio of more than two-to-one (59% versus 27%), Latinos disapprove of the way the Obama administration is handling deportations of unauthorized immigrants, according to a new national survey of Latino adults by the Pew Hispanic Center, a project of the Pew Research Center.

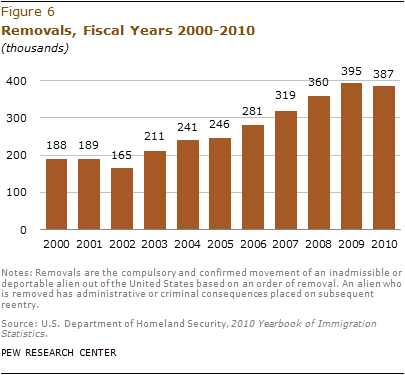
Deportations have reached record levels under President Obama, rising to an annual average of nearly 400,0001 since 2009, about 30% higher than the annual average during the second term of the Bush administration and about double the annual average during George W. Bush’s first term.

Even as deportations have been rising, apprehensions of border crossers by the U.S. Border Patrol have declined by more than 70%—from 1.2 million in 2005 to 340,000 in 2011. This mirrors a sharp drop in the number of unauthorized immigrants entering the U.S. since the middle of the last decade (Passel and Cohn, 2010).

More than eight-in-ten (81%) of the nation’s estimated 11.2 million unauthorized immigrants are of Hispanic origin, according to Pew Hispanic Center estimates (Passel and Cohn, 2011). Hispanics accounted for an even larger share of deportees in 2010—97%. (U.S. Department of Homeland Security, 2011a).

Not all Latinos are aware that the Obama administration has stepped up deportations of unauthorized immigrants. In response to a question on the Pew Hispanic survey, a plurality (41%) of Latinos say that the Obama administration is deporting more unauthorized immigrants than the Bush administration. Slightly more than a third (36%) say the two administrations have deported about the same number of immigrants. And one-in-ten (10%) Latinos say the Obama administration has deported fewer unauthorized immigrants than the Bush administration.

Disapproval of Obama’s policy is most widespread among those who are aware that deportations have risen during his tenure. Among this group, more than three-quarters (77%) disapprove of the way his administration is handling the issue of deportations. Among those who are not aware that an increase has occurred, slightly more than half disapprove.

Awareness of the level of deportations is higher among foreign-born Hispanics than among native-born Hispanics—55% versus 25%. It is even higher among those who are most at risk of deportation. Seven-in-ten (71%) Hispanic immigrants who are not U.S. citizens and do not have a green card—a group that closely aligns with the unauthorized immigrant population2—say the Obama administration has deported more unauthorized immigrants than the Bush administration.

These findings are from a new national survey of 1,220 Hispanic adults ages 18 and older conducted by landline and cellular telephone, in English and Spanish, from November 9 through December 7, 2011. The margin of error for the full sample is plus or minus 3.6 percentage points at the 95% confidence level. For a full description of the survey methodology, see Appendix B.

Immigration Policy Priorities

In recent years, the debate over illegal immigration has often been posed as a choice between two competing priorities—increasing border security and enforcement or providing a path to citizenship to immigrants who are in the country illegally.

Latinos are nearly twice as likely as the general public (42% versus 24%) to say the priority should be a path to citizenship for immigrants who are in the U.S. illegally.

About as many Latinos as the general public (46% versus 43%) say equal priority should be given to enforcement and legalization. Just 10% of Latinos say priority should be given to better border security and enforcement, compared with 29% of the general public.

The 2012 Presidential Election and Latinos

The Pew Hispanic survey also reveals that, heading into the 2012 presidential campaign, Obama and the Democratic Party continue to enjoy strong support from Latino registered voters.

In a hypothetical match-up against former Massachusetts Gov. Mitt Romney, Obama wins 68% to 23% among Latino registered voters. And in a match-up against Texas Gov. Rick Perry, Obama wins the Latino vote 69% to 23%.3 These results closely match the outcome of the 2008 presidential election, when Obama carried the Latino vote over Republican John McCain by 67% to 31% (Lopez, 2008).

Even among those who disapprove of the way Obama is handling the issue of deportations, a majority support his reelection over either of these two potential Republican challengers. Obama would carry this group by 57% to 34% against Romney and 61% to 31% against Perry.

The survey also shows that identification with the Democratic Party among Hispanic registered voters remains strong. Two-thirds (67%) of Hispanic registered voters say they identify with or lean toward the Democratic Party, while 20% say the same about the Republican Party.

And when asked which party has more concern for Hispanics, 45% say it’s the Democratic Party, while 12% say it’s the Republican Party. The share that identifies the Republican Party as the better party for Hispanics is up six percentage points since 2010.

Obama’s Job Rating among Hispanics

Despite Obama’s strong showing among Latinos when compared with potential 2012 Republican rivals, he has suffered a decline in his overall approval rating as president. Today 49% of Latinos approve of the job he is doing, down from 58% in 2010. Among the general public, Obama’s approval trend has been more stable during the past year (Pew Research Center for the People & the Press, 2011a). His current rating—46%—is still somewhat lower among the general public than among Latinos, but this gap has narrowed significantly in the past year.

Among Latinos who disapprove of the Obama administration’s deportation policy, just 36% approve of the president’s overall job performance while 54% disapprove.

Top Issues for Latinos

The survey finds that jobs, education and health care are the top issues for Hispanic registered voters as they think about the upcoming presidential election. Half identify jobs as extremely important to them personally, followed closely by education (49%) and health care (45%). These top three reflect the same three issues Hispanic registered voters identified as most important in 2010 (Lopez, 2010) and in 2008 (Lopez and Minushkin, 2008).

One-third (33%) of Latino registered voters say immigration is extremely important to them personally, statistically unchanged since 2010. About a third also describes taxes and the federal budget deficit as extremely important issues.

Among the report’s other findings:

  • More than half (56%) of all Latinos say they are dissatisfied with the direction of the country today, while 38% say they are satisfied. Among the general public, 78% are dissatisfied with the nation’s direction while 17% are satisfied (Pew Research Center, 2011).

Deportations

  • One-quarter (24%) of all Latinos say they know someone who has been deported or detained by the federal government in the past year.
  • The share of convicted criminal deportations among all deportations reached a high of 44% in 2010, up from 29% in 2008.

Immigration Policy

  • Nine-in-ten (91%) Latinos support the DREAM Act, legislation that would permit young adults who were brought to the U.S. illegally when they were children to become legal residents if they go to college or serve in the military for two years.
  • More than eight-in-ten (84%) Latinos say unauthorized immigrants should be eligible for in-state tuition at public colleges if they went to a high school in their state and were accepted at a public college.

The 2012 Election

  • More than half (56%) of Hispanic registered voters say they have given little or no thought to the candidates who may be running for president in 2012.
  • When asked about their opinion of Florida Sen. Marco Rubio, more than half (54%) of Latino registered voters say they have never heard of him, can’t rate him or responded “don’t know.” Rubio, who is of Cuban ancestry, has been mentioned as a possible Republican vice presidential running mate.
  • Among Latino registered voters, 35% describe their political views as conservative, 32% describe them as moderate and 28% describe their political views as liberal.

About this Report

The 2011 National Survey of Latinos (NSL) focuses on Latinos’ views on immigration policy and the upcoming presidential election. The survey was conducted from November 9 through December 7, 2011, in all 50 states and the District of Columbia among a randomly selected, nationally representative sample of 1,220 Latino adults, 557 of whom say they are registered to vote. The survey was conducted in both English and Spanish on cellular as well as landline telephones. The margin of error for the full sample is plus or minus 3.6 percentage points. The margin of error for the registered voter sample is plus or minus 5.2 percentage points.

Interviews were conducted for the Pew Hispanic Center by Social Science Research Solutions (SSRS).

This report was written by Associate Director Mark Hugo Lopez, Research Associate Ana Gonzalez-Barrera and Research Assistant Seth Motel. Paul Taylor and Rakesh Kochhar provided editorial guidance. The authors thank Paul Taylor, Cary Funk, Leah Christian, Richard Fry, Scott Keeter, Rakesh Kochhar, Rich Morin, Kim Parker, Eileen Patten and Gabriel Velasco for guidance on the development of the survey instrument. Rakesh Kochhar and Jeffrey Passel provided comments on earlier drafts of the report. Eileen Patten number checked the 2011 National Survey of Latinos topline. Gabriel Velasco number checked the report text. Marcia Kramer was the copy editor.

A Note on Terminology

The terms “Latino” and “Hispanic” are used interchangeably in this report.

The terms “unauthorized immigrants” and “illegal immigrants” are used interchangeably in this report, as are the terms “unauthorized immigration” and “illegal immigration.”

“Native born” refers to persons who are U.S. citizens at birth, including those born in the United States, Puerto Rico or other U.S. territories and those born abroad to parents at least one of whom was a U.S. citizen.

“Foreign born” refers to persons born outside of the United States, Puerto Rico or other U.S. territories to parents neither of whom was a U.S. citizen.

“Foreign-born U.S. citizens” refers to persons who indicate they are “foreign born” and who indicate they are U.S. citizens. The terms “foreign-born U.S. citizens” and “naturalized U.S. citizens” are used interchangeably in this report.

“Foreign-born legal residents” refers to persons who indicate they are foreign born and who say they have a green card or have been approved for one.

“Foreign born who are not legal residents and not U.S. citizens” refers to persons who indicate they are foreign born and who say they do not have a green card and have not been approved for one.

Language dominance is a composite measure based on self-described assessments of speaking and reading abilities. “Spanish-dominant” persons are more proficient in Spanish than in English, i.e., they speak and read Spanish “very well” or “pretty well” but rate their English-speaking and reading ability lower. “Bilingual” refers to persons who are proficient in both English and Spanish. “English-dominant” persons are more proficient in English than in Spanish.
II. Recent Trends in U.S. Immigration Enforcement

Deportations

In recent years, deportations of immigrants have reached record levels—nearly 400,000 a year during the Obama years, according to the Department of Homeland Security (2011a). This is 30% more than the 300,000 deported annually on average during the second term of the Bush administration. And it is nearly twice as many as the 200,000 deportations that occurred annually on average during Bush’s first term.

The U.S. Department of Homeland Security uses the term “removal” rather than “deportation”4 to describe the actions of its Immigration and Customs Enforcement (ICE) and Customs and Border Protection (CBP) divisions to expel a foreign national from the U.S. Each expulsion is based on an “order of removal” issued by an immigration court or by the Department of Homeland Security.5 Reasons for an order of removal are either inadmissibility or the deportability of a foreign immigrant.

Country of Origin of Deportees

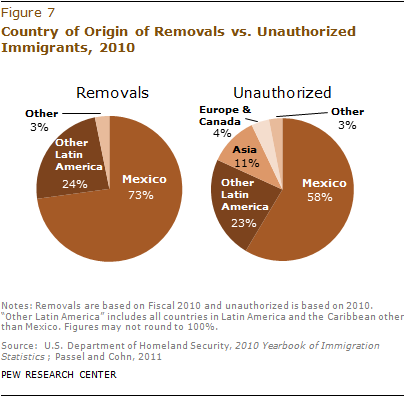
In 2010, deportees of Hispanic origin made up 97% of all deportees (U.S. Department of Homeland Security, 2011a). Mexican immigrants alone accounted for nearly three-fourths (73%) of deportees in fiscal 2010. An additional 24% were from countries in Latin America other than Mexico, including Guatemala (8%), Honduras (6%) and El Salvador (5%).

According to Pew Hispanic Center estimates, Hispanics make up 81% of the nation’s 11.2 million unauthorized immigrants (Passel and Cohn, 2011)—a share 16 percentage points lower than that among all deportees. Most of this differential arises from the disproportionate deportation of Mexican immigrants. Among the nation’s unauthorized immigrants, 58% are from Mexico, 15 percentage points lower than their share among all deportees.

Deportation of Convicted Criminals

The overall increase in deportations during the Obama administration has been fueled in part by an intensified focus on deporting immigrants convicted of a crime. The number of criminal deportees rose from 105,000 in 2008 to 169,000 in 2010—an increase of 61%. As a share of all deportees, convicted criminals comprised 44% in 2010, up from 29% in 2008 (U.S. Department of Homeland Security, 2011a).

The rising number of criminal deportees has been bolstered by programs administered by Immigration and Customs Enforcement to identify and apprehend deportable criminal convicts. These programs, such as the Criminal Alien Program (CAP), Secure Communities and 287(g), are administered in partnership with state and local law enforcement authorities.

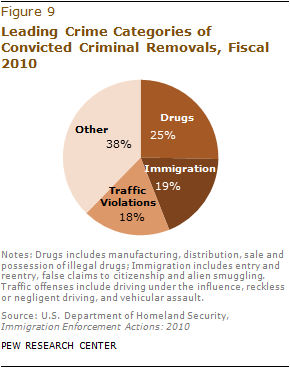
Criminal deportees have been found guilty of a wide range of offenses. In 2010, one-fourth (25%) of such deportees were convicted of drug-related offenses, 19% of immigration offenses and 18% of criminal traffic violations such as DUI, reckless driving or vehicular assault. Together, these three offense categories made up the majority of all criminal deportations (62%).

Other categories of crimes committed by deported immigrants include assault (7%), larceny (3%), burglary (2%), fraudulent activities (2%), robbery (2%), family offenses (2%), and sexual assault (2%).

Border Apprehensions

Border apprehensions have fallen significantly in recent years, according to the U.S. Border Patrol (2011). In 2005, the Border Patrol reported nearly 1.2 million apprehensions of unauthorized border crossers. In 2011, that had fallen to 340,000—a drop of more than 70%. This decrease appears to be the result of a sharp reduction in the inflows of unauthorized immigrants since the middle of the last decade (Passel and Cohn, 2010).

Besides greater enforcement by ICE, it is possible that some of the statistical increase in deportations in recent years is the result of administrative changes in the way that unauthorized immigrants apprehended at the border are processed. After being caught by the Border Patrol, an unauthorized immigrant can be processed either as a “voluntary return” or a “removal.” For many years, most illegal border crossers were quickly processed and returned to Mexico—and thus never counted as deportees. However, in recent years a growing share of persons apprehended at the border have been issued an official order of removal6 and thus been counted as deportees in official statistics.

III. Awareness and Views of Immigrant Deportations

Not all Latinos are aware that deportations have risen to record levels during the Obama administration.

When asked which administration has deported more unauthorized immigrants, a plurality (41%) of Latinos say they believe that the Obama administration is deporting more unauthorized immigrants than the Bush administration. Some 36% of Latinos say the two administrations have deported about the same number of immigrants. And 10% of Latinos say the Obama administration has deported fewer unauthorized immigrants than the Bush administration.

Awareness of the level of deportations is higher among foreign-born Hispanics than among native-born Hispanics—55% versus 25%. And among immigrant Hispanics who are not U.S. citizens and do not have a green card—the group most likely to be affected by increased deportations—71% say the Obama administration has deported more unauthorized immigrants than the Bush administration.

Views of Deportations

By a ratio of more than two-to-one (59% versus 27%), Latinos say they disapprove of the way the Obama administration is handling the deportation of unauthorized immigrants.

Disapproval is much higher among foreign-born Latinos (70%) than native-born Latinos (46%).

Among Hispanic registered voters, 52% say they disapprove of the Obama administration’s handling of deportations, while 31% say they approve.

Among those who are aware that deportations have reached record levels during Obama’s tenure, more than three-quarters (77%) disapprove of the administration’s deportation policy. Among those who are not aware that deportations have increased, slightly more than half disapprove.

Familiarity with Detainment and Deportation

One-in-four (24%) Hispanics say they personally know someone who has been detained or deported by the federal government in the past year.

Familiarity with detainment and deportation is highest among foreign-born Hispanics who are not U.S. citizens and not legal residents. Among this group, more than a third (36%) say they know someone who has been deported or detained in the past year.

However, familiarity with detainment and deportation is not limited to the foreign born. One-in-five (22%) native-born Hispanics say they personally know someone who has been detained or deported by the federal government in the past 12 months. And among Hispanic registered voters, one-in-five (20%) say they know someone who has been deported or detained.

IV. Views of Immigration Policy

Immigration Policy Priorities

In recent years, the debate over illegal immigration has often been posed as a choice between two competing priorities—increasing border security and stronger enforcement of the nation’s immigration laws versus providing a path to citizenship for immigrants who are in the U.S. illegally.

Latinos are nearly twice as likely as the general public (42% versus 24%) to say priority should be given to providing a path to citizenship for the nation’s unauthorized immigrants.

When it comes to better border security and stronger enforcement of immigration laws, the general public is nearly three times as likely as Hispanics (29% versus 10%) to say this should be the priority for dealing with illegal immigration.

Even so, there is some common ground between Hispanics and the general public. Some 46% of Latinos and 43% of the general public say both better border security and enforcement and a path to citizenship should be given equal priority when it comes to dealing with illegal immigration.

Overall, there are only minor differences between foreign-born and native-born Latinos in their views about the policy priorities for dealing with illegal immigration.

In-State Tuition for Unauthorized Immigrants

Fully 84% of Latinos favor granting in-state tuition to unauthorized immigrants who have attended high school in their states and have been accepted at a public college. By contrast, the general public is split—48% support in-state tuition for unauthorized immigrants, while 46% do not (Pew Research Center for the People & the Press, 2011b).

According to the National Conference of State Legislatures, 12 states currently offer in-state tuition to unauthorized immigrant students while six states have passed laws preventing unauthorized immigrants from receiving in-state tuition at public colleges and universities.7

Support for in-state tuition for unauthorized immigrants is greater among foreign-born Hispanics than native-born Hispanics—90% versus 77%. Nonetheless, large majorities of both groups support such laws .

Support for the DREAM Act

More than nine-in-ten (91%) Latinos support the Development, Relief and Education for Alien Minors (DREAM) Act, a proposal to grant legal status to unauthorized immigrant children if they attend college or serve in the U.S. military for two years.

Few differences by nativity are evident. Fully 87% of native-born Latinos and 94% of foreign-born Latinos support such a law. Latinos who are not U.S. citizens or legal residents show the most support for the law (96%).

V. Dissatisfaction with the Nation’s Direction

When it comes to the direction of the country today, more than half (56%) of Latinos say they are dissatisfied with the way things are going while 38% say they are satisfied, according to the new Pew Hispanic survey.

Even though a majority of Latinos are dissatisfied, they are notably less downbeat than the rest of the public. Among all American adults, more than three-in-four (78%) say they are dissatisfied with the nation’s direction (Pew Research Center, 2011).

The level of dissatisfaction among Latinos is unchanged from 2010. Then, a similar share 59% said they were dissatisfied with the nation’s direction (Lopez, 2010).

Among Hispanics, there are few differences by nativity. Six-in-ten (59%) native-born Hispanics say they are dissatisfied with the nation’s direction, as do 53% of the foreign born. Also, Hispanic registered voters (58%) are about as dissatisfied as are all Hispanics.

VI. Latinos and the 2012 Presidential Election

Latino participation in the nation’s elections has been rising. A record 9.7 million Latinos (50% of Latino eligible voters) cast a vote in the 2008 presidential election (Lopez and Taylor, 2009). In last year’s midterm election, a record 6.6 million Latinos voted—31% of Latino eligible voters (Lopez, 2011).

Rapid population growth has fueled rapid growth in the number of Latinos eligible to vote.8 According to Pew Hispanic Center estimates, more than 21.7 million Hispanics are eligible to participate in next year’s election—the most ever and up by more than 2 million since 2008, when 19.5 million Latinos were eligible to vote.

With the 2012 presidential election around the corner, the Pew Hispanic survey reveals that more than half (56%) of Latino registered voters say they have given not much or no thought to the candidates who might be running for president.

Even so, when asked about hypothetical presidential match-ups between President Obama and potential Republican challengers, support for Obama is strong and closely matches results from the 2008 presidential election, when Obama carried 67% of the Latino vote while Republican John McCain took 31% (Lopez, 2008).

Obama versus Mitt Romney

In a hypothetical race between Obama and former Massachusetts Gov. Mitt Romney, 68% of Latino registered voters say they support Obama and fewer than one-in-four (23%) say they support Romney. Among the general public, by contrast, about half (49%) of all registered voters say they support Obama while 47% say they support Romney, according to the most recent Pew Research Center for the People & the Press (2011c) survey.

Support for Obama or Romney falls along party lines. Among Hispanic registered voters who identify with or lean toward the Republican Party, Romney wins 62% to 29%. Among those who identify with or lean toward the Democratic Party, Obama wins 82% to 12%.

Even among those who disapprove of the way Obama is handling the issue of deportations, a majority support his reelection over Romney—57% to 34%.

Obama versus Rick Perry

In a hypothetical match-up between Obama and Texas Gov. Rick Perry, Obama carries the Hispanic vote 69% to 23%. Among all registered voters, Obama wins 53% to 42% (Pew Research Center for the People & the Press, 2011c).

Among Republican Latino registered voters, Perry wins 62% to Obama’s 31%. Among Democratic Latino registered voters, Obama wins 82% to 13%.

Among those who disapprove of the Obama administration’s handling of the issue of deportations, 61% support Obama, while 31% support Perry.

Florida Senator Marco Rubio

The Pew Hispanic survey asked Latinos about their opinion of Florida Republican Sen. Marco Rubio. Rubio, who is of Cuban ancestry, has been discussed as a potential vice presidential running mate to any possible Republican presidential nominee.

The survey reveals that Rubio is not well known among Latinos. When asked about their opinion of Rubio, more than half of Latinos say they have either never heard of him (39%), respond “don’t know” (11%) or can’t rate him (2%). Similarly, more than half (54%) of Latino registered voters say they either have never heard of him (40%), don’t know (10%) or can’t rate him (4%).

Among all Latinos, those who have heard of Rubio more have a favorable opinion (31%) than an unfavorable opinion (15%). Among Latino registered voters who have heard of Rubio, 27% say they have a favorable opinion of him while 18% say they have an unfavorable opinion.

Overall, among Hispanic registered voters, Rubio is viewed more favorably among Republicans (45%) than he is among Democrats (24%). Even so, a significant minority (40%) of Hispanic Republicans, and a majority of Hispanic Democrats (57%), either have never heard of him, don’t know or can’t rate him.

Obama’s Job Approval Rating among Latino Registered Voters

Just over half (54%) of Latino registered voters say they approve of the way in which Barack Obama is handling his job as president, a higher share than among all registered voters (46%) (Pew Research Center for the People & the Press, 2011c).

However, Obama’s job approval rating among Latino registered voters has declined 9 percentage points since 2010. Then, 63% of Latino registered voters said they approved of Obama’s job performance (Lopez, 2010).

The decline in Obama’s approval rating has occurred among nearly all major groups of Latino registered voters. Among Latino Democrats, Obama’s approval rating has declined 15 percentage points, falling from 78% in 2010 to 63% today. Among Latino Republicans, Obama’s approval rating also declined, though by less—from 34% in 2010 to 25% today.

Obama’s job approval rating among young Latinos is down 20 percentage points since 2010—falling from 73% then to 53% today among those ages 18 to 29. Smaller declines occurred among Latino registered voters ages 30 to 49 (down 7 percentage points) and ages 50 to 64 (down 11 percentage points). Only among Latino registered voters ages 65 and older is Obama’s approval rating higher—up 6 percentage points since 2010 to 58%.

Among Latino registered voters who disapprove of the administration’s handling of deportations, 49% disapprove of Obama’s job performance while 43% approve. Among all Latinos who disapprove of the way the Obama administration is handling the issue of deportations, more disapprove of the president’s job performance than approve—54% versus 36%.

Top Issues among Latinos

Latino registered voters rank pocketbook and family issues as their top concerns, according to the Pew Hispanic survey. Half say the issue of jobs is extremely important to them personally, followed by education (49%) and health care (45%).

One-third (33%) of Latino registered voters say immigration is extremely important to them personally, and just as many (34%) identify the issues of taxes or the federal budget deficit as extremely important.

Compared with 2010, the same three issues are rated as personally important to Hispanic registered voters in 2011, though relative positions have changed. In 2010, more Latino registered voters said that education (58%) was extremely important to them, followed by jobs (54%) and health care (51%) (Lopez, 2010). Even so, today’s top three issues reflect rankings observed previously in Pew Hispanic Center surveys (Lopez and Livingston, 2009).

When it comes to all Latino adults, a different ranking of issues emerges from the Pew Hispanic survey. Some 48% identify education as extremely important to them, while 47% say jobs and 40% say health care are extremely important. Among all Latino adults, immigration (34%) ranks as the fourth issue, followed by taxes (30%) and the federal budget deficit (29%).

VII. Views of the Political Parties and Party Identification

Identification with the Democratic Party among Latino registered voters remains high. However, since 2008 fewer Latino registered voters say the Democratic Party is the better party for Latinos, while a growing share see the Republican Party as the better party.

Which Party Has More Concern for Hispanics?

When asked which party has more concern for Hispanics, 45% of Latino registered voters identify the Democratic Party as the better party for Hispanics while 12% say the Republican Party is better for Hispanics.

Since 2008, the share of Latino registered voters who say the Democratic Party has more concern for Latinos has declined 10 percentage points—from 55% to 45%. Meanwhile, the share of Latino registered voters who say the Republican Party has more concern for Hispanics has increased, from 6% in 2008 and 2010 to 12% in 2011. Most of this change regarding views of the Republican Party comes from Hispanic Republicans. Today a greater share (28%) of them says the Republican Party is the better party for Hispanics than did so in 2010 (18%).

Nonetheless, in 2011 pluralities of just about all major groups of Latino registered voters say the Democratic Party has more concern for Hispanics. Even among Republican Hispanics, a significant share (20%) says the Democratic Party is the better party for Hispanics.

Despite an increase in the share of Hispanic registered voters who say the Republican Party is the better part for Hispanics, more say there is no difference between the two parties—33% versus 12%. Even among Hispanic Republicans, more (46%) say there is no difference between the two parties than say the Republican Party (28%) has more concern for Hispanics.

Party Affiliation among Latino Registered Voters

Hispanic registered voters continue to show a strong partisan allegiance to the Democratic Party. According to the Pew Hispanic survey, two-thirds (67%) of Hispanic registered voters say they identify with or lean toward the Democratic Party while just 20% say the same about the Republican Party.

The new survey also reveals that Democrats have extended their lead in party allegiance among Hispanic registered voters. Today the gap in party allegiance stands at 47 percentage points.

By contrast, among all registered voters, the Democratic lead is smaller—just 4 percentage points in 2011 (Pew Research Center for the People & the Press, 2011d). Some 47% identify with or lean toward the Democratic Party, while 43% identify with or lean toward the Republican Party.

Across all demographic groups of Latino registered voters, large majorities identify with or lean toward the Democratic Party.

Appendix A: Deportations Reported by ICE

Both the Department of Homeland Security (DHS) and its Immigration and Customs Enforcement (ICE) publicly announce the number of removals carried out in a fiscal year. Since 2008, the number of removals reported by ICE has exceeded those reported by its parent agency, DHS.

This discrepancy arises from what data are reported by ICE. Since 2007, the total number of removals reported by ICE has included not only deportations carried out by ICE, but also returns carried out by the agency. Returns differ from removals in that they are carried out without an “order of removal” and do not have administrative or criminal consequences on subsequent reentry. Generally, most returns are performed by U.S. Customs and Border Protection (CBP) shortly after apprehension of an immigrant by the Border Patrol. However, a few are reported by ICE. Removal totals reported by ICE include returns carried out by ICE.

By contrast, the Office of Immigration Statistics (OIS) of the DHS reports removal totals that include all removals performed by ICE in addition to those reported by the CBP. When compiling departmental statistics, OIS does not count returns reported by ICE as deportations.

Appendix B: 2011 National Survey of Latinos Survey Methodology

Results for this study are based on telephone interviews conducted by Social Science Research Solutions (SSRS), an independent research company, among a nationally representative sample of 1,220 Latino respondents ages 18 and older, from November 9 through December 7, 2011. Some 492 respondents were native born (including Puerto Rico), and 728 were foreign born (excluding Puerto Rico). Of the foreign born, 299 were U.S. citizens, 261 were legal residents and 140 were not citizens and not legal residents. For results based on the total sample, one can say with 95% confidence that the error attributable to sampling is plus or minus 3.6 percentage points.

For this survey, SSRS maintained a staff of bilingual interviewers who, when contacting a household, were able to offer respondents the option of completing the survey in Spanish or English. A total of 674 (55%) respondents were surveyed in Spanish, and 546 (45%) respondents were interviewed in English. Any person ages 18 or older of Latino origin or descent was eligible to complete the survey.

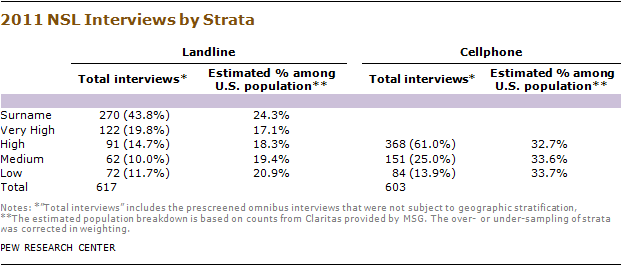
To address concerns about coverage, the study employed a dual-frame landline/cellphone telephone design. The sample consisted of a landline component (n = 617) and a cellphone component (n = 603)9. Both the landline and cellphone components consisted of a stratified sampling design, oversampling areas with higher densities of Latino residents.

For the landline sampling frame, the sample was run against InfoUSA and other listed databases, and phone numbers that matched to known Latino surnames were subdivided into a Surname stratum. The remaining, unmatched and unlisted landline sample was divided into the following mutually exclusive strata: Very High Latino, High Latino, and Medium Latino. MSG’s GENESYS sample generation system was used to generate cellphone sample, which was divided into High and Medium Latino strata. Overall, the study employed eight strata.

Samples for the low-incidence landline and cell strata were drawn based on responses to SSRS’s weekly dual-frame Excel omnibus survey. Respondents who indicated they were Latino on the omnibus survey were eligible to be recontacted for the present survey.

It is important to note that the existence of a surname stratum does not mean this was a surname sample design. The sample is RDD, with the randomly selected telephone numbers divided by whether they were found to be associated with or without a Spanish surname. This was done simply to increase the number of strata and thereby increase the ability to meet ethnic targets and ease administration by allowing for more effective assignment of interviewers and labor hours.

A five-stage weighting design was used to ensure an accurate representation of the national Hispanic population.

  • An adjustment was made for all persons found to possess both a landline and a cellphone, as they were twice as likely to be sampled as were respondents who possessed only one phone type.
  • The sample was corrected for a potential bias associated with recontacting respondents in the low-incidence landline and cell strata.
  • The sample was corrected for the likelihood of within-household selection, which depended upon the likelihood that the respondent’s age group would be selected, and that within that age group, the particular respondent would be selected.
  • The sample was corrected for the oversampling of telephone number exchanges known to have higher densities of Latinos and the corresponding undersampling of exchanges known to have lower densities of Latinos.

Finally, the data were put through a post-stratification sample balancing routine. The post-stratification weighting utilized national 2011 estimates from the Census Bureau’s Current Population Survey, March Supplement, on gender, age, education, Census region, heritage, years in the U.S., and phone status (i.e., cellphone only, cellphone mostly, mixed/landline only/landline mostly).10