
Pew Research Center

FOR RELEASE MAY 26, 2011

U.S. Hispanic Country of Origin Counts for Nation, Top 30 Metropolitan Areas

Browse detailed demographic and economic profiles of Hispanics in the United States by their countries of origin.

BY Mark Hugo Lopez and Daniel Dockterman

FOR MEDIA OR OTHER INQUIRIES:

Communications Department
202.419.4372
www.pewresearch.org

RECOMMENDED CITATION

Pew Research Center, May 2011, "U.S. Hispanic Country of Origin Counts for Nation, Top 30 Metropolitan Areas"

About Pew Research Center

Pew Research Center is a nonpartisan, nonadvocacy fact tank that informs the public about the issues, attitudes and trends shaping the world. It does not take policy positions. The Center conducts public opinion polling, demographic research, computational social science research and other data-driven research. It studies politics and policy; news habits and media; the internet and technology; religion; race and ethnicity; international affairs; social, demographic and economic trends; science; research methodology and data science; and immigration and migration. Pew Research Center is a subsidiary of The Pew Charitable Trusts, its primary funder.

© Pew Research Center 2026

Table of contents

  • About Pew Research Center
  • U.S. Hispanic Country of Origin Counts for Nation, Top 30 Metropolitan Areas
  • II. Metropolitan Area Diversity
  • Appendix

U.S. Hispanic Country of Origin Counts for Nation, Top 30 Metropolitan Areas

Browse detailed demographic and economic profiles of Hispanics in the United States by their countries of origin.

I. Overview
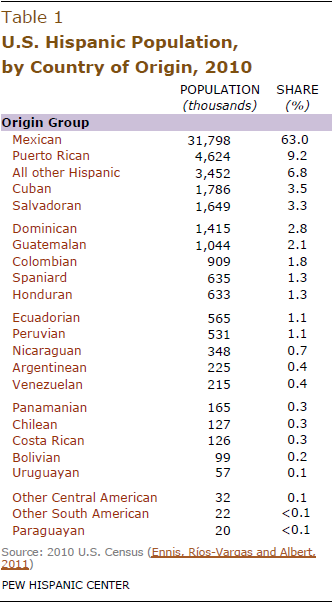
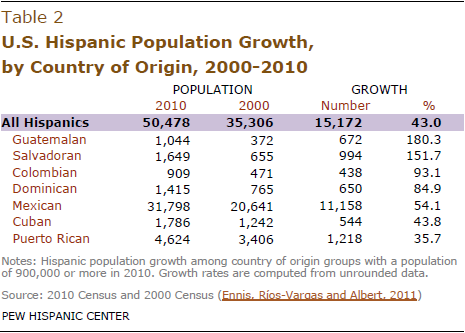
Hispanics of Mexican, Puerto Rican, and Cuban origin or descent remain the nation’s three largest Hispanic country-of-origin groups, according to the 2010 U.S. Census. However, while the relative position of these three groups has remained unchanged since 2000, the next four Hispanic sub-groups grew faster during the decade.

Hispanics of Salvadoran origin, the fourth largest Hispanic country-of-origin group grew by 152% since 2000. The Dominican population grew by 85%, the Guatemalan population by 180% and the Colombian population by 93%. Meanwhile, the Cuban and Puerto Rican populations grow more slowly—44% and 36% respectively (Ennis, Ríos-Vargas and Albert, 2011).1
Country of origin is based on self-described family ancestry or place of birth in response to questions in the Census Bureau’s American Community Survey and on the 2010 Census form. It is not necessarily the same as place of birth, nor is it indicative of immigrant or citizenship status. For example, a U.S. citizen born in Los Angeles of Mexican immigrant parents or grandparents may (or may not) identify his or her country of origin as Mexico. Likewise, some immigrants born in Mexico may identify another country as their origin depending on the place of birth of their ancestors.

The 2010 Decennial Census counted 50.5 million Hispanics. Among them, there were 31.8 million Mexican-origin Hispanics–the largest Hispanic country-of-origin group. They are followed by Puerto Rican origin Hispanics, who number 4.6 million in the U.S. and make up 9.2% of all Hispanics. Next are Cubans at 1.8 million or 3.5%, Salvadorans at 1.6 million or 3.3% and Dominicans at 1.4 million or 2.8%.

Census 2010 also revealed that there are now more than one million Guatemalan-origin Hispanics in the U.S. Together, Hispanic-origin populations with more than one million people comprise nine-in-ten (90.7%) of the nation’s Hispanics.

This report is accompanied by national level profiles containing geographic, demographic and economic details for the 10 largest Hispanic country-of-origin sub-groups. These profiles are based on the 2009 American Community Survey and include details such as the share foreign born, citizenship rates, household income and levels of educational attainment for each group. The report is also accompanied by two interactive graphics, one ranking the top 10 country-of-origin sub-groups on a number of characteristics, and another showing the country-of-origin sub-groups within the nation’s 30 metropolitan areas with the largest Hispanic populations.

About the Data

The data for this report come from the 2010 Census and the 2009 American Community Survey. The 2010 Census provides information on population counts, including those by country of origin. The 2009 American Community Survey was used to extract detailed demographic and economic information on each of the top 10 country-of-origin groups.

II. Metropolitan Area Diversity

Even though about two-thirds of all Hispanics nationwide are of Mexican origin, in many of the nation’s metropolitan areas Mexicans are not the largest Hispanic-origin group.

For example, Puerto Ricans are the largest Hispanic-origin group in the New York area and Cubans are the largest in the Miami area.

And in the Washington D.C. metropolitan area, Salvadorans are the single largest Hispanic group, comprising 33.7% of the area’s more than 700,000 Hispanics. There is no other major metropolitan area in the U.S. in which the Salvadoran population exceeds 11%.

And in the Washington D.C. metropolitan area, Salvadorans are the single largest Hispanic group, comprising 33.7% of the area’s more than 700,000 Hispanics. There is no other major metropolitan area in the U.S. in which the Salvadoran population exceeds 11%.

Mexicans are not the dominant Hispanic-origin group in all metropolitan areas, despite their No. 1 status in the nation. Among the Miami metropolitan area’s 1.5 million Hispanics, half (50.9%) are Cuban. In the New York-Northeastern New Jersey metropolitan area, 29.4% of Hispanics are of Puerto Rican origin and 19.7% are of Dominican origin.

However, in many metropolitan areas, Mexican-origin Hispanics are by far the dominant group. In Chicago, nearly eight-in-ten (79.2%) of the area’s Hispanics are of Mexican origin. In the San Antonio, TX metropolitan area, Mexicans make up 91.3% of all Hispanics. And in Atlanta, GA, nearly six-in-ten (58.1%) Hispanics are of Mexican origin.

The appendix to this report shows detailed country of origin information for each of the 30 metropolitan areas with the largest Hispanic populations. They range in size from 5.8 million Hispanics in the Los Angeles-Long Beach metropolitan area down to 343,000 in the Brownsville-Harlingen-San Benito metropolitan area in Texas.

Appendix