Pew Research Center

FOR RELEASE OCTOBER 5, 2010

Latinos and the 2010 Elections: Strong Support for Democrats; Weak Voter Motivation

In a year when support for Democratic candidates has eroded, the party’s standing among one key voting group—Latinos—appears as strong as ever.

FOR MEDIA OR OTHER INQUIRIES:

Communications Department
202.419.4372
www.pewresearch.org

RECOMMENDED CITATION

Pew Research Center, October 2010, "Latinos and the 2010 Elections: Strong Support for Democrats; Weak Voter Motivation"

About Pew Research Center

Pew Research Center is a nonpartisan, nonadvocacy fact tank that informs the public about the issues, attitudes and trends shaping the world. It does not take policy positions. The Center conducts public opinion polling, demographic research, computational social science research and other data-driven research. It studies politics and policy; news habits and media; the internet and technology; religion; race and ethnicity; international affairs; social, demographic and economic trends; science; research methodology and data science; and immigration and migration. Pew Research Center is a subsidiary of The Pew Charitable Trusts, its primary funder.

© Pew Research Center 2026

Table of contents

  • About Pew Research Center
  • Latinos and the 2010 Elections: Strong Support for Democrats; Weak Voter Motivation
  • II. The 2010 Congressional Elections
  • III. The Political Parties
  • IV. Views of the Obama Administration
  • Appendix A: The Demographics of Latino Registered Voters
  • Appendix B: 2010 National Survey of Latinos Survey Methodology

Latinos and the 2010 Elections: Strong Support for Democrats; Weak Voter Motivation

In a year when support for Democratic candidates has eroded, the party’s standing among one key voting group—Latinos—appears as strong as ever.

I. Overview

In a year when support for Democratic candidates has eroded, the party’s standing among one key voting group—Latinos—appears as strong as ever. Two-thirds (65%) of Latino registered voters say they plan to support the Democratic candidate in their local congressional district, while just 22% support the Republican candidate, according to a nationwide survey of Latinos. If this pro-Democratic margin holds up on Election Day next month, it would be about as wide as in 2008, when Latinos supported Barack Obama for president over John McCain by 67% to 31% (Lopez, 2008).

However, Hispanic registered voters appear to be less motivated than other voters to go to the polls. Just one-third (32%) of all Latino registered voters say they have given this year’s election “quite a lot” of thought. In contrast, half (50%) of all registered voters say the same (Pew Research Center for the People & the Press, 2010b). And when it comes to their intent to vote, half (51%) of Latino registered voters say they are absolutely certain they will vote in this year’s midterm election, while seven-in-ten (70%) of all registered voters say the same (Pew Research Center for the People & the Press, 2010a).1

The survey finds that among Latino registered voters, Republicans may be more likely to turn out and vote than Democrats. Some 44% of Latino Republicans say they have given the election quite a lot of thought compared with 28% of Latino Democrats. This partisan gap is consistent with survey findings of the full population of registered voters.

The findings for Latino registered voters emerge from a new national survey of 1,375 Latinos, including 618 registered voters, conducted from August 17 through September 19, 2010, by the Pew Hispanic Center, a project of the Pew Research Center.

Strong support for the Democrats among Latino registered voters continues a recent trend. In 2008, they supported Obama by 67% to 31% (Lopez 2008). In 2006, 69% of Latino voters supported Democratic candidates in congressional races, while 30% supported Republican candidates (Pew Hispanic Center, 2006). Even in 2004, a year when Republicans won a greater share of the Latino vote in the presidential election than at any time since the 1980s, nearly six-in-ten (58%) Latino voters supported Democrats John Kerry and John Edwards.2

In recent elections, Latinos have also represented a growing share of the electorate. According to a Pew Hispanic Center analysis of Census Bureau data, in 2008 Latino voters were 7.4% of all voters nationwide, up from 6% in 2004 (Lopez and Taylor, 2009).

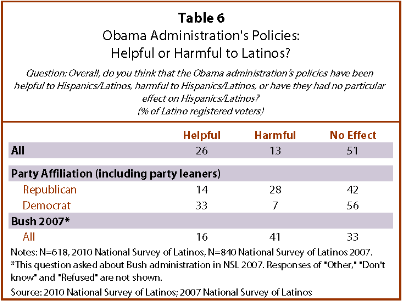
When it comes to opinions of President Barack Obama, a greater share of Latino registered voters approve of his job performance than do all U.S. registered voters—63% versus 47%. Yet when asked about the effect of his administration’s policies on Hispanics, Latino registered voters are divided. More than half (51%) say his policies have had no effect on Latinos, while one-in-four (26%) say they have been helpful to Latinos and 13% say they have been harmful.

The new survey also reveals that the Democratic Party continues to hold a large advantage in party identification among Latino registered voters. More than six-inten (62%) Latino registered voters say they identify with or lean toward the Democratic Party, while one-quarter (25%) say the same for the Republican Party—a Democratic advantage of 37 percentage points.

Democrats are seen as the party that has more concern for Hispanics. Nearly half (47%) of Latino registered voters say this about the Democratic Party—down from 55% in 2008, but similar to the share on this question expressed by Latinos for much of the past decade. In contrast, very few see the Republican Party as more concerned about Latinos than the Democratic Party—just 6% of all Latino registered voters and 18% of Republican Latino registered voters say this.

The survey also finds that Latinos are less negative than other voters about the direction of the country. Six-in-ten (59%) Latino registered voters say they are dissatisfied with the country’s direction, while 73% of all registered voters say the same (Pew Research Center for the People & the Press, 2010b).

The Immigration Issue

When Arizona enacted an unauthorized immigrant enforcement bill earlier this year, the immigration policy debate reignited across the country. Even so, the new survey shows that immigration does not rank as a top voting issue for Hispanics. Rather, they rank education, jobs and health care as their top three issues of concern for this year’s congressional campaign. Immigration ranks as the fifth most important issue for Latino registered voters and as the fourth most important issue for all Latinos.3

However, the survey finds that two-thirds (66%) of Latino registered voters say they talked about the immigration policy debate with someone they know in the past year. It also finds that those who have had these conversations are more motivated to vote in the upcoming election than are those who haven’t. Nearly six-in-ten (58%) Latino registered voters who have discussed the immigration debate say they are absolutely certain they will vote in November, compared with just four-in-ten (39%) of those who have not talked about the immigration debate.

Latinos are the nation’s largest minority group with an estimated population of 46.8 million in 2008, representing 15.4% of the nation’s population. Nationally 19.3 million Latinos are eligible to vote (18 years of age or older and a U.S. citizen) according to Pew Hispanic Center estimates, up from 18 million in 2006. Latinos make up 9.2% of the nation’s 211 million eligible voters. Two out of every three Latino eligible voters reside in one of four states: California, Texas, Florida and New York.

This report is based on a nationally representative bilingual telephone survey of 1,375 Latinos ages 18 and older, including 618 registered voters. Interviews were conducted from August 17 through September 19, 2010. The margin of error for the full sample is plus or minus 3.3 percentage points at the 95% confidence level; for registered voters, the margin of error is plus or minus 4.9 percentage points. For a full description of the survey methodology, see Appendix B.

Among the report’s other findings:

  • Majorities of almost all demographic groups of Latino registered voters say they will vote for the Democratic Party candidate in their local congressional election Nov. 2. Only among Republican Latino registered voters does a majority (74%) say they will support the Republican congressional candidate.
  • Some groups of Latino registered voters are more motivated than others to vote this year. More than six-in-ten (62%) of those who are ages 50 to 64 are absolutely certain they will vote, as are 61% of those who have at least some college education, 58% of those who are English dominant and 58% of Latino registered voters ages 65 or older.
  • Fewer than four-in-ten (38%) of Latino registered voters who are Spanish dominant say they are absolutely certain to vote this year. This is lower than any other demographic group of Latino registered voters.
  • Some six-in-ten (59%) Latino registered voters are dissatisfied with the direction the country is headed, down from 70% in July 2008 (Lopez and Minushkin, 2008a).
  • Two-thirds (66%) of Latino registered voters say they talked about the immigration policy debate in the past year with someone they know.

About this Report

The 2010 National Survey of Latinos (NSL) focuses on Latino political participation and Latinos’ views of the upcoming congressional elections. The survey was conducted from August 17 through September 19, 2010, among a randomly selected, nationally representative sample of 1,375 Latino adults, 618 of whom report that they are registered to vote. The survey was conducted in both English and Spanish on cellular as well as landline telephones.

Interviews were conducted for the Pew Hispanic Center by Social Science Research Solutions (SSRS).

A Note on Terminology

The terms “Latino” and “Hispanic” are used interchangeably in this report.

“Foreign born” refers to persons born outside of the United States, Puerto Rico or other U.S. territories to parents neither of whom was a U.S. citizen.

“Native born” refers to persons who are U.S. citizens at birth, including those born in the United States, Puerto Rico or other U.S. territories and those born abroad to parents at least one of whom was a U.S. citizen.

Language dominance is a composite measure based on self-described assessments of speaking and reading abilities. Spanish-dominant persons are more proficient in Spanish than in English, i.e., they speak and read Spanish “very well” or “pretty well” but rate their English speaking and reading ability lower. Bilingual refers to persons who are proficient in both English and Spanish. Englishdominant persons are more proficient in English than in Spanish.

II. The 2010 Congressional Elections

In a year when support for the Democrats has eroded among all registered voters, Latino registered voters continue to strongly support Democratic candidates. However, while Democrats have an advantage among Latino registered voters, overall Latinos voters are less motivated about this year’s elections than are all registered voters.

Congressional Election Preference

Two-thirds (65%) of Latino registered voters say they support the Democratic congressional candidate in their district, while just 22% say they would vote for the Republican candidate. This is in marked contrast to what all registered voters say: 47% support the Democrat, and 44% support the Republican (Pew Research Center for the People & the Press, 2010b).4

Among all demographic groups of Latino registered voters, majorities say they will vote for the Democratic candidate in their local congressional election. Only among Latino registered voters who identify with or lean toward the Republican Party does a majority say they will vote for the Republican candidate in their local congressional race.

Even so, in some demographic groups of Latinos, support for Republican candidates is higher than among all Latino registered voters. Three-in-ten (31%) Latino registered voters who say they have given the election quite a lot of thought say they will vote for the Republican candidate in their congressional district. Among those who are English dominant, three-in-ten (30%) say the same. And among those who are dissatisfied with the direction of the country, nearly three-in-ten say they will vote for the Republican candidate in their local congressional election (28%).

Top Issues in this Year’s Congressional Campaign

Latino registered voters rank education, jobs and health care as their three top issues in this year’s congressional campaign. Nearly six-in-ten (58%) say education is extremely important to them personally, and more than half say jobs (54%) and health care (51%) are extremely important.

Among the issues asked about in the survey, immigration ranks as the fifth most important for Latino registered voters. Some 31% say it is an extremely important to them personally.

The pattern is similar among all Latinos surveyed. Just as with Latino registered voters, education, jobs and health care rank as the top three issues for all Latinos. Overall, immigration ranks fourth for all Latinos.

These results are in line with findings from other Pew Hispanic Center surveys in recent years. Consistently, Latinos say that pocketbook and family issues are the most important to them—and that immigration, while an important issue for many Latinos, is not at the very top of their list (Lopez and Livingston, 2009).5 Among all registered voters, immigration ranks even lower— 10th on a list of 13 issues (Pew Research Center for the People & the Press, 2010a).

Dissatisfaction with the Nation’s Direction

A majority of Latino registered voters (59%) are dissatisfied with the country’s direction. An even larger share (73%) of all registered voters say the same this year. (Pew Research Center for the People & the Press, 2010b). Also, the level of dissatisfaction among Latino registered voters now is down from a high of 70% in mid-2008 (Lopez and Minushkin, 2008a).

Latino Voter Motivation

In this year’s election cycle, Latino registered voters are less likely than all registered voters to say they are absolutely certain they will vote. Half (51%) of all Latino registered voters say this, while seven-in-ten (70%) of all registered voters say the same (Pew Research Center for the People & the Press, 2010a).

Among Latino registered voters, those who are ages 50 to 64 (62%), have some college education (61%), are English dominant (58%) or are ages 65 or older (58%) are most likely to say they are absolutely certain they will vote in this year’s congressional elections. Meanwhile, those who are Spanish dominant (38%), have a high school education (42%) or less (43%), or are ages 18 to 29 (45%) are the least likely to say they are absolutely certain they will vote this year.

When it comes to thinking about this year’s election, just as with voting, Latino registered voters are less engaged than are all U.S. registered voters. Just one-third (32%) of all Latino registered voters say they have given this year’s election quite a lot of thought. In contrast, half (50%) of all registered voters say the same (Pew Research Center for the People & the Press, 2010).

Among Latino registered voters, however, some groups have given the election more thought than others. Those who identify with or lean toward the Republican Party are more likely than those who identify with or lean toward the Democratic Party to say they have given the election quite a lot of thought—44% versus 28%. Among English-dominant Latino registered voters, some 40% say they have given the election quite a lot of thought, while three-in-ten (28%) of bilingual Latino registered voters and 24% of Spanish-dominant Latino registered voters say the same.

The Immigration Policy Debate and Latino Voters

Since the passage of Arizona’s SB 1070 in April of this year, the immigration policy debate has been reignited nationwide. The new survey shows that Latino registered voters who say they have talked about the immigration policy debate with family, friends or co-workers this past year are more motivated this election cycle than those who have not talked about the debate. Two-thirds (66%) of Latino registered voters say they talked about the immigration policy debate in the past year with someone they know.

Nearly 6-in-10 (58%) of those who have discussed the immigration debate say they are absolutely certain they will vote in November, while four-in-ten (39%) of those who have not talked about the immigration debate say the same.

III. The Political Parties

Despite losing ground among all registered voters, the Democratic Party continues to hold a wide lead over the Republican Party among Latino registered voters. In political party identification, the Democrats hold a 37 percentage point advantage. And when asked which party has more concern for Latinos, Democrats continue to be seen as the better party, though the Democratic lead is slightly diminished since 2008.

Political Party Affiliation

According to the new survey, more than six-in-ten (62%) of Latino registered voters say they identify with or lean toward the Democratic Party while just 25% say they identify with or lean toward the Republican Party. This is in contrast to the partisan identification profile of the nation as a whole. According to the Pew Research Center for the People & the Press (2010b), among all registered voters, 49% identify with or lean toward the Democrats, and 44% identify with or lean toward the Republicans.

Majorities of all demographic groups of Latino registered voters self-identify as Democrats. However, significant shares of some are aligned with the Republican Party. More than three-inten Latino registered voters who have given the election quite a lot of thought (35%), are English dominant (33%), or have a high school diploma (31%) identify with or lean toward the Republican Party.

Which Party Has More Concern for Latinos?

When asked which party has more concern for Hispanics, Latino registered voters identify the Democratic Party as the better party—nearly half (47%) say so. In contrast, just 6% see the Republican Party as more concerned about Latinos.

Views about the parties and their concern for Latinos have remained relatively stable throughout the past decade. From 2002 to 2007, pluralities of Latino registered voters said the Democrats were better for Hispanics, and in 2008, a majority (55%) said so. And since 2004, the share of Latino registered voters who said the Republicans are more concerned for Hispanics than Democrats has fallen from 11% then to 6% today.

Pluralities of just about all demographic groups among Latino registered voters see the Democrats as better for Hispanics. Even among Latino registered voters who identify with or lean toward the Republican Party, just 18% say the Republican Party is better for Latinos than the Democratic Party, while 62% say they see no difference between the two parties.

IV. Views of the Obama Administration

More than six-in-ten (63%) Latino registered voters approve of President Barack Obama’s job performance. This share is higher than Obama’s job approval rating among all registered voters—46%. (Pew Research Center for the People & the Press, 2010b).

With the exception of Latino registered voters who identify with or lean toward the Republican Party, majorities of all groups of Latino registered voters say they approve of Obama’s job performance. Among Latino Republicans, fewer than four-in-ten (34%) say the same.

Despite their strong support for the president, Latinos are divided about the impact of his administration’s policies on Latinos. More than half (51%) say the administration’s policies have had no effect on Latinos, while one-infour (26%) say they have been helpful to Latinos and 13% say they have been harmful. This is in contrast to the views Latinos expressed about the Bush administration in 2007. Then, more than four-in-ten (41%) Latinos said President George W. Bush’s policies were harmful to Hispanics, while just 16% said they were helpful to Latinos and 33% said they had no effect (Taylor and Fry, 2007).

Appendix A: The Demographics of Latino Registered Voters

Appendix B: 2010 National Survey of Latinos Survey Methodology

Results for this study are based on telephone interviews conducted by Social Science Research Solutions (SSRS), an independent research company, among a nationally representative sample of 1,375 Latino respondents ages 18 and older, from August 17 through September 19, 2010. Of those respondents, 618 were registered voters. Some 542 respondents were native born (including Puerto Rico), and 833 were foreign born (excluding Puerto Rico). For results based on the total sample, one can say with 95% confidence that the error attributable to sampling is plus or minus 3.3 percentage points.

For this survey, SSRS maintained a staff of Spanish-speaking interviewers who, when contacting a household, were able to offer respondents the option of completing the survey in Spanish or English. A total of 548 respondents were surveyed in English, and 827 respondents were interviewed in Spanish. Any male or female age 18 or older of Latino origin or descent was eligible to complete the survey.

According to government statistics from the National Health Interview Survey (NHIS) during the first six months of 2009, 28% of Hispanic adults lived in households reachable only by cell phone. Adults who are cell-only are very different demographically from those reachable on a landline. In particular, they tend to be younger, less likely to be married or have children, or to own a home. To address the growing number of Hispanic households in the U.S. that are reachable only by cell phone, the study included interviews from both landline (n=710) and cell phone (n=665) sample frames.

Both sample frames were stratified via a disproportionate stratified design. All telephone exchanges in the contiguous 48 states were divided into groups, or strata, based on their concentration of Latino households. For the landline frame, the sample was also run against InfoUSA and other listed databases, and then scrubbed against known Latino surnames. Any “hits” were subdivided into a surname stratum, with all other samples being put into four other RDD strata. The cell phone sample was divided into three strata. Overall, then the study employed eight strata:

It is important to note that the existence of a surname stratum does not mean this was a surname sample design. The sample is RDD, with the randomly selected telephone numbers divided by whether they were found to be associated with or without a Latino surname. This was done simply to increase the number of strata and thereby increase the ability to meet ethnic targets and ease administration by allowing for more effective assignment of interviewers and labor hours.

A five-stage weighting design was used to ensure an accurate representation of the national Hispanic population.

  • An adjustment was made for all persons found to possess both a landline and a cell phone, as they were twice as likely to be sampled as were respondents who possessed only one phone type.
  • The sample was corrected for the disproportionality of the stratification scheme described earlier.
  • The sample was corrected for the likelihood of within-household selection, which depended upon the likelihood that the respondent’s age group would be selected, and that within that age group, the particular respondent would be selected.
  • The sample was corrected to reflect the percentage that is cell-only, landline-only, or reachable by either a landline or a cell phone, based upon estimates for Hispanics from the 2009 National Health Interview Survey estimates projected to 2010.
  • Finally, the data were put through a post-stratification sample balancing routine. The post-stratification weighting utilized national 2009 estimates from the Census Bureau’s Current Population Survey, March Supplement, on gender, education, age, region, foreign/native born status, year of entry into the U.S., and Hispanic heritage.