Pew Research Center

FOR RELEASE APRIL 7, 2009

Hispanics and the Criminal Justice System

Low Confidence, High Exposure

BY Mark Hugo Lopez and Gretchen Livingston

FOR MEDIA OR OTHER INQUIRIES:

Communications Department
202.419.4372
www.pewresearch.org

RECOMMENDED CITATION

Pew Research Center, April 2009, "Hispanics and the Criminal Justice System"

About Pew Research Center

Pew Research Center is a nonpartisan, nonadvocacy fact tank that informs the public about the issues, attitudes and trends shaping the world. It does not take policy positions. The Center conducts public opinion polling, demographic research, computational social science research and other data-driven research. It studies politics and policy; news habits and media; the internet and technology; religion; race and ethnicity; international affairs; social, demographic and economic trends; science; research methodology and data science; and immigration and migration. Pew Research Center is a subsidiary of The Pew Charitable Trusts, its primary funder.

© Pew Research Center 2026

Table of contents

  • About Pew Research Center
  • Hispanics and the Criminal Justice System
  • II. Confidence in the Criminal Justice System
  • III. Reporting Crimes to the Police
  • IV. Contact with the Criminal Justice System
  • Appendix A: Survey Methodology

Hispanics and the Criminal Justice System

Low Confidence, High Exposure

I. Overview

At a time when Latinos are interacting more than ever with police, courts and prisons, their confidence in the U.S. criminal justice system is closer to the low levels expressed by blacks than to the high levels expressed by whites, according to a pair of nationwide surveys by the Pew Research Center.1

Six-in-ten (61%) Hispanics say they have a great deal or a fair amount of confidence that the police in their local communities will do a good job enforcing the law, compared with 78% of whites and 55% of blacks. Just under half (46%) of Hispanics say they have confidence that police officers will not use excessive force on suspects, compared with 73% of whites and 38% of blacks. Similarly, just under half of Hispanics say they are confident that police officers will treat Hispanics fairly (45%) and that courts will treat Hispanics fairly (49%). In comparison, 74% of whites and 37% of blacks say they have confidence that the police will treat blacks and whites equally (Pew Social & Demographic Trends, 2007).

In recent decades, Hispanics’ exposure to all parts of the criminal justice system has risen even faster than their rising share of the U.S. adult population. In state, federal and local prisons and jails, the share of inmates who were Hispanic increased from 16% in 2000 to 20% in 2008 (West and Sabol, 2009). During this period, the share of Hispanics in the adult U.S. population rose from 11% to 13%.

Overall, according to the Pew Center on the States, some 4% of adult Hispanics in 2007 were either in prison or jail or on probation or parole. This is larger than the share of whites (2%) who were under some form of corrections control in 2007 and smaller than the share of blacks (9%).

As for rates of violent crime victimization, Hispanic levels (28.4 per 1,000 individuals) were higher than those of whites (23.9 per 1,000) and lower than those of blacks (32.9 per 1,000) in 2006 (Bureau of Justice Statistics, 2008).2 In the past 15 years, rates of victimization for all three groups have fallen by more than half (Catalano, 2006).

This report is based on a bilingual telephone survey of a nationally representative sample of 2,015 Hispanics ages 18 and older. Interviews were conducted from June 9 through July 13, 2008, by the Pew Hispanic Center, a project of the Pew Research Center. The margin of error for the sample is plus or minus 2.8 percentage points at the 95% confidence level. For a description of the survey methodology, see Appendix 1.

Other key findings of the report:

  • More than one-third (35%) of Latinos report that there are areas within a mile of their home where they are afraid to walk alone at night, similar to the share of the general population that feels the same way (37%).
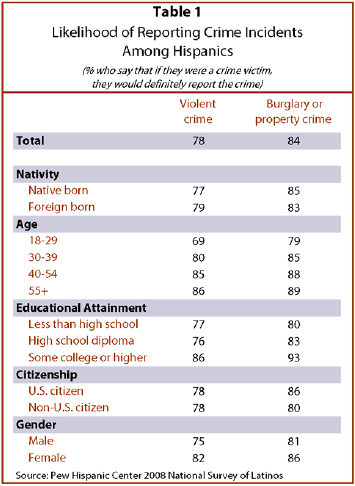
  • More than three-quarters (78%) of Hispanics say that if they were a victim of a violent crime, they would definitely report that crime to the police.
  • Overall, more than half (56%) of Latinos say they or an immediate family member had contact with the criminal justice system in the previous five years. Contact includes reporting a crime to the police, serving on a jury, being arrested, being on probation or parole, or serving time in jail or prison.
  • Among all Hispanics, 27% say they or an immediate family member had reported a crime in the previous five years.
  • Nearly one-quarter (23%) of Hispanics say they or an immediate family member had been questioned by the police (for any reason) in the previous five years.
  • Among all Hispanics, 15% say they or someone in their immediate family had been arrested in the previous five years.
  • Some 17% of Latinos say they or an immediate family member had been under some kind of criminal corrections control in the previous five years.

About this Report

The 2008 National Survey of Latinos asked Hispanic adults about their views of the police and courts in their communities, their perceptions of crime and any interaction they or their immediate family members have had with the criminal justice system. The survey was conducted from June 9 through July 13, 2008, among a randomly selected, nationally representative sample of 2,015 Hispanic adults. The survey was conducted in both English and Spanish. The margin of error for the full sample is plus or minus 2.8 percentage points at the 95% confidence level.

A Note on Terminology

The terms “Latino” and “Hispanic” are used interchangeably in this report, as are the terms “foreign born” and “immigrant.”

The terms “whites” and “blacks” are used to refer to the non-Hispanic components of their population unless otherwise noted.

II. Confidence in the Criminal Justice System

Six-in-10 (61%) Hispanics report a great deal or a fair amount of confidence that police officers in their community will do a good job of enforcing the law, and 57% are confident that police will do a good job of dealing with gangs. However, this still leaves a notable minority who hold a negative opinion about police behavior. A plurality (47%) express just some or very little confidence that police will avoid using excessive force on suspects, while 46% have a great deal or a fair amount of confidence. Half (50%) of Hispanics have just some or very little confidence that police will treat Hispanics fairly, while 45% feel a great deal or a fair amount of confidence that the treatment will be fair. In regard to the courts, 44% of Hispanics have just some or very little confidence that they will treat Hispanics fairly, and 49% have a great deal or a fair amount of confidence that courts will treat Hispanics fairly.

Two of the five questions about confidence in the legal system asked of Latinos in 2008 were also asked of blacks and whites in 2007 (Pew Social & Demographic Trends, 2007). On those questions, levels of confidence among Latinos fall between the levels reported by whites and blacks. Nearly eight-in-ten (78%) whites have a great deal or a fair amount of confidence in their local police to do a good job enforcing laws, while 61% of Latinos and 55% of blacks share that sentiment. Nearly three-quarters (73%) of whites report a great deal or a fair amount of confidence that police will not use excessive force on suspects, while 46% of Latinos and 38% of blacks express the same opinion.

A similar pattern emerges on the issue of police treatment of minorities. While Latinos were asked about their confidence that police would treat Latinos fairly, in 2007 blacks and whites were asked an analogous question about their confidence that police officers treat blacks and whites equally. Nearly three-quarters (74%) of whites had a great deal or a fair amount of confidence that police treat blacks and whites equally. Half as many (37%) blacks reported thesame. In comparison, 45% of Latinos statthey feel a great deal or a fair amount of confidence that police will treat Hispanics fairly.

Young Latinos generally are less confident in the justice system than are older Latinos. While 54% of Latinos ages 18 to 29 have a great deal or a fair amount of confidence that the police will do a good job of enforcing the law, this share is lower than the share of Latinos ages 30 to 39 (62%), ages 40 to 54 (66%) and ages 55 or older (67%) who say the same.

On three out of five confidence measures, immigrant Latinos report less confidence in thelegal system than do native-born Latinos. Half (50%) of native-born Latinos report a great deaor a fair amount of confidence that police will avoid using excessive force on suspects, while 42% of immigrant Latinos express the same level of confidence. Fifty-one percent of native-born Latinos are confident that police will treat Hispanics fairly, compared with 40% of the foreign born. Six-in-ten (60%) native-born Latinos feel a great deal or a fair amount of confidence that the courts will treat Hispanics fairly. In contrast, 42% of immigrant Latinos say the same.

III. Reporting Crimes to the Police

Reporting Violent Crime3

Nearly eight-in-ten (78%) Hispanics state that if they were a victim of a violent crime, they would definitely report the incident to the police. The likelihood of reporting a violent crime incident differs by age, education and gender. Latinos ages 30 or older are more likely than Latinos ages 18 to 29 to say they would definitely report a violent crime incident to the police—84% versus 69%. Latinos with at least some college education (86%) are more likely to say they would definitely report a violent crime than are Latinos with a high school diploma (76%) or those with less than a high school diploma (77%). Women are more likely than men to say they definitely would report being a victim of a violent crime—82% versus 75%.

While most Latinos say that if they were a victim of a violent crime, they would report that incident to the police, a small share (5%) say they probably or definitely would not report the crime. Among those who say they would not report being a victim of a violent crime, nearly three-in-ten (29%) cite a fear of repercussions, such as immigration enforcement or discrimination, as a reason to not contact the police. Among immigrant Latinos who say they would not report a violent crime, 42% say they would fear repercussions if they reported the incident, compared with 18% of the native born. The second most common reason respondents cite for not reporting a violent crime incident is that they don’t expect the police to respond. More than one-quarter (26%) of Latinos who say they would not report being the victim of a violent crime identify this reason. Among immigrants who say they would not report a violent crime, 30% cite a perceived lack of response from the police as the reason versus 22% among the native born.

Criminal Victimization

Personal crime victimization rates among Hispanics in 2006 (28.4 per 1,000 individuals) were higher than the rates for whites (23.9 per 1,000) and lower than the rates for blacks (32.9 per 1,000 individuals), according to the Bureau of Justice Statistics’ National Crime Victimization Survey (NCVS). While Hispanics were more likely than whites to state on the NCVS that they were a victim of a personal crime in 2006, they were less likely (41.6%) to say they reported the incident to the police than white (48.3%) or black (55.0%) victims. Victimization and police reporting rates for whites and blacks include the Hispanic portions of those populations.

Property crime victimization rates among Hispanic households were 211.7 incidents per 1,000 households in 2006, compared with 156.7 per 1,000 white households and 185.6 per 1,000 black households. As was the case with personal crime, the share of Hispanic (33.5%) property crime victims who say they reported incidents to the police was lower than that of white (37.7%) or black (38.8%) victims.

Personal crime victimizations include such crimes as rape, sexual assault, robbery, aggravated assault and simple assault. Property crime victimizations include household burglary, motor vehicle theft and property theft.

In 2006 there were 6.3 million personal crimes and 19 million property crimes in the United States, according to the NCVS. Overall, the national personal crime rate per 1,000 individuals ages 12 or older was 25.4, and the national property crime rate per 1,000 households was 160.5.The NCVS, an annual survey of more than 70,000 U.S. households, is the most comprehensive survey of criminal victimization available. Respondents are asked about all criminal incidents in that calendar year, including those not reported to the police, in which they were a victim.

Reporting Property Crime

When asked if they would report a burglary or property crime to the police if they were a victim of that crime, more than eight-in-ten (84%) Hispanics say they definitely would. A greater share of Latinos ages 30 and older, compared with Latinos ages 18 to 29, say they would definitely report a burglary or property crime—87% versus 79%. Latinos with at least some college education are more likely than those with less than a high school diploma to say they would report such a crime—93% versus 80%.

Among the small share (4%) of Latinos who say they would not report a burglary or property crime, more than half (52%) cite a perceived lack of response from the police as the reason for not reporting the incident. The second most common reason for not reporting a burglary or property crime incident to the police is a fear of repercussions for reporting such a crime. More than two-in-ten (21%) Latinos who would not report being a victim of a burglary or property crime that reason.

Hate Crimes

According to the FBI, 7,624 bias-motivated crimes were reported in 2007 (FBI, 2007). Among these, 595 were directed against Hispanics, representing 8% of all bias-motivated crimes. In comparison, 2,658 bias-motivated crimes were reported against blacks and 749 against whites. Since 1990, the FBI, through its Uniform Crime Reports data collection, has compiled data on all reported crime incidents that had a bias motivation against a victim’s perceived race, religion, disability, sexual orientation or ethnic/national origin group.

IV. Contact with the Criminal Justice System

Individuals can interact with the criminal justice system in many ways, and that interaction affects not only them personally but their families as well.4 Overall, 56% of Latinos say they or someone in their immediate family had interacted with the criminal justice system in at least one of the following ways in the five years preceding the survey:

  • Reporting a crime to police (27%)
  • Being questioned by the police for any reason (23%)
  • Serving on a jury (21%)
  • Attending court on a criminal matter, excluding minor traffic violations and/or jury duty (19%)
  • Being arrested (15%)
  • Being on probation or parole (13%)
  • Serving time in jail and/or prison (12%)
  • Being a sworn witness in court (11%)

Reporting Crime to the Police

More than one-quarter (27%) of Hispanics say they or a family member reported a crime in the previous five years. Native-born Hispanics are twice as likely as foreign-born Hispanics to say this—38% versus 19%. Hispanics ages 54 and younger are more likely to say they reported a crime than those ages 55 and older—29% versus 19%. Hispanics with at least some college education (40%) are also more likely to say they reported a crime than Hispanics with a high school diploma (30%) or those with less education (17%).

Being Questioned by the Police

Nearly one-quarter (23%) of Latinos say they or an immediate family member were questioned by the police in the previous five years. Native-born Latinos are more likely than immigrant Latinos to say this—32% versus 17%. And Latinos under the age of 30 are more likely than older Hispanics to say this—32% versus 19%. Among Latinos with at least some college education, 30% say they or a family member had been questioned by the police in the previous five years, a greater share than those who are only high school graduates (23%) or have less than a high school education (19%). U.S. citizen Hispanics are more likely than non-U.S. citizen Hispanics to say they were questioned by the police—28% versus 15%.

Serving on a Jury

More than two-in-ten (21%) Hispanics say they or an immediate family member served on a jury in the previous five years. Hispanics over age 55 (30%) are more likely to say they or an immediate family member had served on a jury than are those ages 40 to 54 (22%), ages 30 to 39 (14%) or ages 18 to 29 (19%). And Hispanics with some college education (33%) are more likely to say they or an immediate family member served on a jury than are Hispanics with a high school diploma (18%) or those with less than a high school diploma (14%).

Attending Court on a Criminal Matter

Nearly two-in-ten (19%) Latinos say they or an immediate family member had attended court on a criminal matter other than a minor traffic violation or jury duty in the previous five years. Latinos between ages 18 and 30 are more likely to say this than Latinos ages 55 and older—23% versus 13%.

Being Arrested

Among Latinos, 15% say they or someone in their immediate family was arrested in the previous five years. Nearly one-quarter (23%) of Latinos ages 18 to 29 say they or a family member were arrested, compared with 8% of adults ages 55 and older. And native-born Latinos are more likely than immigrant Latinos to say they or a family member was arrested—18% versus 13%.

Interacting with the Corrections System

According to a recent report from the Pew Center on the States, 1-in-27 (4%) Hispanics in 2007 was under some form of corrections control, such as probation, parole, prison or jail. While 4% of Hispanics are under some kind of corrections control, more than four times (17%) as many say they or someone in their immediate family had been under corrections control in the previous five years. Native-born Latinos are more likely to report this than are immigrant Latinos—23% versus 13%. More than one-fourth (26%) of Latinos ages 18 to 29 say they or an immediate family member had been on probation or parole, or served time in prison or jail.

Overall, 13% of Latinos say they or an immediate family member had been on probation or parole. Young Latinos ages 18 to 29 are more likely than Latinos ages 30 or older to say they had been on probation or parole—19% versus 10%. Also, native-born Latinos are twice as likely as foreign-born Latinos to say they had been on probation or parole—18% versus 9%.

More than one-in-ten Latinos (12%) say they or someone in their immediate family served time in prison or jail in the previous five years. Native-born Latinos are more than twice as likely as immigrant Latinos to say that—18% versus 8%. And nearly two-in-ten (18%) Latinos ages 18 to 29 say they or someone in their family served time in jail or prison in the previous five years, double the share of Latinos ages 30 or older who say that (9%).

Serving as a Sworn Witness in Court

Overall, more than one-in-ten (11%) Hispanics say they or an immediate family member served as a sworn witness in court in the previous five years. U.S. citizen Hispanics are more likely to say this than are non-U.S. citizen Hispanics—14% versus 6%. And native-born Hispanics are more likely than immigrant Hispanics to say they served as a sworn witness—16% versus 7%.

Neighborhood Safety

More than one-third (35%) of Latinos report that there are areas within a mile of their home where they are afraid to walk alone at night.5 Though overall Latinos are more likely than the general population to report being victims of crime, their perceptions about neighborhood safety jibe with those of the general population, of whom 37% report that they don’t feel safe walking alone at night in their own neighborhood (Gallup, 2008).

For Latinos, neighborhood safety perceptions do not differ significantly by gender, age, or education. Safety concerns are also consistent across nativity and citizenship status.

Appendix A: Survey Methodology

Results for this study are based on telephone interviews conducted by ICR/International Communications Research, an independent research company, among a nationally representative sample of 2,015 Latino respondents ages 18 and older, from June 9 through July 13, 2008. Of those respondents, 711 were native born (including Puerto Rico) and 1,302 were foreign born; 892 were registered voters. The margin of error for total respondents is plus or minus 2.8 percentage points at the 95% confidence level. The margin of error for native-born respondents is plus or minus 4.9 percentage points at the 95% confidence level; for foreign-born respondents, plus or minus 3.4 percentage points; and for registered voters, plus or minus 4.4 percentage points.

For this survey, ICR maintained a staff of Spanish-speaking interviewers who, when contacting a household, were able to offer respondents the option of completing the survey in Spanish or in English. A total of 710 respondents were surveyed in English and 1,248 respondents were interviewed in Spanish (the remaining 57 were surveyed equally in both languages). Any adult of Latino origin or descent was eligible to complete the survey.

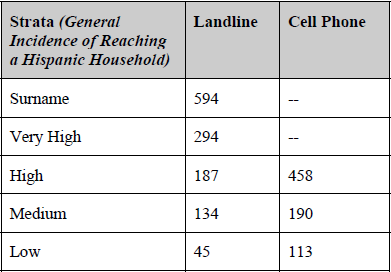
Because a growing number of Hispanic households in the U.S. are reachable only by cell phone, the study included interviews from both landline (n=1,254) and cell phone (n=761) sample frames. According to government statistics from the National Health Interview Survey (NHIS) during the last six months of 2007, 19.3% of Hispanic adults were reachable only by cell phone, a number that was 4 percentage points higher than it had been one year earlier. Adults who are cell-only are very different demographically from those reachable on a landline: They tend to be younger and less likely to be married or have children, or to own a home.

Both sample frames were stratified via a disproportionate stratified design. All telephone exchanges in the contiguous 48 states were divided into groups, or strata, based on their concentration of Latino households. For the landline frame, the sample was also run against InfoUSA and other listed databases, and then scrubbed against known Latino surnames. Any “hits” were subdivided into a “surname” stratum, with all other sample being put into other “RDD” strata. Overall, then, the study employed eight strata:

It is important to note that the existence of a surname stratum does not mean this was a surname sample design. The sample is random digit dial (RDD), with the randomly selected telephone numbers divided by whether they were found to be associated with or without a Latino surname. This was done simply to increase the number of strata and thereby increase the ability to meet ethnic targets and ease administration by allowing for more effective assignment of interviewers and labor hours.

A four-stage weighting design was used to ensure an accurate representation of the national Hispanic population. First, an adjustment was made for all people found to possess both a landline and a cell phone, as they were twice as likely to be sampled as were respondents who possessed only one phone type. The sample was then corrected for the disproportionality of the stratification scheme described earlier. Third, the sample was corrected to reflect the percentage that is cell-only, landline-only or reachable by either a landline or a cell phone. NHIS and Pew Research Center data were used to project percentages that the Pew Research Center felt were appropriate for the 2007 population.

Finally, the data were put through a post-stratification sample balancing routine. The post-stratification weighting utilized national 2007 estimates from the Census Bureau’s Current Population Survey, March Supplement, on gender, education, age, region, foreign/native born status, year of entry into the U.S. and Hispanic heritage.