
Pew Research Center

FOR RELEASE JANUARY 15, 2009

Hispanics and the New Administration

Immigration Slips as a Top Priority

FOR MEDIA OR OTHER INQUIRIES:

Communications Department
202.419.4372
www.pewresearch.org

RECOMMENDED CITATION

Pew Research Center, January 2009, "Hispanics and the New Administration"

About Pew Research Center

Pew Research Center is a nonpartisan, nonadvocacy fact tank that informs the public about the issues, attitudes and trends shaping the world. It does not take policy positions. The Center conducts public opinion polling, demographic research, computational social science research and other data-driven research. It studies politics and policy; news habits and media; the internet and technology; religion; race and ethnicity; international affairs; social, demographic and economic trends; science; research methodology and data science; and immigration and migration. Pew Research Center is a subsidiary of The Pew Charitable Trusts, its primary funder.

© Pew Research Center 2026

Table of contents

  • About Pew Research Center
  • Hispanics and the New Administration
  • II. Looking Forward: The Obama Administration
  • III. Looking Back: The Bush Administration
  • IV. Hispanics and the 2008 Election
  • Appendix A: Survey Methodology

Hispanics and the New Administration

Immigration Slips as a Top Priority

I. Overview

A year and a half after a lengthy, often rancorous debate over immigration reform filled the chambers of a stalemated Congress, the issue appears to have receded in importance among one of the groups most affected by it—Latinos.

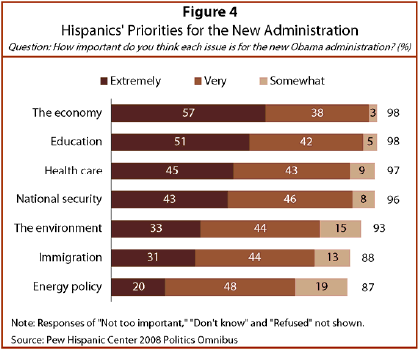
Only three-in-ten (31%) Latinos rate immigration as an “extremely important” issue facing the incoming Obama administration, placing it sixth on a list of seven policy priorities that respondents were asked to assess in a nationwide survey of 1,007 Latino adults conducted from December 3 to December 10, 2008 by the Pew Hispanic Center, a project of the Pew Research Center.

The top-rated issue among Latinos is the economy; 57% of Hispanics say it is an extremely important one for the new president to address. Education, health care, national security and the environment all also rate higher than immigration as a policy priority among Hispanics, while energy policy ranks lower.

Latinos, who make up 15% of the U.S. population, are by far the nation’s biggest immigrant group. According to Pew Hispanic Center tabulations of the 2006 American Community Survey, more than half (55%) of Latinos ages 18 and older are immigrants, and 47% of all immigrants ages 18 and older are Hispanic. Even at the apex of the congressional debate over immigration reform in 2007, however, the issue never rose to the top of Latinos’ priority list. Of six issues asked of Latinos in a 2007 Pew Hispanic Center survey, it ranked fifth. But back then, 38% of Hispanics judged immigration to be an extremely important issue—more than the 31% who say the same thing in the new survey.

Moreover, in an open-ended question on this latest survey, just 6% of Latino respondents who voted in the 2008 election cited immigration as the issue that mattered most to them as they went to the polls. Five times as many named the economy (31%). Higher shares also named candidate attributes (14%) and a general desire for change (13%). In last year’s presidential election, Latino voters supported Democrats Barack Obama and Joe Biden over Republicans John McCain and Sarah Palin by more than two-to-one—67% to 31% (Lopez 2008).1

The immigration issue has fallen in importance since 2007 among the general population as well. While 56% of all registered voters cited immigration as a very important issue in 2007 (Pew Research Center for the People & the Press, October 2007), this share fell to 49% in late 2008 (Pew Research Center for the People & the Press, October 2008).

The latest Pew Hispanic Center survey also explored attitudes among Latinos about the incoming Obama administration and the outgoing Bush administration, and it examined a range of political activities that Latinos engaged in during the historic 2008 presidential campaign. Among its other key findings:

  • In last year’s presidential election, Latino voters were more than twice as likely as voters in the general population to be first-time voters—21% versus 8%. Among Latino voters ages 18-29, 47% were first-time voters.
  • Hispanics are optimistic about the incoming Barack Obama administration. More than seven-in-ten (72%) say they expect Obama to have a successful first term.
  • More than half (54%) of Latinos say that the failures of the Bush administration will outweigh its successes. In comparison, 64% of the U.S. general population holds the same view.
  • Almost three-fourths (74%) of Latinos say they were more interested in last year’s presidential election than in the 2004 election.
  • Three-in-four (75%) Latinos say they were satisfied with the field of presidential candidates in 2008.
  • Overall, 83% of Hispanic voters say they learned enough from the campaigns to make informed choices.
  • Almost four-in-ten (38%) Latinos say they were contacted and encouraged to register to vote or to get out to vote.
  • Among Latinos contacted in the 2008 election campaign, 59% say they were contacted by the Obama campaign, while 43% say they were contacted by the McCain campaign.
  • Television was the most popular conduit of news about the 2008 presidential campaign among Latinos. More than eight-in-ten (82%) report obtaining most of their election news through television. Eighteen percent used newspapers to get most of their election news, 18% used the Internet for most of their news, and 10% of all Latinos obtained most of their campaign news through radio. In addition, 21% of respondents report getting at least some election news from the Internet.
  • Almost one-quarter (23%) of Latinos who obtained campaign information from television report that the information was in Spanish, while one-third (33%) got their television news in English; 44% obtained television news about the election in both languages.
  • More than half (51%) of Latinos say they participated in at least one political activity other than voting during the 2008 election season. More than one-third (36%) say they used the Internet to research a candidate; 26% tried to persuade someone to vote for or against a particular party; 18% say they displayed material or wore clothing related to a political campaign; 11% say they attended a political or campaign-related event; 9% say they contributed money to a candidate; and 5% say they volunteered or worked for a political candidate.
  • Forty-four percent of Hispanics say that the recent election has made them more likely to participate in politics in the future.

This report is based on two bilingual telephone surveys. The first, the 2008 National Survey of Latinos, Economics and Politics, is a nationally representative sample of 1,540 Hispanics ages 18 and older. Interviews were conducted from November 11 through November 30, 2008. The margin of error for the full sample is plus or minus 3.0 percentage points at the 95% confidence level. The second survey, the Pew Hispanic Center 2008 Politics Omnibus, was conducted among a nationally representative sample of 1,007 Latino respondents ages 18 and older, from December 3 through December 10, 2008. The margin of error for the full sample is plus or minus 4.5 percentage points at the 95% confidence level. For a full description of methodologies for both surveys, see Appendix A.

About this Report

This report utilizes results from two national surveys of Hispanic adults. First, the 2008 National Survey of Latinos, Economics and Politics, examines Hispanic adults’ views of the 2008 election and their participation in political activities in the 2008 election. The survey was conducted from November 11 through November 30, 2008, among a randomly selected, nationally representative sample of 1,540 Hispanic adults. The survey was conducted in both English and Spanish. The margin of error for the full sample is plus or minus 3.0 percentage points at the 95% confidence level.

The second survey, the Pew Hispanic Center 2008 Politics Omnibus, was conducted among a nationally representative sample of 1,007 Latino respondents ages 18 and older, from December 3 through December 10, 2008. The survey was conducted in both English and Spanish. The margin of error for total respondents is plus or minus 4.5 percentage points at the 95% confidence level. For a full description of the methodology for both surveys, see Appendix A.

A Note on Terminology

The terms “Latino” and “Hispanic” are used interchangeably in this report, as are the terms “foreign born” and “immigrant.”

The terms “general population” and “general public” are used interchangeably in this report to refer to the entire U.S. adult population, including Hispanics.
II. Looking Forward: The Obama Administration

Latinos are optimistic about the incoming Obama administration. Seventy-two percent believe that Barack Obama will have a successful first term, while 13% expect his first term to be unsuccessful.

Both native-born and foreign-born Latinos hold equally positive perspectives on the Obama administration. Seventy-three percent of the native born foresee success for Obama, as do 72% of the foreign born.

A sense of optimism is especially pervasive among young Latinos. Eighty-one percent of Latinos ages 18 to 29 expect him to succeed, compared with 75% of those ages 30 to 39; 63 percent of those ages 40 to 54; and 72% of those ages 55 and older.

Latinos with less education are more positive about the incoming administration than are Latinos with a college degree. Nearly eight-in-ten (78%) Hispanics who lack a high school diploma and 73% with only a high school diploma foresee success for Obama, compared with 55% who have a college degree.

Men are less optimistic than women about the future success of the Obama administration–67% versus 77%.

Latino Republicans are less optimistic than Democrats or independents about Obama’s ability to succeed. Even so, almost half (48%) of Latino Republicans expect Obama to be successful in his first term. In comparison, this number rises to 80% among Democrats and 72% among independents.2

Priorities for the Obama Administration

Latinos rate the economy as a top priority for the new administration.3 Ninety-eight percent identify the economy as extremely (57%), very (38%) or somewhat important (3%). Education is also a top priority; 98% of Latinos see it as an important issue, and 51% identify it as extremely important. Health care ranks next, with 97% of Latinos stating that it is an important issue. National security (96%) and the environment (93%) are also high priorities on the list of political issues. Energy policy ranks relatively low among Hispanics compared with other issues, though a sizable proportion—87%—consider it important.

Among Latinos, immigration ranks near the bottom of the seven issues in order of importance, just above energy policy. However, while immigration is not identified as a top issue, nearly nine-in-ten Latinos (88%) cite it as important, with 31% considering it extremely important. Among immigrants, the overall concern with immigration is slightly higher: 89% state that it is an important issue, and about one-third (31%) consider it extremely important. In comparison, three-fourths (86%) of the native born cite immigration as an important issue, with 30% stating that it is extremely important.

III. Looking Back: The Bush Administration

In contrast to their optimism regarding the new Obama administration, Latinos offer a largely negative assessment of the Bush administration as it comes to an end. Even though President George W. Bush won 40% of the Latino vote in 2004 (Suro, Fry, Passel 2005)—a high for a Republican presidential nominee in recent elections—more than half (54%) of Latinos now expect that his failures will outweigh his accomplishments. Just two-in-ten (19%) Latinos state the opposite. Though critical of Bush, the Latino population is less disapproving than the general population. Among that group, almost two-thirds (64%) feel that the failures of the Bush administration outweigh any accomplishments, while 24% say the opposite (Pew Research Center for the People & the Press, December 2008).

Some of the biggest differences in perspectives on the Bush administration relate to educational levels. Hispanics with less than a college degree are less likely to assess the Bush legacy positively than are better educated Latinos. Half (50%) of people with no high school diploma, and 59% of people with only a high school diploma, think the Bush administration will be remembered more for its failures than for its accomplishments, compared with 42% of Latinos who have college degrees or more. Conversely, 17% of those lacking a high school diploma, 18% of those with only a high school diploma and 34% of college graduates believe that Bush will be remembered more for his accomplishments.

As expected, political party affiliation is strongly associated with assessments of the Bush administration. Even so, Latinos who say they identify with the Republican Party4 are far from united in their perspective on George W. Bush. Almost one-in-four (39%) Latino Republicans believe that Bush’s failures will outweigh his accomplishments, while 44% say the opposite. Among Latino Democrats, 70% believe that his failures will outweigh any accomplishments, while 15% believe that Bush’s accomplishments will prevail. Evaluations offered by Latino independents are less lopsided, though still negative—49% argue that history will most remember the failures of the administration, and 18% believe history will most remember its successes.

IV. Hispanics and the 2008 Election

Interest in the 2008 Campaign

Interest in the presidential campaign was high in 2008. Nearly three-in-four Latinos (74%) say they were more interested in the 2008 election than in the 2004 election. However, compared with Latinos who are U.S. citizens, Latinos who are not citizens expressed a greater interest in the 2008 election than in the 2004 election—80% versus 71%. Similarly, immigrant Latinos, more so than native-born Latinos, say they were more interested in politics in 2008 compared with 2004—78% versus 70%—even though not all of them could vote because they are not U.S. citizens.

Young Latinos ages 18-29, more so than Latinos ages 55 or older, say they were more interested in politics in 2008 than in 2004—82% versus 62%.

First-Time Voters

More than one-in-five Hispanic voters (21%) say that 2008 was the first year they voted in a U.S. election. This is higher than what is observed among voters in the general U.S. population, but it is similar to the share of African-American voters who say they were first-time voters. According to the Pew Research Center for the People & the Press (November 2008), 8% of all voters, and 20% of African-American voters, in 2008’s general election were casting ballots for the first time.

Almost half (47%) of Hispanic voters ages 18-29 say they were first-time voters in last year’s presidential election. In comparison, 20% of Hispanic voters ages 30-39 and 15% of Hispanic voters ages 45-54 say they were first-time voters.

While younger Latino voters are more likely than older Latino voters to say they were first-time voters, there is no statistical difference in the likelihood of foreign-born and native-born Latino voters to say they were first-time voters; the rates are 23% and 20% respectively.

There are some differences in the prevalence of first-time voters among Hispanics, based on their political affiliations. Three-in-ten (30%) Hispanic voters who identify themselves as independents were first-time voters, while 23% of Hispanic voters who identify with or lean toward the Democratic Party were first-time voters. Among Hispanic voters who identify with or lean toward the Republican Party, 12% say they were first-time voters.

Contact with the Campaigns

Many Hispanics were contacted by nonpartisan voter registration and get-out-the-vote efforts as well as the political campaigns during 2008’s election season. Almost four-in-ten (38%) Latinos say they were contacted and encouraged to register to vote or to get out to vote. Among the native born, 50% were contacted.

Among those who were contacted, 59% say they were contacted by the Obama campaign, while 43% say they were contacted by the McCain campaign.

The majority of Latinos who were contacted by the presidential campaigns were contacted in English. Two-thirds (67%) of Latinos contacted by the McCain campaign were contacted in English, as were 58% of people contacted by the Obama campaign. Sizable proportions who were contacted by the presidential campaigns received messages in both English and Spanish. The Obama campaign was more likely than the McCain campaign to contact Latinos in both languages—32% versus 25%. The likelihood of being contacted by either campaign in Spanish only was quite low; 8% of persons contacted by the Obama campaign were contacted in Spanish, compared with 5% of those contacted by the McCain campaign.

Sources of Campaign News Information

Television was the most popular conduit of news about the 2008 presidential campaign among Latinos. More than eight-in-ten (82%) report obtaining most of their information regarding the campaign through television news. Newspapers and the Internet also proved important sources of campaign news information in the most recent election cycle. Eighteen percent of Latinos report that they used each of these sources to obtain most of their campaign news, and in a follow-up question, another 21% of Latinos report obtaining at least some campaign news from the Internet. Ten percent of Latinos obtained news regarding the campaign from radio. Magazines were a source of campaign information for 3% of Latinos.

The language in which Latinos gathered campaign news varies by media source. Almost one-quarter (23%) of Latinos who got information from television report that the information was in Spanish, while one-third (33%) got their television campaign news in English and 44% obtained television news in both languages. Latinos who obtained information from the Internet or newspapers were more likely to obtain that news exclusively in English. Sixty-five percent of campaign news from the Internet was in English, as was 57% of news from newspapers. Six percent of Latinos who obtained campaign news from the Internet obtained that information in Spanish, as did 15% of Latinos who used newspapers. Among both Internet users and newspaper readers, 28% obtained news in both languages. Thirty-eight percent of people who obtained campaign news from the radio did so in English, 31% listened in Spanish, and 31% obtained campaign news from the radio in both languages. (The sample of respondents obtaining information from magazines is too small to disaggregate by language.)

The Voting Process

The 2008 presidential election was marked by high turnouts throughout the country and across demographic groups (Lopez 2008). Nationally, rates of early voting and voting by mail were also exceptionally high (Pew Research Center for the People & the Press, November 2008). The same is true for Latinos, whose overall voting profile closely resembles that of the general population.

Among Latinos, more than one-third (36%) cast ballots in the presidential election prior to Election Day. This is similar to voting practices in the general population, of whom 34% voted prior to Election Day (Pew Research Center for the People & the Press, November 2008).

All told, 83% of Latinos who voted in the November 2008 election did so in person, either on Election Day or earlier. Sixteen percent of Latinos used mail-in ballots. In comparison, 85% of the general U.S. population voted in person, and 14% voted by mail.

More than one-third (35%) of Latinos who voted in person say that they had to wait in line to vote. Ten percent waited less than 15 minutes; 15% waited up to an hour; and 9% waited an hour or more. These wait times are similar to those experienced by the general U.S. population.

Learning About the Presidential Campaigns

Overall, 83% of Hispanic voters say they learned enough from the campaigns to make informed choices in last year’s election. This is similar to the share (85%) of voters in the general population who say they learned enough to make informed choices (Pew Research Center for the People & the Press, November 2008).

Satisfaction with the Presidential Candidates

In a long presidential election campaign with more than 20 candidates from many parties, nearly three-in-four (74%) Hispanic voters were satisfied with the field of candidates. In comparison, 67% of the general U.S. population voters say that they were satisfied with the choice of candidates in last year’s campaign (Pew Research Center for the People & the Press, November 2008).

Almost nine-in-ten (88%) Latino voters who identify with or lean toward the Democratic Party say they were satisfied with their candidate choices. In contrast, 58% of Latino independent voters and 43% of Latino Republican voters say they were satisfied with their options.

Eight-in-ten (80%) first-time voters say they were satisfied with the choice of candidates. Among young Latino voters ages 18-29, 85% say they were satisfied with candidate choices in the most recent election, while only 66% of those ages 55 and older felt that way.

Top Issues in the 2008 Election for Latino Voters

Among Hispanic voters, the issues that mattered most in determining their vote were the economy and jobs. When asked in an open-ended question, more than three-in-ten (31%) say as much. Candidate attributes (14%) and the general idea of change (13%) are also cited as important in affecting voting decisions. Six percent of Latino voters cite immigration as the issue that mattered most to them in deciding how they voted for president in 2008.

Political Engagement in the 2008 Election

More than half (51%) of all Latinos say they participated in at least one political activity other than voting during the most recent election cycle.

  • More than one-third (36%) of Latinos say they used the Internet to find information about a political candidate.
  • More than one-fourth (26%) say they tried to persuade someone to vote for or against a particular party.
  • Almost one-in-five (18%) of all Latinos say they displayed a bumper sticker or poster or wore clothing or a button related to a political campaign.
  • About one-in-ten (11%) Latinos say they attended a political or campaign-related meeting in the past year.
  • Nearly one-in-ten Latinos (9%) say they contributed money to a candidate running for public office. Among those who did so, one-third (33%) say they contributed online.
  • Five percent of Latinos say they worked as a volunteer or for pay for a political candidate in the last year.

Latinos ages 18-29 were more engaged in the election process than were older Latinos. More than six-in-ten (62%) young Latinos engaged in at least one activity during the election year, compared with 37% of Latinos ages 55 and older. On specific political activities, one-third (33%) of young Latinos say they tried to persuade someone how to vote, while less than a quarter of older Latinos say they did so (23% of those ages 30-39; 23% of those ages 40-54; and 21% of those ages 55 or older). Similarly, almost half (49%) of young Latinos say they used the Internet to find information about a candidate, compared with only 36% of those ages 30-39; 33% of those ages 40-54; and 14% of those ages 55 and older. And young Latinos were more likely to display campaign buttons and signs than were their counterparts ages 55 and older—23% versus 12%.

Voters, more than non-voters, say they used the Internet to find information about a candidate—49% versus 28%. Hispanic voters are also more likely than non-voters to say they tried to persuade someone how to vote—33% versus 25%. And voters were more likely to say they displayed a bumper sticker or other political campaign sign—24% versus 13%. More than one-third (36%) of Hispanic voters say they did not engage in any of those activities in the past year, a smaller percentage than those who were not voters (53%).

Future Engagement

Looking ahead, more than four-in-ten (44%) Latinos say that the recently completed election campaign has made them more likely to participate in politics in the future. This is particularly true among young Latinos ages 18-29, over half of whom say so (52%). In comparison, three-in-ten Latinos ages 55 and older say the recent election campaign has made them more likely to participate in politics in the future.

More than half (52%) of Hispanics who identify with or lean toward the Democratic Party say that, given 2008’s presidential campaign, they are more likely to participate in politics in the future. In comparison, 32% of Hispanics who identify with or lean toward the Republican Party and 28% of Hispanic independents say they are more likely to participate in politics in the future.

Appendix A: Survey Methodology

Results for this study are based on telephone interviews obtained through two surveys conducted by ICR/International Communications Research, an independent research company.

One survey, the 2008 National Survey of Latinos, Economics and Politics, was conducted among a nationally representative sample of 1,540 Latino respondents ages 18 and older, from November 11 through November 30, 2008.

Of those respondents, 622 were native born (including Puerto Rico) and 914 were foreign born (excluding Puerto Rico). The margin of error for total respondents is plus or minus 3.0 percentage points at the 95% confidence level. The margin of error for native-born respondents is plus or minus 4.8 percentage points at the 95% confidence level, and for foreign-born respondents it is plus or minus 3.8 percentage points.

The second survey, the Pew Hispanic Center 2008 Politics Omnibus, was conducted among a nationally representative sample of 1,007 Latino respondents ages 18 and older, from December 3 through December 10, 2008. Of those respondents, 351 were native born (including Puerto Rico) and 654 were foreign born (excluding Puerto Rico). The margin of error for total respondents is plus or minus 4.5 percentage points at the 95% confidence level. The margin of error for native-born respondents is plus or minus 7.5 percentage points at the 95% confidence level, and for foreign-born respondents it is plus or minus 5.5 percentage points at the 95% level.

Both surveys used analogous sampling, weighting and surveying procedures.

ICR maintained a staff of Spanish-speaking interviewers who, when contacting a household, were able to offer respondents the option of completing the survey in Spanish or in English. Any adult male or female of Latino origin or descent was eligible to complete the survey. For the 2008 National Survey of Latinos, Economics and Politics, a total of 546 respondents were surveyed in English and 976 respondents were interviewed in Spanish (and 18 equally in both languages). For the 2008 Politics Omnibus, a total of 302 respondents were surveyed in English and 695 respondents were interviewed in Spanish (and 10 equally in both languages).

The sample frames were stratified via a disproportionate stratified design. All telephone exchanges in the contiguous 48 states were divided into groups, or strata, based on their concentration of Latino households. The sample was also run against InfoUSA and other listed databases, and then scrubbed against known Latino surnames. Any “hits” were subdivided into a “surname” stratum, with all other sample being put into other “RDD” strata. Overall, then, each of the studies employed five strata: surname, very high incidence, high incidence, medium incidence and low incidence.

It is important to note that the existence of a surname stratum does not mean these were surname sample designs. The samples are random digit dial (RDD), with the randomly selected telephone numbers divided by whether they were found to be associated with or without a Latino surname. This was done simply to increase the number of strata and thereby increase the ability to meet ethnic targets and ease administration by allowing for more effective assignment of interviewers and labor hours.

Once collected, the data were corrected for the disproportionality of the stratification scheme described earlier. Then, the data were put through a post-stratification sample balancing routine. The post-stratification weighting utilized national 2008 estimates of gender, education, age, region, status as foreign born or native born, year of entry into the U.S. and Hispanic heritage, obtained from the Current Population Survey, March Supplement.