Pew Research Center

FOR RELEASE OCTOBER 22, 2008

Latinos Account for Half of U.S. Population Growth Since 2000

Hispanics have accounted for more than half (50.5%) of the overall population growth in the United States in this decade, a significant new demographic milestone for the nation's largest minority group.

FOR MEDIA OR OTHER INQUIRIES:

Communications Department
202.419.4372
www.pewresearch.org

RECOMMENDED CITATION

Pew Research Center, October 2008, "Latinos Account for Half of U.S. Population Growth Since 2000"

About Pew Research Center

Pew Research Center is a nonpartisan, nonadvocacy fact tank that informs the public about the issues, attitudes and trends shaping the world. It does not take policy positions. The Center conducts public opinion polling, demographic research, computational social science research and other data-driven research. It studies politics and policy; news habits and media; the internet and technology; religion; race and ethnicity; international affairs; social, demographic and economic trends; science; research methodology and data science; and immigration and migration. Pew Research Center is a subsidiary of The Pew Charitable Trusts, its primary funder.

© Pew Research Center 2026

Table of contents

  • About Pew Research Center
  • Latinos Account for Half of U.S. Population Growth Since 2000
  • II. The Growth and Dispersion of Hispanics in the New Century
  • III. Fast-Growing Hispanic Counties in the New Century
  • IV. Hispanic Dispersion in the 1990s
  • V. The Growth of Hispanics and Non-Hispanics in the New Century
  • VI. The Characteristics of Hispanics in the Fast-Growing Hispanic Counties
  • Appendix A: Data Sources
  • Appendix B: Additional Table

Latinos Account for Half of U.S. Population Growth Since 2000

Hispanics have accounted for more than half (50.5%) of the overall population growth in the United States in this decade, a significant new demographic milestone for the nation's largest minority group.

I. Overview

Accompanying this report, the Pew Hispanic Center is releasing a series of interactive maps that illustrate the size and spread of Hispanic population growth since 1980.

Since the turn of the century, Hispanics have accounted for more than half (50.5%) of the overall population growth in the United States—a significant new demographic milestone for the nation’s largest minority group. From April 1, 2000, to July 1, 2007, the Hispanic population increased by 10.2 million to 45.5 million, a growth of 29%. During this same period, the much larger non-Hispanic population of the U.S. grew by 10 million, a growth of just 4%. As of mid-2007, Hispanics made up 15.1% of the total U.S. population but accounted for a majority of the nation’s total population increase since 2000. During the 1990s, the Hispanic population also expanded rapidly, but over the course of that decade its growth accounted for less than 40% of the nation’s total population increase.

In a reversal of past trends, Latino population growth in the new century has been more a product of the natural increase (births minus deaths) of the existing population than it has been of new international migration. Of the 10.2 million increase in the Hispanic population since 2000, about 60% of the increase (or 6 million) is due to natural increase and 40% is due to net international migration, according to U.S. Census Bureau figures. By contrast, more of the Hispanic population increase in the U.S. during the 1990s was the result of immigration (56%) rather than births over deaths of existing residents (44%), according to Pew Hispanic Center estimates.1

There are several other noteworthy trends in Latino growth and settlement patterns. Until two decades ago, the nation’s Hispanic population had been heavily concentrated in long-established areas of Hispanic settlement. In 1990, for example, almost three-quarters of the Hispanic population resided in just 65 of the nation’s 3,141 counties. Beginning in the 1990s, the Hispanic population began to disperse across the U.S.—most notably, establishing significant population centers in many counties in the South and Midwest that historically had very few Hispanics residents.

This dispersal has continued in the new century. However, since 2000 the geographic patterns of Hispanic dispersal have differed somewhat from the patterns of the 1990s, according to a Pew Hispanic Center analysis of the most recent U.S. Census Bureau county population counts.

The most notable difference is that Hispanic dispersion in this new century has been tilted more toward counties in the West and the Northeast than it had been the 1990s; correspondingly, it has also been slightly less tilted toward counties in the South2 and Midwest. Despite this new tilt, in the current decade the South accounts for a greater share of overall Latino population growth than any other region. And together, the South and West still account for more than 80% of the Hispanic population growth in this decade, while the Northeast and Midwest account for just under 20%. This ratio was very similar in the 1990s.

Another subtle difference in Hispanic settlement patterns in this decade compared with those of the 1990s has to do with an ever-growing concentration of Hispanic population growth in metropolitan areas. Looking just at counties that have had above-average Latino population growth since 2000, fully 94% are part of what the Census Bureau defines as a metropolitan area. In the 1990s, so-called metropolitan counties also loomed large in Latino population growth, but their share of growth among fast-growing Latino counties was a bit smaller—89%.

It should be noted that under the Census Bureau’s classification system, “metropolitan county” does not necessarily refer to a large city. Indeed, many of the “metropolitan counties” that have experienced the fastest rate of growth in their Hispanic population in this decade are either suburbs (typically, outer suburbs) or small or mid-sized cities. For example, the fastest-growing Hispanic county in the country in the current decade—Frederick County, Virginia, whose Hispanic population has more than quadrupled since 2000—is in a small-city metropolitan area adjacent to Washington, D.C.

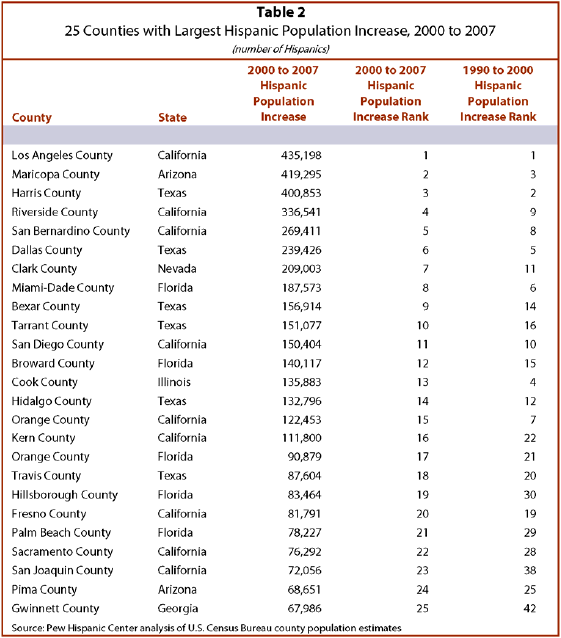
A handful of big cities have also played a sizable role in Latino population growth in this decade. But because these cities already had a large base of Hispanic residents at the start of the decade, the growth of their Latino population since then—while sizable in number—has been less dramatic in percentage terms. So, for example, the Latino population grew by more than 400,000 from 2000 to 2007 in just three counties: Los Angeles, Maricopa (Phoenix) and Harris (Houston). But when their Hispanic growth is measured as a rate rather than as an absolute number, none of those counties ranks in the top 400 of the nation’s fastest-growing Latino counties in the current decade.

For the purposes of this report, the Pew Hispanic Center has identified 676 fast-growing Hispanic counties among the nation’s total of 3,141 counties. These counties all share two characteristics: a 2007 Latino population of at least 1,000; and an above-average Hispanic growth of at least 41% from 2000 to 2007.

More than three-quarters (528) of these 676 fast-growing Hispanic counties also experienced fast Hispanic growth during the 1990s, exemplifying the continuity in Latino settlement patterns since 1990. At the same time, however, the addition of 148 counties experiencing rapid growth, as well as the cooling off of Hispanic population growth in some formerly rapidly growing counties, reflects the changes in the regional and metropolitan patterns in Latino growth in the new century.

For example, some counties in Maine, Vermont and Massachusetts in the Northeast and in Montana, New Mexico and California in the West that have experienced fast Hispanic population growth in the new century were not fast-growers in the 1990s. In the South, too, Hispanics have dispersed to some new settlement areas in this decade—perhaps most notably to several counties in Louisiana, whose Hispanic populations have sharply increased in the wake of Hurricane Katrina. Also, while the strong Hispanic growth that some parts of the Midwest experienced in the 1990s has continued into the new century, the formerly fast rates of Hispanic growth in other areas of that region—especially in economically hard-hit counties in western Michigan and western Minnesota—have fallen below average in the new century.

These 676 fast-growing Hispanic counties have also experienced significant growth in their non-Hispanic populations. In the aggregate, the non-Hispanic population of these 676 counties has increased by 9.9 million since 2000, accounting for virtually all of the nation’s 10 million increase in non-Hispanics during this decade. In short, growth begets growth, irrespective of ethnicity. The counties to which Latinos are dispersing in the new century are also attracting non-Latinos.

Hispanics residing in these fast-growing Hispanic counties have somewhat different demographic characteristics than their Hispanic counterparts in older, established, but more slow-growing Hispanic counties. The most marked difference is in the adult gender balance. The slow-growing Hispanic counties have slightly more adult male Latinos than adult female Latinos, 104 men for every 100 women. In contrast, in the fast-growing Hispanic counties there are 120 adult men for every 100 adult women. Also, immigrants make up a greater share of the Hispanic population in the fast-growing counties (42%) than they do in older, established Hispanic counties (39%). Similarly, a modestly higher share of Hispanics are not U.S. citizens in the fast-growing counties than in slow-growing Hispanic counties.

However, in some respects Hispanics in the fast-growing areas resemble Hispanics in the slow-growing counties. The English language abilities and levels of high school completion of Latinos are nearly the same in both kinds of counties; so, too, is the poverty rate among Latinos.

Among the report’s other key findings:

  • Hispanic population growth in the new century has been widespread. The Hispanic population has grown in almost 3,000 of the nation’s 3,141 counties.
  • At the same time, Hispanic population growth in the new century has been fairly concentrated. Hispanic population growth in just 178 counties accounts for 79% of the nation’s entire 10.2 million Hispanic population increase.
  • In spite of the geographic dispersal of Hispanics, the Hispanic population continues to be much more geographically concentrated than the non-Hispanic population. In 2007, the 100 largest Hispanic counties were home to 73% of the Latino population. By contrast, the 100 largest non-Hispanic counties were home to just 39% of the nation’s non-Hispanics.
  • By this measure, Hispanics are more geographically concentrated than the nation’s black population. Nearly six-in-ten (59%) of the non-Hispanic black population live in the nation’s 100 largest non-Hispanic black counties.

About this Report

Most of this report’s analyses are based on the 2007 county population estimates produced by the U.S. Census Bureau, supplemented by 1990 and 2000 county population counts from the Decennial Censuses. Hispanic population counts are available for all of the nation’s 3,141 counties. Virtually all of the growth (98%) in the Hispanic population in both the 1990s and the new century occurred in 1,362 counties, that is, counties that have at least 1,000 Hispanic residents in 2007. The report focuses on the patterns of Hispanic population growth in these 1,362 counties and the impact of Hispanic population growth on total county population growth in this subset of counties. Very little of the nation’s non-Hispanic population growth since 2000 is omitted because these 1,362 counties account for 98% of the increase in the nation’s non-Hispanic population as well.

A detailed statistical appendix on the 1990, 2000 and 2007 Hispanic population and total population counts is available. Counts are provided for all 3,141 counties. Absolute population increases as well as growth rates (in percent) are also provided.

Public use micro sample data from the Census Bureau’s 2007 American Community Survey, as well the 1990 and 2000 Decennial Censuses, are also used to examine the characteristics of Hispanics and non-Hispanics in the new settlement areas versus traditional Hispanic areas. This pioneering use of American Community Survey data provides a detailed snapshot of the broad characteristics of Latinos in the nation’s fast-growing Hispanic counties.

A Note on Terminology

The terms “Latino” and “Hispanic” are used interchangeably in this report, as are the terms “foreign born” and “immigrant.”

Recommended Citation

Richard Fry. Latino Settlement in the New Century. Washington, DC: Pew Hispanic Center, October 2008.

II. The Growth and Dispersion of Hispanics in the New Century

The Growth of Hispanics

Census Bureau estimates indicate that the Hispanic population grew by 10.2 million from 2000 to 2007. The increase in the Hispanic population was quite widespread: Of 3,141 counties across the U.S., the Hispanic population increased in 2,991.

Though widespread, the increase in the Hispanic population has nonetheless been fairly concentrated. This is underscored three ways.

First, the 40 counties with the largest Hispanic population increases since 2000 account for half (5.1 million) of the total 10.2 million increase in the nation’s Hispanics. These 40 counties tend to be the ones with the largest Hispanic populations (Table 1). A county’s Hispanic population size is highly associated with a county’s Hispanic population gain (measured in absolute terms) (Table 2). As discussed shortly, in 2000 the Hispanic population was fairly geographically concentrated, so the Hispanic population gains have been fairly concentrated.

Second, 178 counties experienced an increase in their Latino population of at least10,000, and the growth in the Hispanic population in those 178 counties account for 79% of the total 10.2 million increase in the nation’s Hispanic population. Map 1 portrays counties by the size of their Hispanic population increase since 2000.

Third, virtually all (99%) of the nation’s Hispanic population lives in the 1,362 (out of 3,141) counties that had at least 1,000 Hispanic residents in 2007. The Hispanic population increased by 10.0 million in these counties since 2000, accounting for virtually all (98%) of the growth in nation’s Hispanic population in this decade.

Dispersion of Hispanics

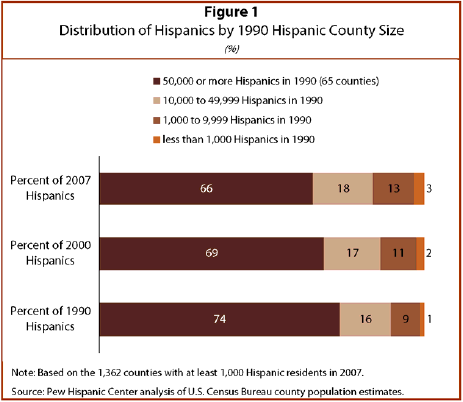
One of the most prominent features of the growth of Hispanics since 1990 has been the dispersal of Hispanics to new destinations (Durand, Telles and Flashman, 2006; Suro and Singer, 2002). As many county supervisors and school districts know, there are now many Hispanics residing in counties that until 1990 had small Hispanic populations.3 This pattern, which took hold in the 1990s, has continued in the new century. Though Latinos remain highly concentrated in a subset of large counties, they are slightly less concentrated now than in 2000. Dispersal continues.

In 1990, 74% of Hispanics resided in 65 counties that had at least 50,000 Hispanics (Figure 1). By 2000, 69% of the total Hispanic population resided in these 65 counties. Since 2000, those 65 counties have continued to have a diminishing share of the Latino population: In 2007, they were home to just 66% of the Hispanic population.

Similarly, in 1990, 90% of the Hispanic population lived in the 220 counties that had at least 10,000 Hispanics residents. In 2000, those same 220 counties had 87% of the nation’s Hispanic population; by 2007, it was 84%.

III. Fast-Growing Hispanic Counties in the New Century

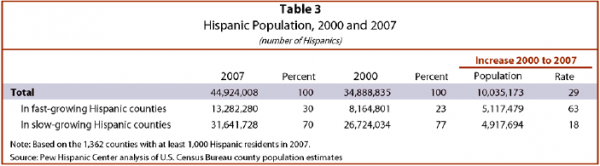
Since 2000, the nation’s Hispanic population has grown by 29%. In half of the counties with at least 1,000 Latino residents, the Hispanic population grew by at least 41% since 2000. Map 2 shows the 676 counties that experienced Hispanic growth rates at or above this nationwide county average. These fast-growing Hispanic counties in the new century tend to be counties that had smaller Hispanic population bases in 2000. In 2000, about one-quarter (23%) of the nation’s Hispanic population resided in the fast-growing counties (Table 3). Because of the continued dispersion of Hispanics, by 2007 some three-in-ten Hispanics resided in these fast-growing counties.

Overall, the Hispanic population in the 676 fast-growing counties grew by 63%. However, many of the fast-growing counties had Hispanic population growth rates above that.

Dispersion by Metropolitan versus Non-Metropolitan County

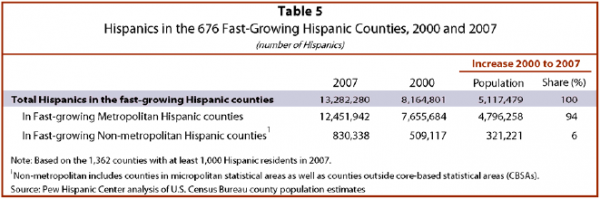
In the new century, Hispanics have been dispersing overwhelmingly to counties in metropolitan areas.4 The Hispanic population residing in the 676 fast-growing Hispanic counties increased by 5.1 million from 2000 to 2007 (Table 5). Almost 4.8 million of that population growth, or 94%, has been in metropolitan counties. Two-thirds (447 counties) of the 676 fast-growing counties are metropolitan counties.

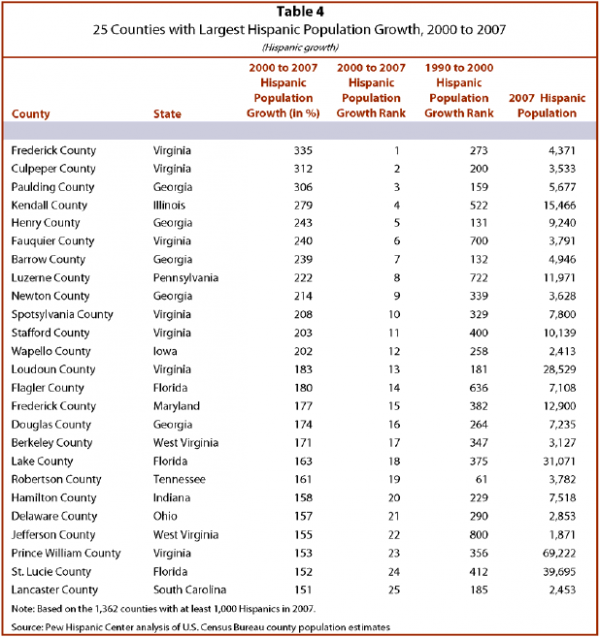
The importance of metropolitan counties is evident in the Table 4 list above of the 25 counties with the largest Hispanic population growth rates in the new century. Of the 25 fastest-growing counties, 22 are metropolitan counties. The only exceptions are Culpeper (Virginia), Wapello (Iowa), and Lancaster (South Carolina) counties, which are in micropolitan (non-metropolitan) statistical areas.

The fact that Hispanics are dispersing to counties in metropolitan areas does not mean those counties have large Hispanic populations. Figure 1 above shows that Hispanics are increasingly residing in counties that had fewer than 10,000 Latinos in 1990—many of which are metropolitan counties, according to the Census Bureau definition. In fact, half of the metropolitan counties in the country had Hispanic populations of 2,315 or less in 1990.

Dispersion by Region

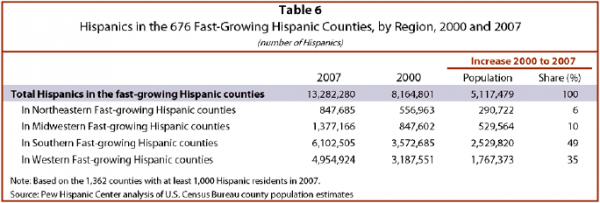
In this decade, the bulk of the Hispanic population growth in fast-growing counties has occurred in the South and the West. Southern counties alone account for almost half (2.5 million) of the 5.1 million increase in the Latino population in the fast-growing counties, while Western counties account for over one-third (Table 6).5 A majority of the fast-growing Hispanic counties (58%) are in Southern states. Georgia and North Carolina have more fast-growing Hispanic counties (51 each) than any other state.

IV. Hispanic Dispersion in the 1990s

During the 1990s, the Hispanic population increasingly resided in counties that had not been long-standing magnets for Latinos. The counties attracting Latinos in the 1990s are not identical to the 676 fast-growing Hispanic counties that have been attracting Latinos since 2000. Hispanic dispersion in the new century is more tilted toward metropolitan counties and counties in the West and Northeast.

From 1990 to 2000, the Hispanic population increased by 12.8 million (58%) in the 1,362 counties that had at least 1,000 Hispanics in 2007.1 In 681 counties, the Hispanic population grew by at least 90% during the 1990s, and we identify those counties as fast-growing Hispanic counties during the 1990s. Map 3 shows the counties attracting Hispanics at a rapid rate during the 1990s, and it is not identical to Map 2.

In the new century, 447 of the fastest-growing counties are metropolitan counties. In the 1990s, only 381 of the fastest-growing counties were metropolitan counties. In addition, a smaller share of the growth in the fast-growing counties during the 1990s was in metropolitan counties (89%) compared with the new century (94%) (Table 7).

Regionally, Hispanic growth since 2000 has shifted toward counties in the West and Northeast. The number of fast-growing Hispanic counties in the Northeast has increased from 24 counties in the 1990s to 54 counties in the new century. The share of Hispanic growth in the fast-growing areas has picked up in the Northeast from 3% in the 1990s to 6% in the new century (Table 8). Western counties accounted for 28% of the growth in fast-growing counties in the 1990s. The share of growth in fast-growing Hispanic counties among Western counties increased to 35% in the new century.

Though Hispanic dispersion has tilted more to counties in the West and Northeast in the new century, most counties that were fast-growing in the 1990s continued to experience above-average growth in the new century. There are 528 counties that were fast-growing Hispanic counties in both the 1990s and 2000s (Map 4). The share of the Hispanic population in these core growing counties steadily increased from 10% in 1990 to 17% in 2000 and then to 22% in 2007 (Figure 2). While each region of the country has counties that have steadily attracted Latinos, counties in the South are disproportionately among those that have steadily attracted Hispanics.

There are 148 counties where the Hispanic population grew slowly in the 1990s but above average in the new century (Map 5). The new fast-growing Hispanic counties are disproportionately in the Northeast. Several of the new fast-growing Hispanic counties are in Maine, Vermont and Massachusetts. California also has several fast-growing Hispanic counties in the new century, and Louisiana is notable for the number of its new fast-growing Hispanic counties.

Finally, there are 153 counties that had fast-growing Latino populations in the 1990s but have had below-average Latino population growth in the new century (Map 6). These counties are disproportionately in the Midwest. For example, Hispanic growth has cooled off in western Michigan, western Minnesota and western Kansas. Outside the Midwest, northern Nevada and central Washington were fast-growing in the 1990s but have experienced below-average Hispanic population growth in the new century.

V. The Growth of Hispanics and Non-Hispanics in the New Century

The 10 million increase in the Hispanic population nationwide since 2000 has been accompanied by an increase of 9.8 million non-Hispanics.7 The growth among Hispanics has been more widespread but also more concentrated in comparison to non-Hispanic growth.

Most counties experienced an increase in their Hispanic population in the new century. The Hispanic population increased in 1,295 of the 1,362 counties that had at least 1,000 Latinos in 2007. Not all counties experienced growing Latino populations, and Table 10 reports the counties with the largest Hispanic population declines.

Compared to the widespread Hispanic growth, fewer counties experienced an increase in their non-Hispanic population. In about one-third of counties (474 counties), the non-Hispanic population decreased from 2000 to 2007, so only 888 counties had increases in non-Hispanic population.

Though more counties have experienced Hispanic growth than non-Hispanic growth, Hispanic growth has been concentrated in fewer counties. Just 38 counties account for half of the nation’s Hispanic population increase. Non-Hispanics are less concentrated geographically, and their growth is less concentrated. Half of the nation’s non-Hispanic population increase occurred in 54 counties. This more widespread but concentrated growth continues the pattern that demographers observed in the 1990s (Kandel and Cromartie, 2004).

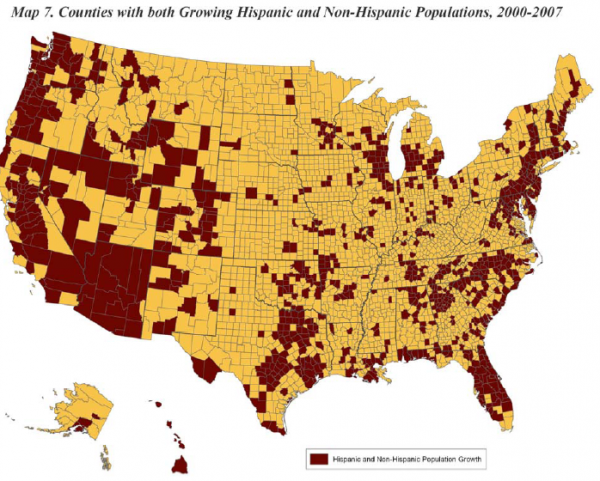
Most of the counties that experienced Hispanic population growth had an increase in their non-Hispanic population as well (Map 7). Some 867 counties had growing non-Hispanic populations as well as Hispanic populations. About two-thirds of these counties are metropolitan counties.

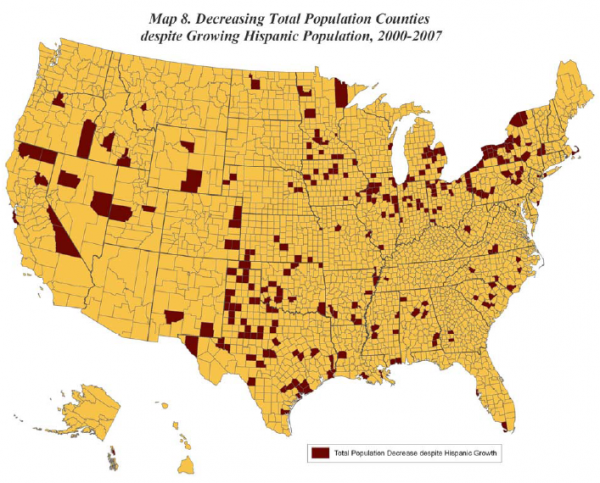
In about one-of-five counties, the total population declined despite an increase in Hispanic population (Map 8). About two-thirds of these 264 counties are non-metropolitan counties. Cook County, Illinois, the nation’s second most populous county (5.3 million residents) and the county that includes Chicago, lost population since 2000 despite a growing Hispanic population.

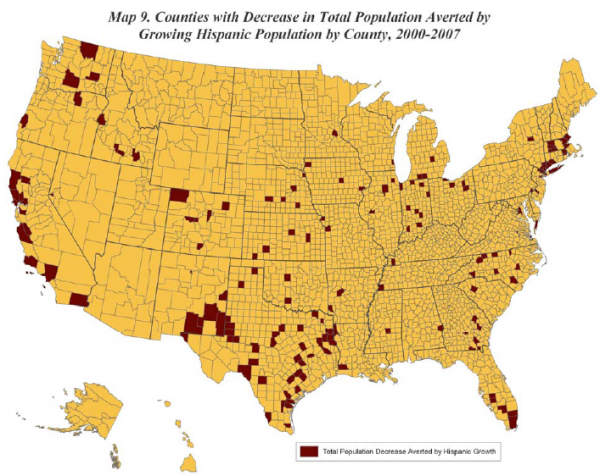
Finally, in 164 counties the total population would have declined since 2000 if the Hispanic population had not increased—in other words, the Hispanic population increase was greater in absolute value than the non-Hispanic population decline (Map 9). Counties in which Hispanic population gains averted total population decreases include some of the largest in the nation: Los Angeles; Miami-Dade; Dallas; Queens, Suffolk, Bronx and Westchester in the New York metropolitan area; Milwaukee; and DuPage in suburban Chicago.

Total Population Growth in the Fast-Growing Hispanic Counties

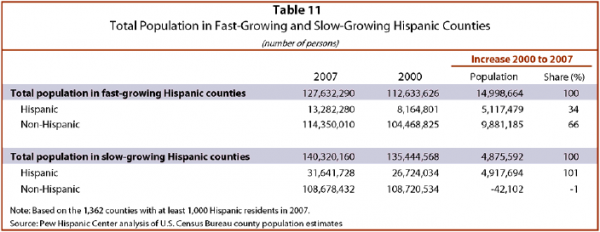
The 676 fast-growing Hispanic counties in the new century are largely metropolitan counties, and they tend to be counties with growing non-Latino populations as well. “More than ever, the new destinations for Hispanic populations overlap with growth centers for overall U.S. population” (Frey, 2006). In 567 of the 676 counties, the non-Hispanic population also increased since 2000. As Table 11 shows, the Hispanic population increased by 5.1 million in these counties in the new century. The Hispanic growth was accompanied by an increase of 9.9 million non-Latinos. Non-Hispanics as well as Hispanics are increasing in the nation’s fast-growing Hispanic counties.

By contrast, in the nation’s 686 slow-growing Hispanic counties, Hispanic growth has not been matched by accompanying non-Latino growth. In only 321 of these counties has the non-Hispanic population increased since 2000. Furthermore, in the aggregate, Hispanic population growth in these counties accounts for the entire population increase in these areas. Hispanic growth of 4.9 million Latinos in these counties was accompanied by a small decline in the non-Hispanic population.

VI. The Characteristics of Hispanics in the Fast-Growing Hispanic Counties

This last section of the report focuses on the characteristics of Hispanics in the fast-growing Hispanic counties. On the basis of the 2007 demographic profile, Hispanic populations in the fast-growing counties are markedly different than Hispanics in the established, slow-growing counties in some key ways but also resemble the wider Hispanic population in many others (Table 12).1

The fast-growing Hispanic county/county groups have many more adult male Hispanics relative to adult female Hispanics in comparison to the slow-growing areas. In the slow-growing Hispanic county/county groups, there were 104 adult male Hispanics for every 100 adult female Hispanics. In the fast-growing Hispanic counties, there were 120 adult male Latinos for every 100 adult female Latinos.

Mainly because of immigration from Mexico, Latinos in the new settlement areas are more likely to be foreign born than their counterparts in slow-growing county/county groups. Hispanics in the new settlement areas are also less likely to be U.S. citizens.

The age structure and social profile of Hispanics in the new settlement areas resembles that of slower-growing areas. In both areas, about one-third of the Hispanic population are children. About one-third of Latinos in both areas report speaking English with difficulty. Nearly four-out-of-ten Hispanic adults in both areas have not completed high school. About one-fifth of Hispanics in each area live in poverty.

Hispanics in the fast-growing county/county groups, on average, have very different characteristics than non-Hispanics residing in those same areas (Table 13). One-in-three Latinos in the new settlement areas are children, compared with one-in-four non-Hispanics. The non-Hispanic population is overwhelmingly native born and has citizenship. Fewer than one-in-ten non-Hispanics in the fast-growing areas reside in an immigrant-headed household, compared with six-in-ten Latinos.

The gender balance between Hispanics and non-Hispanics diverges considerably in the new settlement areas. Among the non-Hispanic population are 93 adult males for every 100 adult females. Among Hispanics, adult males outnumber adult females.

Non-Hispanics in the new settlement areas overwhelmingly report that they speak only English at home or speak English at least “very well.” A sizable minority of Latinos (35%) in these areas do not report these levels of English proficiency. Latino adults in the new settlement areas also trail their non-Hispanic counterparts in educational attainment. Nine-in-ten non-Hispanics have at least completed high school, compared with six-in-ten Hispanics. Likely reflecting in part their youth, lower English proficiency and formal education, Hispanics in the new settlement areas are nearly twice as likely as their non-Hispanic neighbors to live in poverty.

Appendix A: Data Sources

Sections 1 through 4 of the report analyze county Hispanic and total population counts from the U.S. Census Bureau. The 2007 counts refer to July 1, 2007, and are from the bureau’s county population estimates program (http://www.census.gov/popest/datasets.html). Population estimates are available for all 3,141 counties. The 1990 and 2000 county population counts derive from the decennial Census and refer to April 1 of the Census year. These are published in the decennial Census SF1 files and are obtained from the responses to the Census short form questionnaire. The short form responses are solicited from 100% of the resident population and not a sample of the population. For 2000 we used the April 1, 2000, counts in the base of the county population estimates program. These include small post-enumeration corrections from the SF1 figures.

Section 5 examines characteristics of the Hispanic and non-Hispanic population. The bureau’s county population estimates program cannot serve as the source for this analysis because it does not possess detailed population characteristics (only population aggregates). Detailed population characteristics at the county level can be obtained from the public use micro samples of the Decennial Census and the American Community Survey (ACS). The ACS is a sample of the resident population. Hispanic population information is not available for all 3,141 counties in the ACS.

Unfortunately, counties are not identified in the Census public use micro samples. The smallest level of geographic detail is the public use microdata area. PUMAs can be aggregated to form single counties or county groups. A further complication is that the PUMA definitions for the 1990 Census do not match the PUMA codes for the 2000 Census and 2007 ACS. See http://usa.ipums.org/usa-action/variableDescription.do?mnemonic=PUMA for further details. Using a PUMA-to-county crosswalk developed by Pew Hispanic Center senior demographer Jeffrey S. Passel, we are able to identify 608 county/county groups on a consistent basis in the 1990 5% IPUMS, 2000 5% IPUMS and the 2007 ACS Integrated Public Use Micro Sample.

The 608 county/county groups cover the entire United States. For the 585 county/county groups that have at least 1,000 Hispanics in 2007, the distribution of Hispanic growth in the new century mirrors the distribution of growth for the 1,362 counties using the Census Bureau population estimates. Again using the distinction between county/county groups in which the Hispanic population grew faster than the median county, we identify county/county groups as either fast-growing or slow-growing Hispanic county/county groups. The aggregate Hispanic population in the fast-growing and slow-growing county/county groups is nearly identical to the analysis using the 1,362 county population estimates.

Appendix B: Additional Table