Census reports do not identify changes in the incomes of foreign-born households by principal characteristics such as ethnicity or national origin. Because those characteristics are not included in the Census Bureau estimates, it is impossible to determine, from those reports, how the incomes of non-citizen Hispanic households or non-citizen Mexican households changed in 2007.
Therefore, the Pew Hispanic Center developed its own estimates of changes in the income of non-citizen households by principal characteristics using the same source data as the Census Bureau—the Current Population Survey. The Center’s estimates of changes in household income may differ from those reported by the Census Bureau because of differences in the sample of households and slight differences in methodology.11
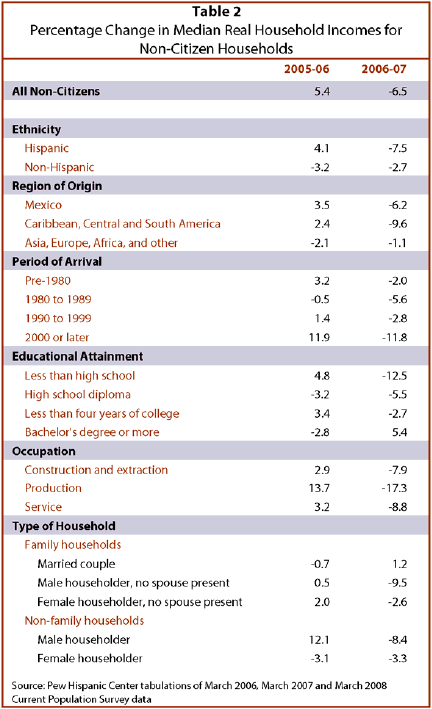
For example, the Center estimates that the median income of all non-citizen households decreased 6.5% from 2006 to 2007 (Table 2). That compares with the 7.3% reduction reported by the Census Bureau (Table 1). Similarly, the Center finds the median income of all non-citizen households increased 5.4% from 2005 to 2006 compared with the Census estimate of 4.1%. Although the estimates for each year are somewhat different, the two sets of estimates show very similar turnarounds in the economic fortune of non-citizen households.
The current economic slowdown is hurting Hispanic non-citizen households and households headed by immigrants from Mexico and Caribbean and Latin American countries more than it is hurting non-citizen households of other ethnic groups and origins. The median income of Hispanic non-citizen households fell 7.5% in 2007 compared with a loss of only 2.7% for non-citizen households that are not Hispanic. Differences also emerge across immigrants from different regions. Non-citizens from Mexico lost 6.2% and those from the Caribbean and other Latin American countries lost 9.6%, while non-citizens from Asia, Europe and other regions experienced a loss of only 1.1%. (See Appendix Table A2 for estimates of the median incomes of these households)
The time an immigrant has spent in the U.S. was also a factor in income declines. The incomes of the most recent immigrants (those who entered in 2000 or later) dropped by 11.8%, far in excess of the losses incurred by non-citizens who have been in the U.S. longer.
An immigrant’s education level is directly associated with losses in household income. The incomes of households led by non-citizens with less than a high school education dropped by 12.5%. Those with a high school education lost 5.5% of their incomes and those with some college education lost just 2.7% of their incomes. Meanwhile, incomes for college-educated non-citizen households increased 5.4%.
Reflecting this pattern of income losses for the least educated, non-citizens employed in production (-17.3%) and construction occupations (-7.9%) were among those whose incomes fell the most. Incomes of households led by non-citizens working in service occupations dropped 8.8%. Those three occupations employed nearly half (48.7%) of non-citizen household heads in 2008.
Households led by non-citizen males, either unmarried or with no spouse present, were at a clear disadvantage. Those households experienced the largest losses in incomes—9.5% for family households and 8.4% for non-family households headed by males.12 In contrast, the incomes of married couple households increased 1.2% from 2006 to 2007.
In sum, household incomes have fallen most for non-citizens who are Hispanic; from Mexico, other Latin American countries and the Caribbean; recently arrived; males, either unmarried or with no spouse present; lacking a high school education; and employed in construction, production or service occupations. Those characteristics of non-citizen households experiencing declines in income that are higher than average are also associated with likely undocumented status for the head of household.


