Pew Research Center

FOR RELEASE OCTOBER 5, 2006

The Changing Landscape of American Public Education: New Students, New Schools

Since the mid-1990s, two trends have transformed the landscape of American public education: Enrollment has increased because of the growth of the Hispanic population, and the number of schools has also increased.

FOR MEDIA OR OTHER INQUIRIES:

Communications Department
202.419.4372
www.pewresearch.org

RECOMMENDED CITATION

Pew Research Center, October 2006, "The Changing Landscape of American Public Education: New Students, New Schools"

About Pew Research Center

Pew Research Center is a nonpartisan, nonadvocacy fact tank that informs the public about the issues, attitudes and trends shaping the world. It does not take policy positions. The Center conducts public opinion polling, demographic research, computational social science research and other data-driven research. It studies politics and policy; news habits and media; the internet and technology; religion; race and ethnicity; international affairs; social, demographic and economic trends; science; research methodology and data science; and immigration and migration. Pew Research Center is a subsidiary of The Pew Charitable Trusts, its primary funder.

© Pew Research Center 2026

Table of contents

  • About Pew Research Center
  • The Changing Landscape of American Public Education: New Students, New Schools
  • II. Introduction
  • III. As Enrollment Grows, Schools Multiply
  • IV. A Sea Change in Primary Schools
  • V. Existing Schools versus New Schools
  • VI. New Settlements and Traditional Hispanic States
  • VII. Changes in Racial and Ethnic Composition
  • VIII. The Impact of Hispanics on Schools
  • Appendix A: Data Source
  • Appendix B: State and Hispanic Typology
  • Appendix C: Detailed National Data Tables
  • Appendix D: State Data Tables

The Changing Landscape of American Public Education: New Students, New Schools

Since the mid-1990s, two trends have transformed the landscape of American public education: Enrollment has increased because of the growth of the Hispanic population, and the number of schools has also increased.

I. Overview

Since the mid-1990s, two trends have transformed the landscape of American public education: Enrollment has increased because of the growth of the Hispanic population, and the number of schools has also increased. This report examines the intersection of those trends. Total public school enrollment in the United States peaked at 46.1 million in 1971 as the youngest members of the baby boom generation arrived in the nation’s classrooms. Enrollment gradually dropped off, to 39.2 million in fall 1984, then began to increase once again, reaching 48.2 million—a 23% jump—in fall 2002.

The number of public schools in operation followed the same historical trend. For most of the 20th century, the number of schools declined, first as the population became more concentrated in metropolitan areas and then through consolidation after the baby boomers finished high school. The number of public schools declined to a low of 81,147 elementary and secondary schools in 1984. As with enrollment, the number of schools rose dramatically in the subsequent two decades, reaching 93,869 in the fall of 2002—an increase of 16%.

Examining data for the decade of most concentrated change—between the 1993- 94 and 2002-03 school years— this report finds that Hispanics accounted for 64% of the students added to public school enrollment. Meanwhile, blacks accounted for 23% of the increase and Asians 11%. White enrollment declined by 1%.

During that same period, 15,368 schools, with an enrollment of 6.1 million in 2002-03, were opened. Nearly half, 2.5 million, of the students attending the new schools were white and meanwhile white enrollment in older schools dropped by 2.6 million. In contrast, about two-thirds of the increase in Latino enrollment was accommodated in older schools.

The analysis is based on the Common Core of Data, compiled each year by the U.S. Department of Education from state and local education agencies across the country. The CCD provides basic administrative data on all schools but does not include information on student achievement. Data from the 1993-94 and 2002-03 school years are analyzed here to provide a portrait of change across the 10-year period. The data analyzed are for 48 states and the District of Columbia (Tennessee and Idaho are excluded because the race/ethnicity data from those states are incomplete).

Assessing the changes in the racial and ethnic composition of school enrollment, this report finds that despite population change, white students continued to attend schools populated primarily by other whites and relatively few attended schools populated primarily by minorities.

The report also finds that a relatively small number of schools absorbed most of the increase in Hispanic enrollment and that those schools differ in important ways from schools less affected by Hispanic population growth. The schools that experienced the largest growth in Hispanic enrollment were generally larger, had more students on federal subsidies and also had greater teacher-student ratios— the latter an important indicator that has improved across the nation but not as significantly in Hispanic-impacted schools.

Among the major findings in this report:

  • Between the 1993-94 and 2002-03 school years, the total number of children enrolled in U.S. public schools increased by about 4.7 million, from 41.8 million to 46.6 million. That marked the most robust period of enrollment growth since the matriculation of the baby boomers.
  • Hispanics accounted for 3 million of those additional students, or 64% of the increase. The number of black students increased by 1.1 million, and the number of Asians grew by half a million. Meanwhile, white public school enrollment dropped by 35,000.
  • Between the 1993-94 and the 2002-03 school years, 15,368 schools, with an enrollment of 6.1 million in 2002-03, were opened. That is likely the most vigorous school construction period in the U.S. since the 1920s.
  • In 2002-03, about 1 million Latinos were enrolled in schools that had opened since 1993-94. Meanwhile, Latino enrollment in already existing schools increased by about 2.1 million. In other words, about two-thirds of the total Hispanic enrollment increase between 1993-94 and 2002-03 flowed into public schools that were already operating at the start of this period and about one-third of the increase went into new schools.
  • White enrollment in existing schools declined by 2.6 million students between 1993-94 and 2002-03. Meanwhile, 2.5 million white students were educated in new schools.
  • The changes are most striking in the nation’s elementary schools. During the period under study, Hispanic enrollment increased by 1.6 million and white enrollment declined by 1.2 million. Meanwhile, 6,500 new primary schools were opened. Of the 2 million students attending the new schools, nearly 1.1 million were white. At the same time, white enrollment in existing primary schools declined by 2.3 million students, or 17%. In contrast, nearly 70 percent of the Latino primary school enrollment increase was educated in existing schools.
  • Across all grades, new schools differ from existing schools in some key characteristics. They are smaller (396 total enrollment versus 545), and they have more affluent students (39% of the schools are eligible for Title I funds versus 60%).
  • After this decade of transformation, one fundamental characteristic remained essentially unchanged: A substantial majority of white students attended schools populated primarily by other whites, and relatively few attended schools populated primarily by minorities.
  • The share of white students attending predominantly white schools (where white enrollment exceeded 90%) dropped but remained substantial at 40%. The share attending schools that were more than half white increased, while the share attending schools where minority group students were a majority increased only slightly.
  • The growth in Hispanic enrollment was highly concentrated in a relatively small number of existing schools. One-fifth of those 74,200 schools absorbed two-thirds of the increased Hispanic enrollment.
  • The schools most affected by Hispanic enrollment increases grew in size by 25%, both in absolute numbers and on a percentage basis. Schools with less Hispanic growth, meanwhile, remained stable in size.
  • The share of poor students, as measured by eligibility for free lunch programs, rose from 34% to 43% in the schools most impacted by increases in Hispanic enrollment and from 31% to 34% elsewhere.
  • The decline in student-teacher ratios was slower in the schools most affected by Hispanic enrollment gains than in the rest of the nation’s schools.
  • Nationwide, the average share of white students in Hispanic-impacted schools decreased from 60% to 38%. Meanwhile, in all other schools the white share declined more modestly from 71% to 66%.

A Note on Terminology

The terms Hispanic and Latino are used interchangeably in this report.

The terms white, black and Asian refer to non-Hispanics.

II. Introduction

Total public school enrollment in the United States reached a peak of 46.1 million in 1971 as the youngest members of the baby boom generation arrived in the nation’s classrooms. Enrollment declined gradually to 39.2 million in fall 1984, then began to grow once again, increasing to 48.2 million—a 23% jump—by fall 2002.

The number of public schools followed the same historical trend. For most of the 20th century, the number declined, first as the population became more concentrated in metropolitan areas and then through consolidation after the baby boomers had graduated from high school. The number of public schools decreased to a low of 81,147 elementary and secondary schools in 1984. As with enrollment, the number of schools has increased dramatically in the subsequent two decades, reaching 93,869—an increase of 16%—in fall 2002.

This report examines the intersection of those two recent trends—the increase in school enrollment and the growth in the number of schools—which together have transformed U.S. public education over the past couple of decades. In particular, the report focuses on the rapid increase in the number of Hispanic students.

It examines where Hispanic students are concentrated, the kinds of schools they attend and changes in the schools that have experienced the most substantial Hispanic growth.

The increase in the total number of students has been driven primarily by one segment of the population: Hispanic students account for two of every three students added to U.S. public schools during the recent rise in enrollment.

As the number of schools increased in tandem with the higher enrollment, which students ended up in the newly created schools? While white enrollment decreased somewhat during the past two decades, a significant number of white students attended the new schools. Meanwhile, most of the increase in Hispanic enrollment was accommodated in existing schools.

The distribution of students in different types of schools is the result of many individual decisions by parents and school districts. It is the product of an array of factors, including changes in the U.S. economy and residential settlement patterns as well as both internal and international migration. Although the causes are too fragmented and complex to readily identify, changes in the nation’s educational landscape can be readily measured.

Every year, the National Center for Education Statistics of the U.S. Department of Education collects detailed administrative data on public schools from state and local education agencies. Compiled in the Common Core of Data, these data include information on school enrollment by race/ethnicity and other basic school characteristics such as instructional level, number of full-time teachers, the type of community in which the school is located and eligibility for federal Title I funds, which are given to schools with large shares of students from households below the federal poverty level. The CCD does not provide information on student achievement or on the quality of instruction, and so it does not permit an assessment of what goes on inside schools. Rather, it affords a look at the basic characteristics of students and schools. Because the universe for the data collection is all public schools, there are no sampling errors associated with the tabulations.

The starting point for this analysis is the 1993-94 school year (prior to that, several states did not provide school-level information to the CCD), and the end point is 2002-03. Basing this report on that period provides a comparison of a decade’s worth of change in public education. To have an “apples-to-apples” comparison of public school enrollment over time, two states are excluded— Tennessee, because it did not report the race/ethnicity of public school enrollment in 2002-03, and Idaho, which did not report racial/ethnic enrollment for its schools in 1993-94. Thus, the total school counts and enrollment statistics used throughout this report are for 48 states and the District of Columbia (see Appendix A for additional details on the enrollment tabulations).

This report uses the CCD to identify two kinds of schools: “New” schools are those that opened in the 1993-94 to 2002-03 period. There are about 15,400 of those schools in the Department of Education data analyzed here. An additional 74,200 fall into the category described here as “existing” schools—those that were already operating in 1993-94 and that were still operating in 2002-03. The CCD permits an assessment of the boom in school construction, which increased the number of public schools by 11.5% in those 10 years. The data also allow an analysis of the race and ethnicity of the students in 2002-03 who attended new schools versus those attending existing schools.

The growth of the Hispanic population has not occurred evenly across all parts of the country and across all age ranges. As such, the analysis examines the enrollment growth and the opening of new schools at various levels of instruction and in different geographic areas. The final section of the report examines the changes in schools that have experienced a significant increase in Hispanic enrollment.

III. As Enrollment Grows, Schools Multiply

In 1955, as the early baby boomers entered elementary school, the nation’s public school enrollment stood at 30.7 million. Sixteen years later, it peaked at 46.1 million. Then, as the boomers delayed or deferred childbearing, the school-age population began to decline, bottoming out at 39.2 million in 1984.

The enrollment numbers would have changed relatively little since the early 1980s if not for the growth of the Hispanic population. Between the 1993-94 and the 2002-03 school years, the total number of children enrolled in U.S. public schools increased by 4.7 million students, from 41.8 million to 46.6 million. Hispanics accounted for 3 million of those additional students, or 64% of the increase. The number of black students increased by 1.1 million and the number of Asians grew by half a million. Meanwhile, white public school enrollment dropped by 35,000.

The growth in enrollment was accompanied by a building boom in many public school systems. During the 10-year period, 15,368 schools were opened; their enrollment in 2002-03 was 6.1 million—more than the overall increase in enrollment of 4.7 million.1 The increase in the number of students and schools happened at the same time, but the new students did not necessarily flow into the new schools. While Hispanic students accounted for the greatest share of the growth in enrollment, they occupied a much smaller share of the seats in the new schools. While the number of white students was shrinking, white enrollment shifted significantly to the new schools.

In the 2002-03 school year, there were 89,599 public schools in the 48 states and the District of Columbia. Of those, 74,231 had been educating students in 1993- 94 and continuously since then. This report labels those schools “existing schools,” in contrast to the 15,368 “new schools” added since 1993-94. Although the total number of public schools in operation has been on the upswing since the 1984-85 school year, the 1993-94 to 2002-03 period is likely the most vigorous portion of the recent upswing in the opening of new schools.2

Historical statistics suggest this is probably the most productive period for opening new schools in America since before the 1920s. The number of public schools more than doubled from 1870 to 1900 and reached its peak of 271,319 schools in 1920. The number of elementary schools dwindled rapidly after 1920 and continued to decline until 1984. Since then, the number of elementary schools has increased by 13,000. The number of secondary schools has followed a different trend, but the recent increase in the number of secondary schools since 1992 appears to be the largest on record. By 2002, nearly 5,000 more secondary schools were in operation than in 1992.

Hispanic enrollment increased by about 3 million from 1993-94 to 2002-03. Of that increase, 2.1 million (Figure 4 and Appendix Table C1) attended existing public schools (5.3 million in 1993-94 versus 7.3 million in 2002-03). The remaining 1 million were being educated in new schools. Thus, about 68 percent of the total Hispanic enrollment increase over the 10-year period flowed into existing public schools and about one-third of the increase went into new schools.

While Hispanic enrollment in existing schools increased by nearly 40 percent, white enrollment in those schools fell by 10 percent. As noted above, the total number of white students in public schools changed little between 1993-94 and 2002-03. However, there was a significant shift between existing and new schools. White enrollment in existing schools plummeted by 2.6 million students from 1993-94 to 2002-03. Meanwhile, at the end of this decade 2.5 million white students were being educated in new schools.

A similar, though smaller, shift from existing schools to new ones occurred among black students. Total black enrollment increased by 1.1 million; 400,000 of those additional students, or 35% of the increase, attended existing public schools while nearly two-thirds went into new schools.

IV. A Sea Change in Primary Schools

The differences in the basic demographic trends for Hispanic and white students are most evident in primary schools, as are the differences in the distribution of students in existing and new schools. The changes evident in primary schools are particularly important because they portend the future of the nation’s public schools. As today’s primary school students grow older, the changes in their demographic makeup will be seen first in middle schools and then in high schools.

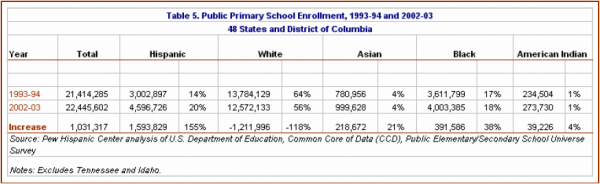
High rates of immigration in the 1980s and 1990s produced an influx of young Hispanic adults in their prime childbearing years, and those immigrants proved to be highly fertile (Durand, Telles and Flashman, 2006). As a result, Hispanic enrollment in the nation’s public primary schools increased from 3 million to 4.6 million—a jump of 53%—from 1993-94 to 2002-03. Meanwhile, as the baby boom generation passed its prime childbearing years, the number of white children entering primary school was declining. White primary school enrollment over that period dropped by 1.2 million, a decrease of 9%. The change in black enrollment in primary schools was more modest, increasing by 11%, or 392,000 students. Had it not been for the increase in Hispanic enrollment, the total number of students in primary schools would have declined by 560,000, or 3%.

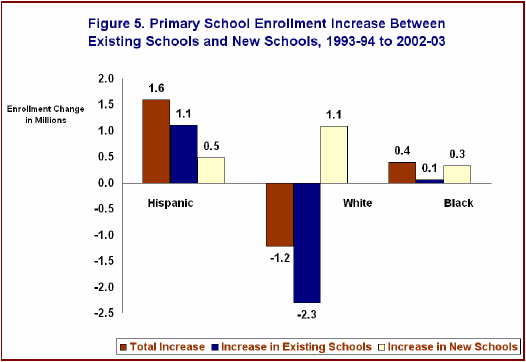
The growth in primary school enrollment, which was driven entirely by Hispanic students, was accompanied by an increase in the number of schools. A total of 6,500 primary schools enrolling about 2 million students were added between the 1993-94 and 2002-03 school years. During that time, the number of pupils attending existing schools declined by nearly 1 million. But the distribution of students among new and existing schools did not follow the underlying demographic pattern. Instead, there was a substantial shift of white students from existing schools to new ones.

Of the 2 million students in new schools, nearly 1.1 million were white. Meanwhile, white enrollment in existing primary schools declined by 2.3 million students, or 17%. Although Latinos accounted for all the increase in total primary school enrollment since 1993-94, they constituted only 24 percent of the increased enrollment at the new primary schools; nearly 70 percent were educated in existing schools even as the total number of students in those schools was declining.

In contrast, most of the 392,000 additional black students in primary schools attended new schools: 331,000, versus 61,000 enrolled at existing schools.

The decline in white primary school enrollment and increase in nonwhite primary school enrollment since 1993-94 have changed the racial/ethnic makeup of primary schools. As Table 5 reports, primary school enrollment in the 48 states and the District of Columbia was 64 percent white in 1993-94; by 2002-03, it was 56 percent white. The decline in the white share of enrollment is mostly due to the rise in the Hispanic share, which increased from 14% to 20% over the period. The black share of enrollment went from 17% to 18%.

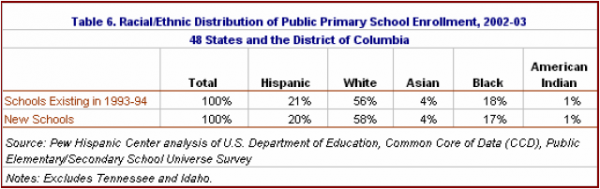
In 2002-03, the racial/ethnic composition of the nation’s new primary schools was different from the composition of the existing primary schools. The 6,500 new primary schools were 58% white in 2002-03; existing primary schools were 56% white. The comparison understates the difference in racial/ethnic composition between newly opened and existing schools because it does not account for the schools’ locations. New schools tended to be in the larger states where Latino enrollment was burgeoning and white children were a lower share of enrollment. An examination of new and existing primary schools in the same region or state shows that new primary schools had significantly greater white shares of enrollment than existing schools. For example, new primary schools in California were 41% white in 2002-03, while the existing schools were 30% white.

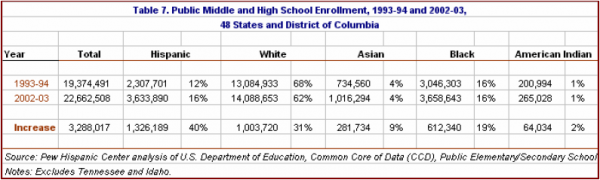
Hispanic enrollment also increased substantially in the nation’s middle and high schools from 1993-94 to 2002-03. But the addition of 1.3 million Hispanic students did not have as great an impact as in primary schools because white enrollment also increased by 1 million, reflecting the “Baby Boom Echo,” a burst of childbearing in the second half of the 1980s. Nonetheless, the growth rates are out of proportion. Hispanics contributed 40% of the growth in middle and high school enrollment from 1993-94 to 2002-03 but they accounted for only 12% of the students in 1993-94. Of the additional 1.3 million Hispanic students in middle and high schools over the same period, 920,000 (70%) were educated in existing middle and high schools. By comparison, of the additional 1 million white students, none of them was educated in existing schools. White enrollment in existing middle and high schools fell by 250,000.

V. Existing Schools versus New Schools

While ancillary to the primary purpose of the report, the Common Core of Data provides further information on the characteristics of new and existing public schools. Table 8 shows that new and existing schools in 2002-03 differed according to some key characteristics.1 On average, new schools tended to have lower enrollments. For example, in the 48 states and the District of Columbia the typical existing school had a total enrollment of 545 students, compared with 396 students at the typical new school. By several measures, new schools tended to have much more affluent student bodies than existing schools. Under the federal Elementary and Secondary Education Act, Title I funds tend to go to schools with higher concentrations of students from poor families. While 60% of existing schools were eligible for Title I funds, only 39% of new schools met the criteria. Under the National School Lunch Act, a student’s household income must be under 130% of the federal poverty level to qualify. In existing schools, 34% of students qualified for free lunches, compared with 30% of students at new schools.

VI. New Settlements and Traditional Hispanic States

Since the early 1980s and with increasing intensity in the past decade, geographic settlement patterns for the Latino population have been characterized by two trends: Even while Latinos have continued to concentrate in a handful of states where they have long been a major presence, other Latinos have dispersed to states where they are a new element of the population (Suro and Singer, 2002; Fischer and Tienda, 2006). In the traditional Hispanic states—so called because large shares of the Hispanic population have concentrated in them for many years—the impact has been measured in absolute numbers, while in the new settlement areas it has been measured in speed of growth.

In California, for instance, the Latino population grew by 3.3 million from 1990 to 2000, an increase of 43%. During that same period, the number of Hispanics in North Carolina increased by only 300,000, but that marked a growth of 392%. The same patterns are evident in school enrollment. However, there are important differences in how traditional Hispanic states and new settlement states handled the relationship between enrollment growth and the creation of new schools. In sum, traditional Hispanic states were more likely than new settlement states to educate Hispanic students in new schools.

For the purposes of this report, six states—California, Texas, Florida, Arizona, Illinois and New York—have been categorized as traditional Hispanic states. With 4.3 million Latino public school students in 1993-94, they accounted for 80 percent of all Hispanic enrollment. Over the next decade, the number of Latino students in those states increased by 2.1 million, or 48%. Public schools in traditional Hispanic states educated 76% of Latino students in 2002-03. Meanwhile, white enrollment in those states increased by 2,000, a statistically insignificant amount. Overall enrollment in the six states increased by 2.7 million, or 17%, and was accompanied by the creation of 6,732 schools, an increase of 20%.

Ten states—North Carolina, Georgia, Virginia, Maryland, Nevada, Utah, Oregon, Oklahoma, Indiana and Kansas—are categorized as new settlement states. Those states had only 233,000 Hispanic students in 1993-94. Over the next decade, Latino enrollment increased by 181%. However, because it started from such a small base, the Latino total of 653,000 students in 2002-03 amounted to just 8% of the total Hispanic enrollment nationwide. Meanwhile, white enrollment increased by 50,000, or 1%. Overall enrollment in these states increased by 980,000, or 13%, and was accompanied by the opening of 2,286 new schools, an increase of 8%.

School districts in new settlement states were less likely than districts in traditional Hispanic states to open new schools as enrollment increased. In the new settlement states, the addition of 980,000 students was accompanied by the opening of 2,286 new schools. Another way of putting it is that those states added schools at a rate of 2,342 schools per 1 million additional students. In the traditional Hispanic states, each additional 1 million students generated 2,4544 new schools.

In both the traditional Hispanic and new settlement states, white enrollment in new schools increased while declining in existing ones. However, enrollment patterns for Hispanics differed. Traditional Hispanic states were more likely than new settlement states to educate additional Hispanic students in new schools (Table 11). Of a total increase in Hispanic enrollment of 2.1 million in the traditional Hispanic states, 37% of the additional students (762,000) attended new schools. Of a total increase in Hispanic enrollment of 420,000 in the new settlement states, 20% of the additional students (84,000) attended new schools.

VII. Changes in Racial and Ethnic Composition

The two simultaneous developments in school enrollment described above—rapid increases in the number of Hispanic students and the decline in the number of white students—potentially constituted a significant shift in the racial and ethnic composition of American public schools. Using various approaches, researchers have come to fundamentally different conclusions about how the population change was reflected in the actual racial/ethnic makeup of schools. Gary Orfield, co-director of the Harvard Civil Rights Project, concluded that segregation intensified over the 1990s (Orfield, 2001). John R. Logan, a sociologist at Brown University, observed that the trend toward lower levels of school segregation, evident since the late 1960s, halted in 1990 but did not reverse (Logan, 2004).

This analysis finds that the combination of changes in enrollment and the opening of new schools had some notable effects on racial composition when examined in terms of the kinds of schools attended by white students. However, after a decade of change, one fundamental characteristic essentially remained: A substantial majority of white students attended schools populated primarily by other whites, and relatively few attended schools populated primarily by minorities. This analysis is not meant to resolve the debate over the trend in segregation; rather, it offers another perspective on changes in enrollment composition, examining trends in terms of two variables: the growth of the Hispanic population and the opening of new schools.

Some change in racial/ethnic distribution was inevitable simply as a result of the change in the student population. From 1993-94 to 2002-03, the number of white students declined slightly (35,000) while the number of Hispanics and other minorities increased by nearly 4.8 million. As a result, the white share of total enrollment decreased from 66% to 59%.

This analysis uses three common measures of racial distribution. One is the share of white students who attend schools that are predominantly white, defined here as having white enrollment of at least 90%. Another measure is the share of white students attending schools that are largely white, defined here as those with enrollments that are 50% to 90% white. Finally, racial composition can also be measured in terms of minority/majority schools, where minority students constitute a majority of the student body. Examining those measures on a national or regional basis offers a generalized look at broad trends, and it is important to keep in mind that racial/ethnic composition can vary significantly among schools within a single community. Much of the empirical literature on trends in school segregation examines school enrollment at the school district or metropolitan area level. Trends at the state or regional level don’t necessarily apply to smaller areas. Again, the purpose of this report is not to weigh in on the debate on school segregation trends but to understand how enrollment patterns in new schools compare to the distribution of enrollment in existing schools.

As a result of the changes in school enrollment nationwide, there were fewer white students both in numbers and—even more so—as a share of enrollment of schools that were disproportionately white. In 1993-94, nearly half of all white public school students (49%) attended schools that were predominantly white, and over the 10-year period, that share declined predictably. Nonetheless, in 2002-03 four of every 10 white students (40%) attended schools whose enrollments were at least 90% white. Most of the change was absorbed by schools that were largely white, as the share of white students in that category increased from 41% to 48%. As the share of minorities in the schools increased rapidly, the number of white students attending majority/minority schools increased only modestly, from 9% to 12%. In other words, after a decade of extensive change in the educational landscape, the great majority of white students still attended schools where other whites were by far the largest presence and four of every 10 attended schools where whites predominated.

Although minorities, particularly Hispanics, accounted for all of the enrollment growth in this period, the same basic pattern held for the new schools. In the new schools, a smaller, though still substantial, share of whites attended predominantly white schools. Of white students in new schools, 55% attended schools that were largely white, compared with 47% of those in existing schools. There was no difference in the share of whites enrolled in majority/minority schools (12%).

This basic trend held true in areas of the country that experienced the largest shifts in enrollment measured in absolute numbers. In the six traditional Hispanic states, whites constituted 52% of all school enrollment in 1993-94; by 2002-03, their share had fallen to 44%. White students, in effect, became the minority, but relatively few attended schools that reflected that demographic change. In those states, 21% of whites attended predominantly white schools in 2002-03 and 57% attended largely white schools. Thus, 78% of white students attended schools that were disproportionately white. The share was even somewhat higher—80%—in the new schools in those states.

In the 10 new settlement states, the white share of total enrollment declined from 72% in 1993-94 to 64% by 2002-03. The proportion of whites attending predominantly white schools fell from 45% in 1993-94 to 32% in 2002-03. Few additional whites attended majority/minority schools in these states, as the change was largely absorbed in largely white schools. Largely white schools educated 56% of whites in 2002-03, up from 48% in 1993-94. The share of whites at majority/minority schools remained modest at 11%, and whites in new schools in new settlement states were even less likely to attend majority/minority schools.

Primary schools are another category of schools that experienced substantial changes in their racial/ethnic composition. In the nation’s primary schools, whites constituted 64% of all students in 1993-94 and 56% in 2002-03. As noted above, Hispanic enrollment in primary schools increased by 1.6 million while white enrollment dropped by 1.2 million. The share of whites attending predominantly white schools dropped from 50% to 40%, but the share attending majority/minority schools increased only from 9% to 13% and was even lower (11%) in new schools. Again, most of the demographic change was absorbed in largely white schools.

Finally, consider the case of primary schools in traditional settlement areas where white enrollment declined from 50% to 41%. In 1993-94, 83% of whites attended schools that were at least half white (29% in predominantly white schools and 55% in largely white schools). In 2002-03, more than three-quarters of white students (78%) still attended schools that were more than half white (21% in predominantly white schools and 57% in largely white schools). In new schools, an even higher share (81%) attended schools that were at least half white.

VIII. The Impact of Hispanics on Schools

So far this report has focused on the school construction boom and the ways it relates to the growth of the Hispanic population. The following section focuses on the schools most affected by growth in the number of Hispanic students. This analysis examines how many schools, and which ones, experienced the greatest impact and how the characteristics of those schools differ from the rest.

As noted above, the Hispanic population remains substantially concentrated in a few traditional states even as it has begun to disperse to new settlement areas. And, within both traditional and new settlement states, the Latino population remains substantially concentrated geographically by neighborhood (Suro and Tafoya, 2004). Given that Hispanic enrollment is heavily concentrated in a relatively small set of schools, it is perhaps not surprising that the increases in Hispanic enrollment have also been relatively concentrated. As a result, the schools that were most affected by growth in Hispanic enrollment tended to be schools that already had large numbers of Latino students.

Concentrated Impact

The concentrated impact of Hispanic enrollment growth is most clearly illustrated by examining the 74,200 existing schools—those that were operating continuously since at least 1993-94. One-fifth of those schools absorbed twothirds (66%) of the Hispanic enrollment growth. Just one-tenth of the existing schools, 7,398 schools, handled half (52%) of the increase. In 1993-94, those 7,398 schools enrolled 2.1 million Hispanic students, or 40% of the total. By 2002-03, those same schools had more than 3.7 million Hispanic students, which was 44% of all the Latinos in U.S. public schools. In sum, as Hispanic enrollment grew quickly, most of the new students flowed into a relatively small number of schools that already were educating a sizable share of Latino students.

However, as noted above, Hispanic population growth has been characterized by both concentration and dispersal. So even as half of the increase in Latino enrollment was concentrated in one-tenth of the existing schools, the other half was scattered across both existing and new schools. As a result, many schools that had very few Latino students at the beginning of the period under study experienced an influx. Because they started from a small base, even modest increases in the absolute number of Latino students produced very dramatic gains on a percentage basis. So, for example, at one-fifth of the nation’s existing schools the Hispanic enrollment at least tripled, but again in most cases those percentage gains involved relatively small numbers of new students.

Measuring the Impact of Hispanic Enrollment Growth

If schools across the country experienced the growth of the Hispanic student population in many different ways in terms of absolute numbers and percentage gains, how does one identify the schools most affected by that growth and measure the impact of the population change? There are, of course, many methodological possibilities. This analysis focuses on schools that experienced gains in Hispanic enrollment both in absolute numbers and on a percentage basis.

To identify schools that can be identified as having been heavily impacted by Hispanic enrollment growth, the following analysis first eliminated the tens of thousands of schools that gained fewer than 100 Latinos. In addition, the analysis considered only schools whose Hispanic enrollment rose by at least 100%. By setting a threshold of schools that at least doubled their Hispanic enrollment, the analysis sets aside many large schools that already had substantial numbers of Latinos enrolled and where the addition of 100 or more would not have an inordinate impact.

This double-edged criterion—an increase of at least 100 Hispanic students and at least a 100% increase in enrollment—produces a category of schools that will be referred to as “Hispanic-impacted” schools. Of the nation’s 74,200 existing schools, 3,369, or about 5%, fall into this category. All other schools are referred to as “small Hispanic increase” schools. Because this analysis measures change in enrollment across a 10-year period, it necessarily excludes the 15,000 new schools in 2002-03 and deals only with the existing schools, which educate 87% of all students.

In 2002-03, a total of 3.3 million students attended Hispanic-impacted schools and 37 million attended small Hispanic increase schools. So a relatively small share of students—8.2% of the enrollment in existing schools—attended schools most affected by the growth of Hispanic enrollment.

It is important to emphasize that this criterion is not meant to identify the schools that were most heavily Hispanic but rather those that experienced the greatest impact from Hispanic growth. Nationwide, Latinos accounted for 34% of the students in Hispanic-impacted schools while they made up 18% of enrollment in all schools. Thus, while Hispanics did not make up a majority of the students in Hispanic-impacted schools on average, those schools were disproportionately Hispanic. Meanwhile, whites were somewhat underrepresented in Hispanic-impacted schools, making up 42% of enrollment in those schools compared with 59% of enrollment in all schools.

Not surprisingly, the Hispanic-impacted schools are concentrated in traditional Hispanic states because that is where the bulk of the Hispanic population resides. Of the 3,369 Hispanic-impacted schools, nearly 1,900 are in the six traditional Hispanic states. They enrolled nearly 2 million students, or 12% of the total enrollment in existing schools in those states. In new settlement states, the 825 Hispanic-impacted schools enroll a similar share of total enrollment in existing schools (11%), but a much larger share of Latino students (38%). Nationwide, 6% of white students attended Hispanic-impacted schools. The share of white students at those schools was somewhat higher in traditional settlement states (11%) than in new settlement states (8%) (See Appendix Table C15).

Characteristics of Hispanic-Impacted Schools

Public schools that experienced significant growth in the Latino population also experienced adverse changes. By 2002-03, Hispanic-impacted schools were generally larger, had more students on federal subsidies and had larger teacher-student ratios—the latter an important indicator that has improved across the nation but not as significantly in Hispanic-impacted schools.

The most obvious difference between the schools most affected by Hispanic growth is that the Hispanic-impacted schools as a whole added significantly to their enrollment (674,000) while small Hispanic increase schools experienced declining enrollment (430,000) (see Appendix Table C14). While this increased enrollment was packed into the relatively small number of Hispanic-impacted schools (3,400), the decrease was spread out among the much larger number of small Hispanic increase schools (71,000). As a result, school size increased in the schools most affected by the Hispanic enrollment gains while remaining stable elsewhere.

Nationwide, the average size of Hispanic-impacted schools increased from 787 students to 987, or 25%, while the size of small Hispanic increase schools changed only slightly, from 531 students to 524. The effects were most noticeable in states with the largest Hispanic populations. In traditional Hispanic states, the average size of Hispanic-impacted schools increased from 807 students in 1993- 94 to 1,053 students in 2002-03, a jump of 30%. Those with a smaller increase in Hispanic enrollment remained stable at about 638 students. In new settlement states, Hispanic-impacted schools increased on average from 823 students to 954. Existing schools in new settlement states that had less Hispanic growth remained stable at about 525 students. A growing body of research literature indicates that larger school size, especially at the secondary level, is associated with less favorable student attainment (Fry, 2005).

As noted above, the share of students in a school that is eligible for the federally funded free lunch program is an important measure of students’ economic status. The average proportion of a school’s students eligible for the free lunch program rose at existing schools from 1993-94 to 2002-03. The increase was markedly greater at Hispanic-impacted schools than at schools with a small increase in Hispanic enrollment (Figure 7). In traditional Hispanic states, the average proportion of students at Hispanic-impacted schools who were eligible for free lunches rose from 36% to 42%. The schools with a small increase in Hispanic enrollment on average experienced a small decline in free lunch eligibility. A substantially greater increase in free lunch eligibility at Hispanic-impacted schools in comparison to small Hispanic increase schools is also observed in new settlement states.

The trend in public education since 1993-94 has been for the typical number of students per teacher to decline (Figure 8). Among existing schools, the student-teacher ratio has declined. The decline has been steeper at schools with a smaller increase in Hispanic enrollment than at Hispanic-impacted schools.

Hispanic-impacted schools, aside from being larger and poorer, underwent a significant change in their ethnic and racial composition. Those schools became less white than schools that did not experience a surge in Latino enrollment.

This analysis has shown that as the number of white students in the nation’s public schools declined, the number of schools that are predominantly white also declined somewhat. The decline, however, was not evenly distributed. Hispanic-impacted schools experienced not only substantial gains in enrollment because of an influx of Latinos, but also larger declines in the percentage of white students than schools less affected by Hispanic enrollment increases. Thus, in the most affected schools, as overall enrollment increased the share of Hispanics went up and the share of whites went down. Meanwhile, in the vast majority of schools, enrollment declined while there was a much lesser change in the mix of Hispanic and white students.

Nationwide, the average share of white students in Hispanic-impacted schools decreased from 60% to 38%. Meanwhile, in all other schools the white share declined more modestly, from 71% to 66%. The trend was most evident in new settlement states, where white enrollment in Hispanic-impacted schools decreased from 65% to 41%. By comparison, the white share in schools that did not have a significant increase in Hispanic enrollment declined from 74% to 68%. The same pattern was evident in traditional Hispanic states.

School segregation can be measured a variety of ways. This analysis uses a very widely known measure of segregation known as the exposure index. The exposure index tallied is the Hispanic-white exposure index, which measures the white share of enrollment at the school that the average Hispanic student attends. For the nation as a whole, school segregation for Hispanic children modestly increased over the 1990s, in the sense that the average Hispanic student’s exposure to white children declined (Logan, 2002; NCES, 1999).

In this analysis, looking at all schools nationwide, the average Hispanic attended a school that was 31% white in 1993-94 and 28% white in 2002-03. The decline in exposure to whites was much steeper in Hispanic-impacted schools (from 51% to 32%) than in the schools that had a small increase in Hispanic enrollment (29% to 26%).5 By this measure, segregation increased more in the Hispanic-impacted schools than in the schools that had a small increase in Hispanic enrollment.

In the traditional Hispanic states, exposure to white students dropped steeply in Hispanic-impacted schools, as the share of whites in the school attended by the average Latino declined from 48% to 29%. Meanwhile, in schools with smaller increases in Hispanic enrollment, exposure to white students fell only from 25% to 21%. The new settlement states showed a similar pattern in which the share of whites in the school attended by a Latino student fell from 59% to 37% in Hispanic-impacted schools and from 64% to 56% in the small Hispanic increase schools.

Appendix A: Data Source

The enrollment tabulations are based on the U.S. Department of Education’s “Public Elementary/Secondary School Universe Survey” for school years 1993-94 and 2002-03. The latter year is the most recent available. Not all states report student enrollment by race/ethnicity. The number of states not reporting racial/ethnic counts increases in earlier school years. The 1993-94 school year is the earliest school year for which the missing data problems are manageable.

Not all public schools are included in the analysis. Using the 2002-03 school year to illustrate, the Public Elementary/Secondary School Universe Survey indicates that there are 97,531 public schools in operation in the 50 states and the District of Columbia in fall 2002. Of those, 92,330 schools reported students in attendance. Tennessee did not report student enrollment by race/ethnicity for the 2002-03 school year. Idaho did not report such data for 1993-94. To have an “apples-toapples” comparison over time, schools in Idaho and Tennessee are excluded, reducing the number of schools to 89,671. Finally, eliminating schools with missing racial/ethnic counts further reduces the 2002-03 school count to 89,599.

A school’s total enrollment can be measured two ways. The reported total student enrollment, MEMBER, can be used. Alternatively, the sum of the students by race/ethnicity groups may be used. For some schools the latter count is less than the MEMBER count. This report tallies school enrollment using the sum across the racial/ethnic groups. In the aggregate, it makes little difference. As the following table shows, for both years the difference in total student enrollment is quite small:

Appendix B: State and Hispanic Typology

Many demographic analysts classify the growth and dispersal of Hispanics and immigrants into the three-way split of traditional receiving states, new destination states, and other states (e.g., Suro and Tafoya, 2004; Fix and Passel, 2003; and Bump, Lowell and Pettersen, 2005). This paper’s typology is based on the level and growth of Hispanic public school enrollment, rather than the entire Hispanic population. Appendix Table B1 reports the 1993-94 level of Hispanic school enrollment and the absolute and percentage increase in enrollment for 48 states and the District of Columbia. The bulk of the increase in Hispanic enrollments (69%) occurred in the six traditional Hispanic states: California, Texas, Florida, Arizona, Illinois and New York. Hispanic enrollment increased by more than 100,000 students over the period in these states, and each educated more than 300,000 Latinos in the 2002-03 school year.

Not surprisingly, many states experienced triple-digit growth in their Hispanic school enrollment. However, some of the states with very large percentage increases in Hispanic enrollment (such as Alabama and Kentucky) had few Hispanic students in absolute number in either 1993-94 or 2002-03. The criterion to be a “new settlement state” is based on both percentage growth as well as absolute increase in Hispanic enrollment. The 10 new settlement states at least doubled their enrollment of Hispanic students. In absolute terms, half of the 48 states and the District of Columbia enrolled an additional 22,000 Latino students from 1993-94 to 2002-03 (or the median state increase is 22,000 students). New settlement states doubled their Hispanic enrollment and had an enrollment increase in excess of the median enrollment increase. The 10 new settlement states are not strictly confined to the Southeast and include fast-growing states in the west (Oregon, Nevada and Utah) and in the heartland (Oklahoma, Indiana and Kansas). By construction, public schools in the “new settlement states” need to educate significantly greater numbers of Latino students and prior to the 1990s they had little experience educating Latinos.

Appendix C: Detailed National Data Tables

Appendix D: State Data Tables