Reflecting broad changes in their social and economic status, women around the world have been migrating more in recent decades and as a result have constituted an increasing share of migrant populations almost everywhere.
About Pew Research Center
Pew Research Center is a nonpartisan, nonadvocacy fact tank that informs the public about the issues, attitudes and trends shaping the world. It does not take policy positions. The Center conducts public opinion polling, demographic research, computational social science research and other data-driven research. It studies politics and policy; news habits and media; the internet and technology; religion; race and ethnicity; international affairs; social, demographic and economic trends; science; research methodology and data science; and immigration and migration. Pew Research Center is a subsidiary of The Pew Charitable Trusts, its primary funder.
Reflecting broad changes in their social and economic status, women around the world have been migrating more in recent decades and as a result have constituted an increasing share of migrant populations almost everywhere.
I. Overview
Reflecting broad changes in their social and economic status, women around the world have been migrating more in recent decades and as a result have constituted an increasing share of migrant populations almost everywhere. But the U.S. has defied this global trend, according to a Pew Hispanic Center analysis of data from the U.S. Census Bureau and the United Nations. Women have made up ever larger shares of legal immigrants to the United States in recent years, as they have elsewhere. However, an increasing flow of mostly-male unauthorized migrants1 has more than counterbalanced the feminization of legal migration, making the U.S. the only industrialized country where the percentage of female migrants has declined over the past 25 years.
Worldwide, the percentage of female migrants has risen from 47.2 in 1980 to 49.6 in 2005, according to the United Nations. In the United States, however, the share of female migrants declined from 53.2% in 1980 to 50.2% in 2005 (Figure 1).
Migration to the U.S. is an exception to the global trend towards greater feminization because the unauthorized flow is both more male and, of late, larger than the legal flow. Since the mid-1990s the number of unauthorized migrants added to the U.S. population each year has outpaced the number of legal permanent immigrants (Passel and Suro, 2005). And, in marked contrast to the legal migration, men outnumber women in the unauthorized population.
Gender composition is thus a marker of the unique nature of current migration to the United States. It demonstrates the extent to which migration to the U.S. is distinguished by a large and steady flow of males who enter the country and live and work outside the framework of the legal immigration system. No other industrialized country has experienced the same trend in the gender composition of its foreign-born population, and none has added to its foreign-born population as much through the flow of unauthorized male workers.
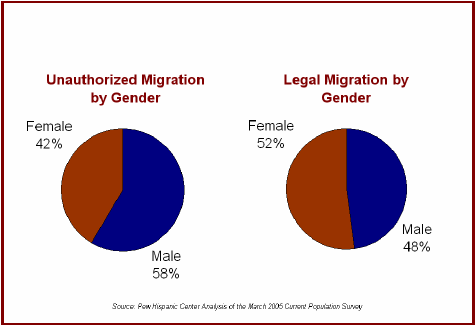
A Pew Hispanic Center analysis of the March 2005 Current Population Survey shows that of an estimated 11.1 million unauthorized migrants, 58% of the adults were male while 42% were female (Passel 2006). In contrast, females accounted for 52% of the adult legal migrant population in 2005.
Another insight on the gender composition of legal immigration comes from administrative data collected by the Department of Homeland Security .Women accounted for 54% of all immigrants granted admission to the U.S. in 2004 as legal permanent residents or “green card” holders.
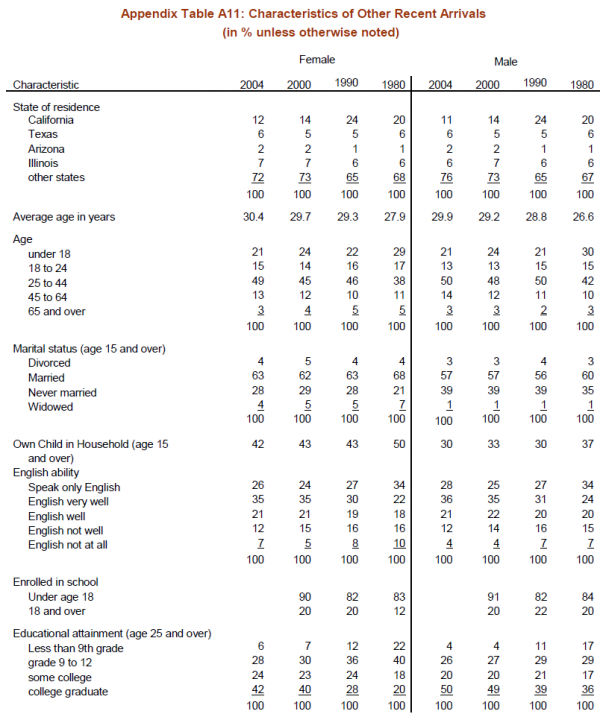
Finally, an analysis of data gathered over the past quarter century also shows that the profile of recently-arrived female immigrant to the United States has changed considerably. In 2004, female newcomers were better educated, older and less likely to have children than recently-arrived female migrants in 1980.
This Pew Hispanic Center report uses data from the decennial census of 1980, 1990, and 2000, as well as the 2004 American Community Survey, to examine changing gender patterns in international migration to the U.S. The analysis makes extensive use of data that establishes an immigrant’s year of entry into the United States. Special attention is paid to Mexico, the largest single source of migrants.
About this Report
This Pew Hispanic Center report uses data from the decennial census of 1980, 1990, and 2000, as well as the 2004 American Community Survey, to assess changing patterns of international migration to the U.S. as regards to gender. The analysis examines migration flows by making extensive use of data that establishes an immigrant’s year of entry into the United States. Special attention is paid to Mexico, the largest single source of migrants.
A Note on Terminology
The terms Hispanic and Latino are used interchangeably in this report.
II. Migration and Gender
The foreign-born population in the United States increased by more than 20 million in the last three decades, a surge driven primarily by the large-scale migration from Latin America and Asia.
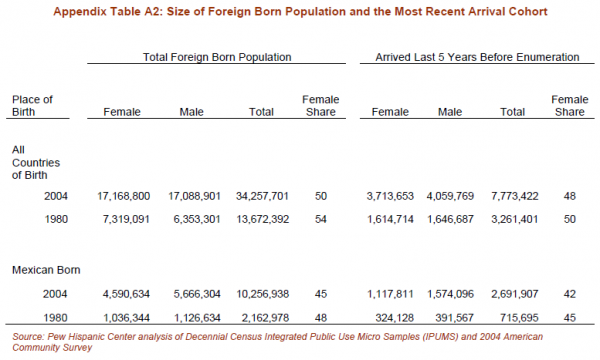
Women played an important part in this wave of migration, which is still ongoing. The number of female migrants more than doubled from 1980 to 2004, increasing from 7.3 million to 17.2 million.
The question is whether the increase in the number of female migrants has changed the gender composition of the foreign-born population. In fact, as the female migration to the U.S. was growing, male migration increased at an even greater pace during these years, almost tripling between 1980 and 2004 (from 6.4 million to 17.1 million). As a result, the female share of the migration decreased from 54% in 1980 to 50% in 2004 (Appendix Table A2).
To understand how gender composition has evolved during a time of increasing migration, this analysis examines the flow of migration—the number of foreign-born persons coming into the U.S. in a given time period—as well as the stock of foreign born—the absolute number of foreign-born persons in the U.S. population at a given moment.
Migration Flow: The number of foreign-born persons coming into the U.S. over a given time period.
Information on the migration flow is derived from a question on the Decennial Census long form and the ACS that asks when a foreign-born person entered the U.S. Most of this analysis focuses on individuals who said they had entered the U.S. in the five years before they were enumerated. So, for example, from the 2000 Census the analysis focuses on people who entered the country between 1995 and 2000. For the sake of simplicity, immigrants in the country for five years or less are referred to here as recent immigrants.
Migration Stock: The absolute number of foreign-born persons in the U.S. population at a given moment.
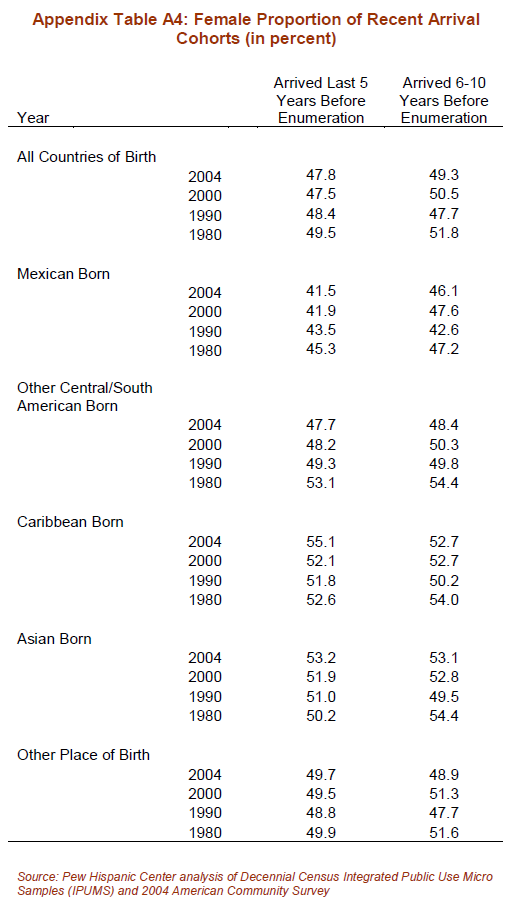
Census Bureau data shows that while the absolute number of female migrants has increased, the proportion of the migration flow that is female has declined slightly. In the 1980 Census, 1.6 million foreign-born females reported having migrated to the United States in the previous five years, compared with 3.7 million in 2004. The increase in the number of males, however, was just as substantial (Figure 2). As a result, the proportion of females among recent immigrants declined from about 50% in 1980 to about 48% in 2004. Although this is a relatively small change, it is moving in the opposite direction of the change in gender composition evident worldwide during the same time period.
Female Migration Worldwide
Worldwide, the stock of female migrants has been increasing slowly but steadily, rising from 41 million in 1975 to 95 million in 2005, according to tabulations by the United Nations. Along the way, the percentage of females in the worldwide migrant population rose from 47.4% in 1975 to 49.6% in 2005.
The growing role of women in migration is attributed to several factors, among them the on-going transformation of the agricultural sector and the global competition for goods and services, which has profoundly altered the labor market. In addition to these economic factors, changes in gender relations within families are believed to spur migration as women seek greater control over their mobility and standard of living.
The United Nations data on migrant stock indicates that the percentage of female migrants has increased since 1975 in all but two regions of the world: Asia and North America (Table 1). The most significant increase took place in Europe, where the percentage of female migrants rose from 47.7 in 1975 to 53.4% in 2005. Africa and Oceania, which includes Australia and New Zealand, also saw increases of about 4% over the same time period.
The United Nations subdivides Asia into four regions: Eastern, South-central, South-eastern and Western. The percentage of female migrants increased in all but Western Asia, which includes most of the countries in the Middle East as well as Turkey. In all the other sub-divisions, the share of female migrants increased.
In Northern America, as the UN classifies the continent, the most significant changes occurred in the two largest countries: the United States and Canada. In Canada, the percentage of female migrants increased from 49.9% in 1975 to 52% in 2005. In the United States, meanwhile, the percentage of female migrants decreased from 52.7 to 50.2.
Legal vs. Illegal Migration
Studies that have examined the gender composition of legal immigrant inflows, a population that includes legal permanent residents, refugees and those seeking asylum, show that females very often comprise a majority of arrivals. As significantly, these studies show that females have historically dominated legal immigration.
From 1930 to 1979, females accounted for 55% of all legal admissions to the United States (Houstoun, Kramer, and Barrett, 1984). More recently, females have been less than a majority of legal admissions in some years but that began to change in 1990. Since then, a rising share of legal admissions has been female (Zhou, 2002). This conclusion is based on an analysis of those who were granted legal permanent residency and included refugees and those who received asylum. In fiscal year 1985, females accounted for 49.8% of legal admissions. That dipped to 46.7% in 1990 and then rose to 53.7% in 1995 and 55.4% in fiscal year 2000.
The number of legal admissions jumped significantly during this time period as a result of the Immigration Reform and Control Act (IRCA), a 1986 law that offered amnesty to approximately 3 million unauthorized migrants. By the late 1980s and early 1990s, these now legalized migrants were able to sponsor family members who were then permitted to enter legally. Total legal immigration increased from about 600,000 in 1988 to 1.8 million in 1991 as the IRCA beneficiaries were processed.
Since 1990, a rising share of legal admissions to the U.S. has been female.
The trend toward more female legal migrants that began in 1990, however, has been countered by another significant change in the overall migrant population. Beginning in the 1990s, the share of unauthorized migrants increased while the share of legal migrants decreased. By 2004, more unauthorized migrants than legal migrants were entering the United States.
Despite the increase in female legal migrants, the foreign-born population overall became more male because males were a greater share of the largest contributor to this population: the unauthorized flow. By 2005, according to Pew Hispanic Center estimates, 58% of adult unauthorized migrants were male. Meanwhile, a majority (52%) of the adult female population was legal.
Countries of Origin
Examining Census Bureau data on countries of origin for migrants shows that the decrease in the proportion of female migrants in the United States was primarily driven by what happened with migration from Mexico and Central and South America—the prime sending areas overall and the source of most of the unauthorized migrant population.
Mexico, Central and South America account for more than three-quarters of the unauthorized population, Mexico alone accounts for 56% of the unauthorized population.
Migration from Mexico reflects the larger trends in gender composition. In 1980, about 300,000 female Mexicans reported having migrated to the United States since 1975 (Figure 3), accounting for about 45% of the Mexican migration. In 2004, about 1.1 million Mexican-born females said they had arrived in the previous five years, or about 42% of all recent arrivals from Mexico.
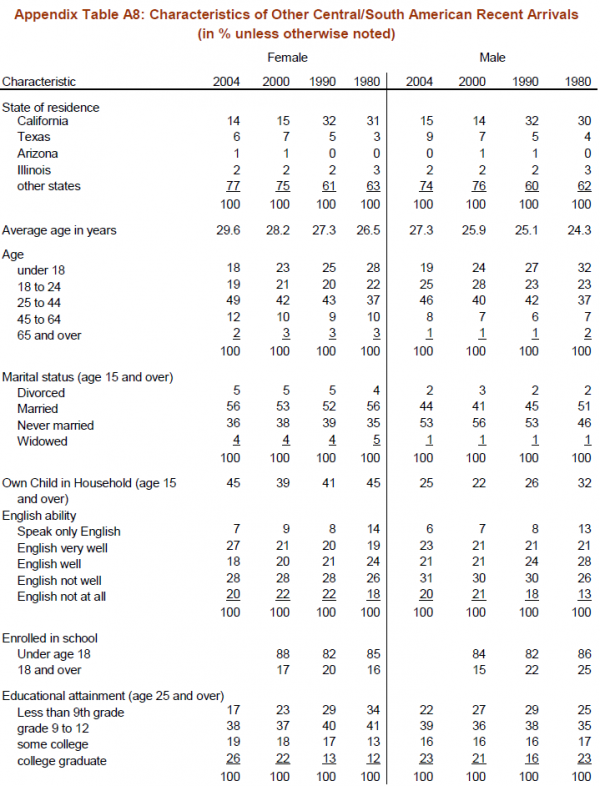
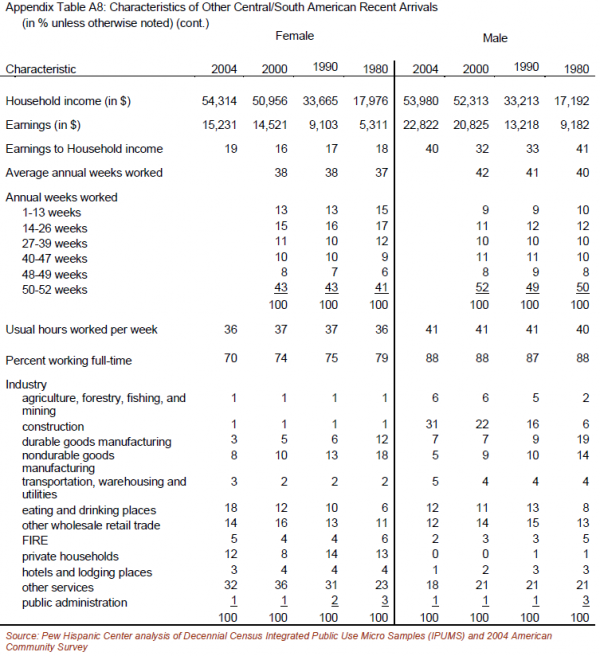
Migration flows from Central and South American countries other than Mexico have been more female. But, as is the case with Mexico, women from Central and South America have comprised a declining share of the flow from 1980 to 2004. In 1980, 53% of the recent migrants from Central and South America were females. By 2004, 48% of the migrant flow from other Central and South America countries was female (Figure 4).
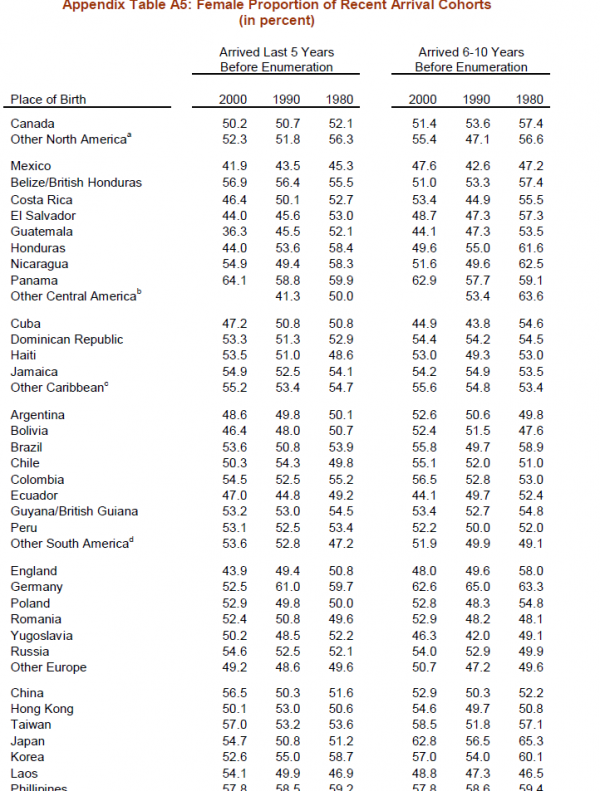
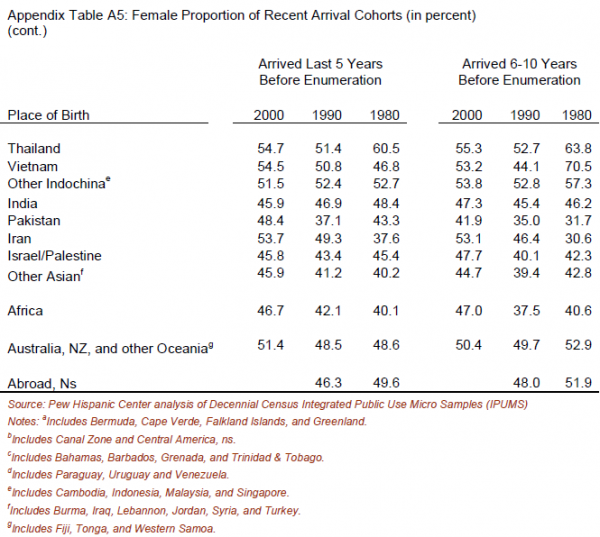
In almost all other countries in Central and South America—Panama being the only exception—the proportion of women migrating to the U.S. declined from 1980 to 2004. (Appendix Table A5) In Panama, the share of female migrants increased from about 60% of the flow in 1980 to 64% in 2000. Guatemala also stands out because the proportion of female migrants decreased significantly. In 1980, a majority of migrants from Guatemala were female but by 2000 females accounted for only 36%. Migration from the Caribbean, which accounts for between 6% and 8% of all international migration, has been majority female since 1980.
Legal Immigrant Admissions By Gender
In fiscal year 1982, about 48% of legal admittances were female. By fiscal year 2004, the rate increased to 54% This trend has been fairly steady, with the exception of fiscal year 1990, when admittances were high due to the Immigration Reform and Control Act legalization programs. In fiscal year 1990, 46.7% of admittances were female.
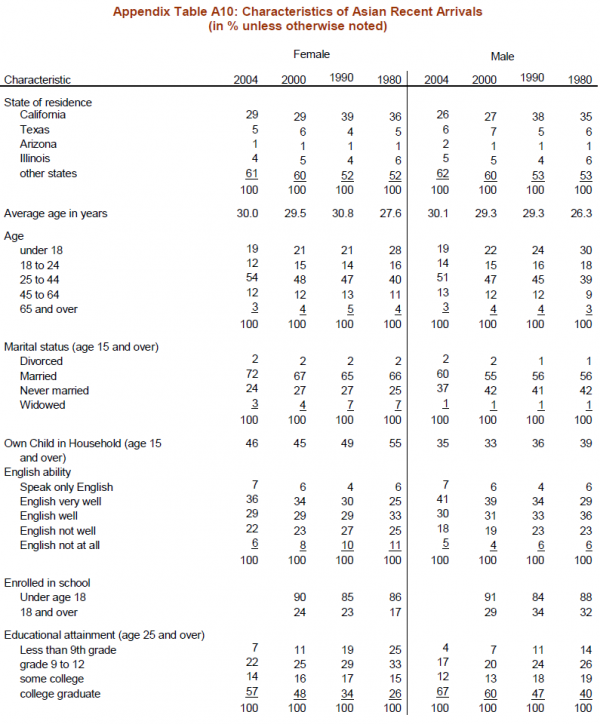
The share of females among recent migrants from Asia increased slightly from about 50% in 1980 to 52% in 2000. Although the overall flow of recent migrants from Asia has become slightly more female, several countries are a notable exception. The share of females among recent migrants from Korea, the Philippines, India, Thailand, and Hong Kong has declined from 1980 to 2000.
Changing Characteristics of Female Immigrants
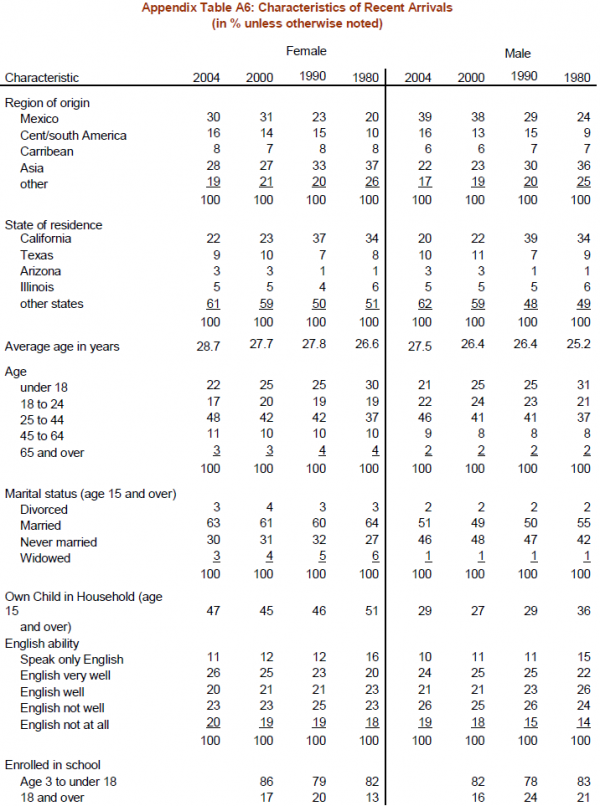
On several key characteristics, the profile of recent female migrants has changed considerably since 1980. Those who migrated to the United States between 1999 and 2004 tended to be better educated and older compared with those who arrived between 1975 and 1980. Fewer of them also arrived as children and fewer of them had ever been married.
Education
Since 1980, recently-arrived females have made significant gains in education.
The educational level of recent female migrants improved considerably since 1980. More female migrants attended high school or college, and fewer dropped out. This held true regardless of the region of origin and is consistent across all age groups.
The school enrollment of newly-arrived female children rose from 82% in 1980 to 86% in 2000, reflecting an overall increase in the enrollment of foreign-born teens. As significant, however, was the decline in the high school dropout rate (Fry 2006). The female teenage high school dropout rate declined from 13% in 1980 to 9% in 2000. Overall, migrant children from all regions of origin were more likely to be in school in 2000 than in 1980.
Among adult female migrants, school and college enrollment also increased, rising from about 13% among newly-arrived females age 18 and older in 1980 to 17% by 2000. Again, this increase held for all women regardless of region of origin.
Other studies have shown a slight improvement in the educational attainment of male immigrants (Betts and Lofstrom, 2000). The Census data shows that male migrants also had better educational credentials than their counterparts in 1980. But the strides made since 1980 by recently-arrived female migrants outpaced the gains of males over the same period.
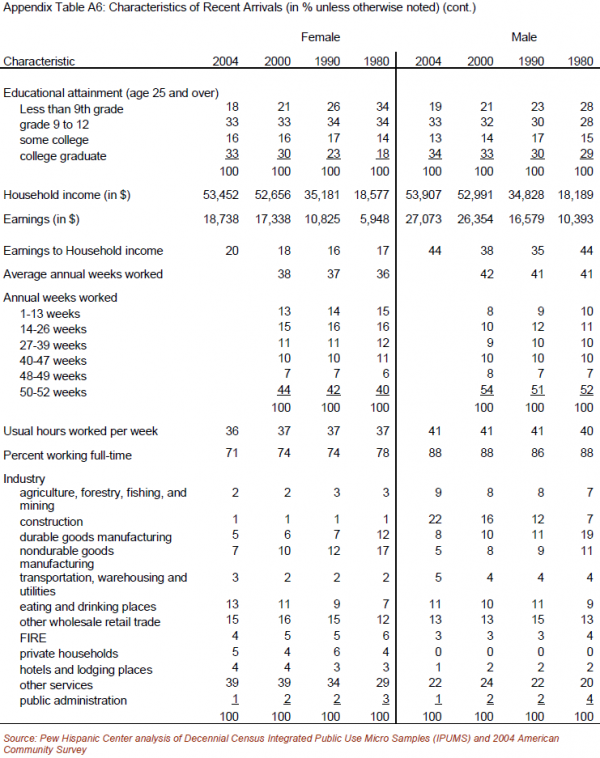
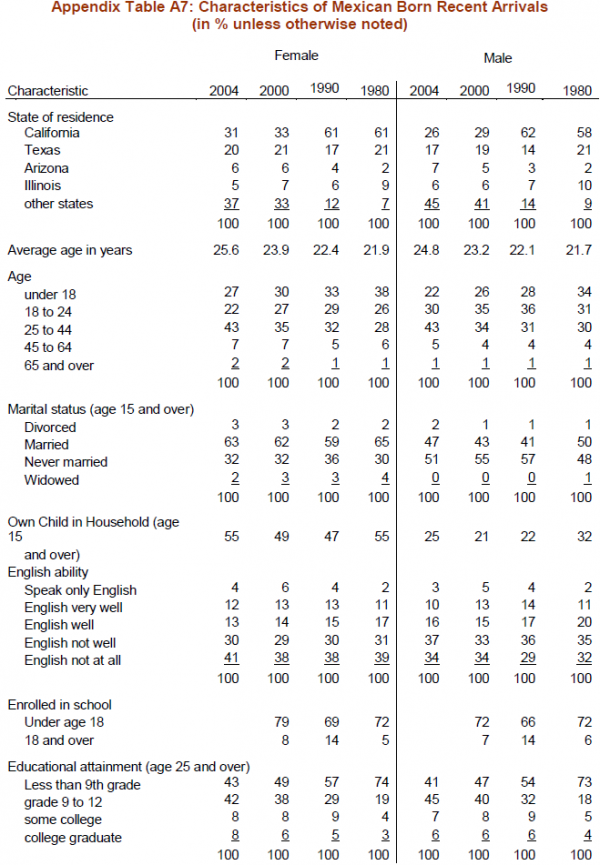
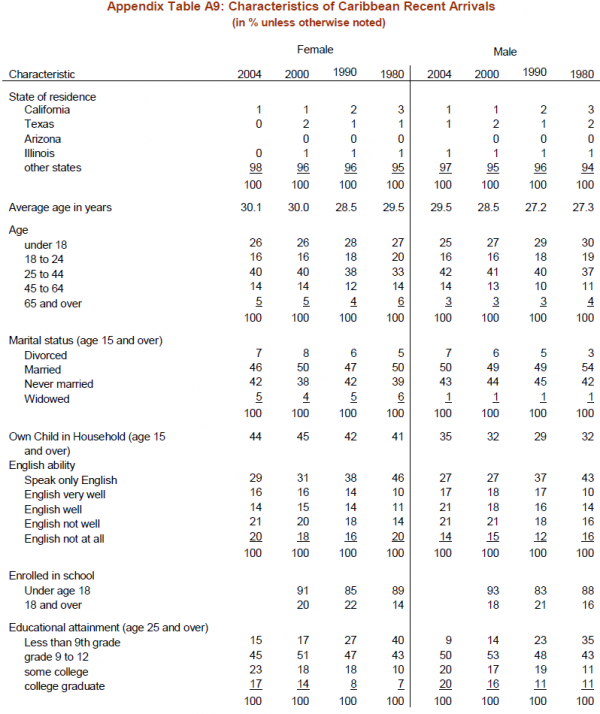
The proportion of female recent arrivals (age 25 and over) with less than a ninth grade education fell sharply, from 34% in 1980 to 18% in 2004. The share of recent arrivals with a college degree also increased from 18% in 1980 to 33% in 2004 (Figure 5).
By comparison, the proportion of males with a college degree increased from 29% in 1980 to 34% in 2004. Women were generally far behind in all levels of educational attainment in 1980. By 2004, they were just as educated as the males.
Women from each of the major sending regions displayed improvements in educational attainment. For example, in 1980 about three-quarters of newly-arrived women from Mexico had less than a ninth-grade education. By 2004, the rate dropped to 43%.
Age
In 1980, about 30% of recent female arrivals to the U.S. were children. By 2004, the proportion had dropped to 22%. The effect of this change is evident in the average age of recent female migrants, which increased by two years over this period.
Among Mexicans, the decline in the number of females migrating as children has been especially significant given the size of this population. Mexican female migrants are still younger overall, but proportionally far fewer of them arrived as children. The share of children among recent female immigrants declined from 38% in 1980 to 27% in 2004.
Marriage and Children
The proportion of female migrants from Mexico who have never married increased since 1980
Recent female migrants are somewhat more likely than their counterparts 25 years ago to have never married. In 1980, a little more than a quarter (27%) of recent female migrants were never married. By 2004, the proportion increased slightly, to 30%.
Female migrants from Mexico and Central and South America were more likely to not have married than recently arrived migrants from other parts of the world—again significant because women from these regions are a growing proportion of the migrant flow. Moreover, the proportion of female migrants from Mexico who have never been married also increased since 1980. In 1980, 30% of recently arrived females from Mexico had never married. By 2004, 32% had never married.
A declining share of female migrants had children of their own living with them in the U.S. In 1980, more than half (51%) of female migrants 15 years of age or older were parents of children living in the U.S. By 2004, the rate had decreased to about 47%. (The Census does not have information on whether a migrant has a child living in the country of origin).
This change, however, was driven by females from Asia and elsewhere. There was no change among female recent arrivals from Mexico and Central and South America. Among Asians, the share of female migrants who had their own children living with them in the U.S. decreased from 55% in 1980 to 46% in 2004. Among female arrivals from the other regions (mainly Canada, Europe, Africa, Australia, and New Zealand), the rate decreased from 50% in 1980 to 42% in 2004.
About 55% of Mexican females who arrived between 1975 and 1980 were parents, the same rate as those who arrived between 1999 and 2004. Among recently arrived females from Central and South American countries, the share of parents remained unchanged (45%) during the same time period.
Employment
By 2004, female migrants were far less likely to work in agriculture and manufacturing.
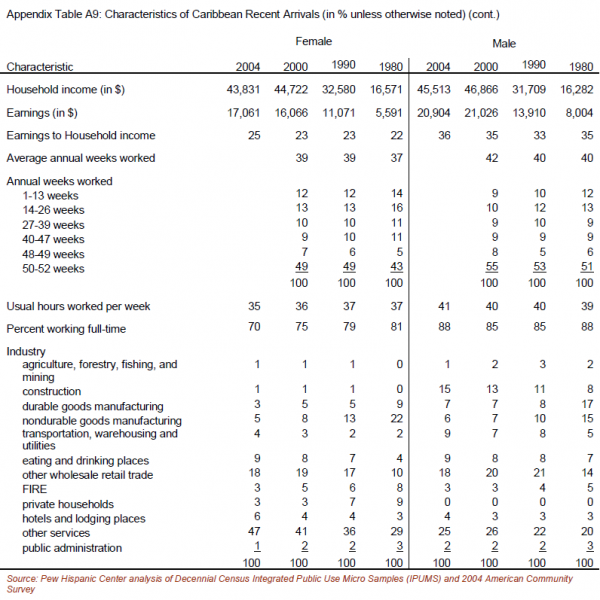
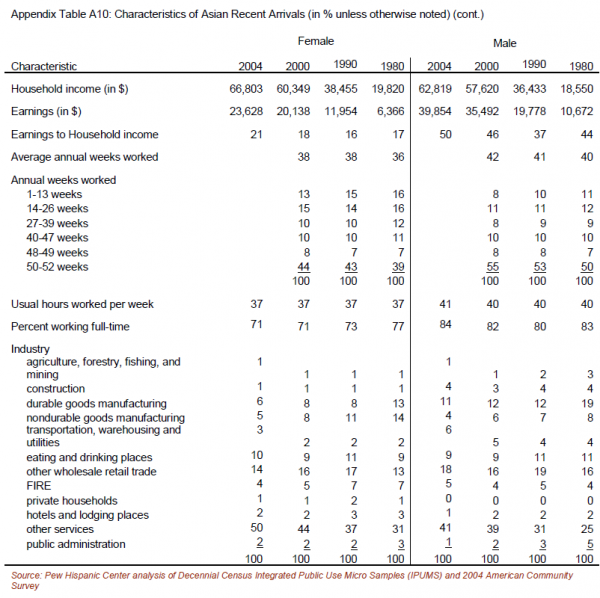
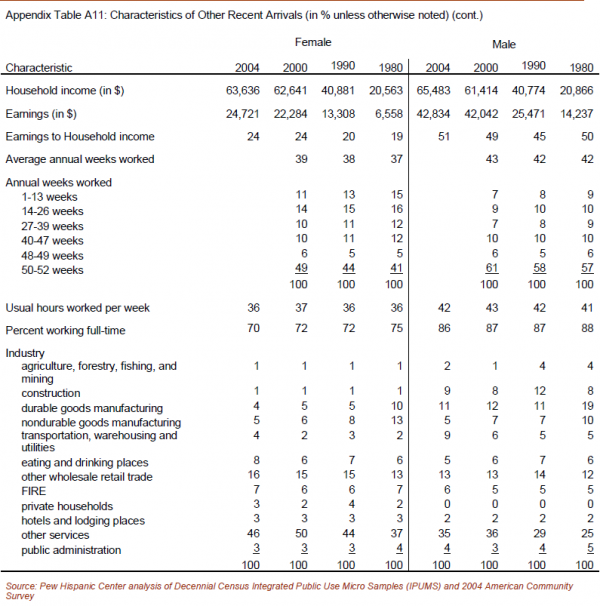
Comparing the labor force participation of female migrants, two significant changes emerge between those who arrived between 1975 and 1980 and those who arrived between 1999 and 2004. The number working fulltime decreased overall, but those who were employed worked more weeks every year. Female recent migrants also moved away from agriculture and manufacturing and more into the service sector.
The share of recent female migrants working more than 47 weeks per year increased from 46% in 1980 to 51% in 2000. But those who worked full-time (35 hours per week or more) decreased from 78% in 1980 to 71% in 2004.
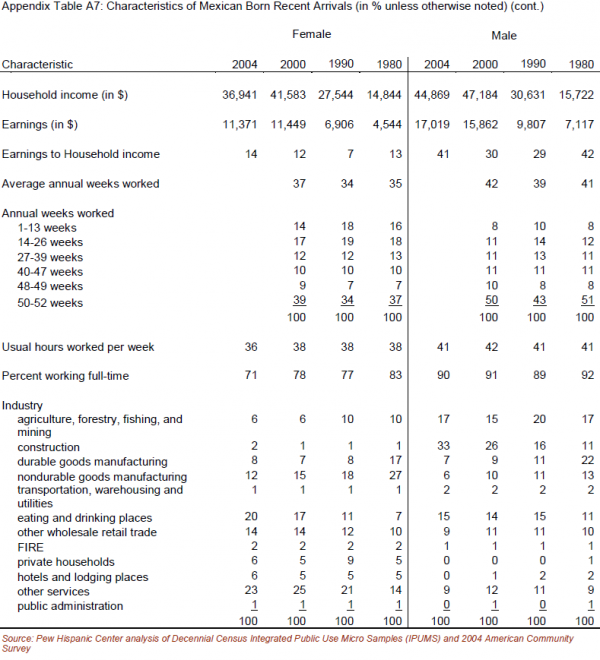
By 2004, recently-arrived females were much less likely to be working in manufacturing and agriculture than recently-arrived females in 1980, mirroring larger shifts in the U.S. labor force. Among Mexican-born females, for example, the rate of employment in manufacturing decreased from 44% among recent arrivals in 1980 to 20% among recent arrivals in 2004.
In agriculture, the rate among recently-arrived females from Mexico decreased from 10% to 6%. Among recently-arrived males, the rate of employment in manufacturing has also dropped but not so in agriculture, which held at about 17%.
Instead of manufacturing and agriculture, recently-arrived female migrants in 2004 found jobs in service industries, including wholesale and retail and eating and drinking places (Figure 6). For example, the rate of female recent migrants from Mexico who worked in eating and drinking places nearly tripled, increasing from 7% in 1980 to 20% in 2004.
Origins and Settlement Patterns
A much larger proportion of female recent arrivals in 2004 originated from the Western hemisphere than was the case 25 years ago, reflecting the growth in migration from Mexico and Central America. The share of female migrants from Mexico increased from 20% in 1980 to 30% in 2004. Female migrants from other Central and South America increased from 10% in 1980 to 16% in 2004.
Overall, about 56% of female recent arrivals originated in the Western hemisphere in 2004, up from 40% in 1980. The proportion of male recent arrivals from the Western hemisphere increased even faster, rising from 42% in 1980 to about 61% in 2004.
Female migrants in 2004 were far less likely to reside in California and in other established settlement states compared with those who arrived between 1975 and 1980. This mirrored the general dispersion of the immigrant population (Singer, 2004; Passel and Suro, 2005). The proportion of recent female migrants who reported residing in California declined from 34% in 1980 to 22% in 2004, a trend driven in great part by the dispersion of the Mexican population, both male and female. As recently as 1990, over 60% of newly arrived females from Mexico resided in California. By 2004, the proportion of Mexican-born females who were recent arrivals and living in California declined to about 31% (Figure 7).
The pattern evident among Mexican migrants extended to other female migrants and showed that California was no longer the magnet it once was. In 1990, almost a third of recent female arrivals from other Central and South American countries resided in California. By 2004, California was home to 14% of newly-arrived females. The same held true for females from Asia. In 1990, more than a third (39%) of newly arrived females from Asia lived in California. By 2004, the share of females from Asia had declined to 29%.
III. Other Research
Some analysts have suggested that migration to the United States has become increasingly feminine over time. Administrative data on the admissions of legal permanent residents from some of the larger sending countries support this view. There is evidence from household studies in some sending countries that also points to a larger proportion of females in migrant flows. The Census Bureau data examined in this report, however, lead to a different conclusion.
Studies that have examined the gender composition of legal immigrant inflows (legal permanent residents and refugees and those seeking asylum) show that females very often comprise a majority of arrivals and that they have historically accounted for the larger share of legal immigration. From 1930 to 1979, females accounted for 55% of all legal admissions to the United States (Houstoun, Kramer, and Barrett, 1984).
More recently, females have been less than a majority of legal admissions in some years, but that began to change in 1990. Since then, a rising share of legal admissions has been female (Zhou, 2002). Zhou reported that admissions in 1985 were 49.8% female. The female proportion of admissions dipped to 46.7% in fiscal year 1990 and then rose to 53.7% in fiscal year 1995 and 55.4% in fiscal year 2000.
Other studies that have assessed the characteristics of Mexican migrants to the United States have not reached uniform conclusions on the gender composition. These studies have generally relied on information gathered in Mexico from migrants who have returned from the U.S. rather than on data gathered in the U.S. on Mexican-born migrants living in the United States.
The Mexican Migration Project (MMP) is a series of ethno-surveys of Mexican communities conducted since 1987 under the direction of investigators at Princeton University and the University of Guadalajara. The MMP collects extensive information on the first and most recent trips to the U.S. of persons in a sample of households. The most recently available tabulations from the MMP reveal little change in the gender of all first-time migrants from these communities (Cerrutti and Massey, 2004). However, the mix of documented and undocumented migrants has changed over time in the MMP. Among undocumented migrants, the female share has risen from 11% of first-trips during 1965 to 1969 to 28% of first-trips during 1990 to 1995. Among first-time legal migrants there were sharp increases in the proportion of females between 1970 and 1974 and between 1990 and 1995. The increases in the 1990s may have resulted from the Immigration Reform and Control Act (IRCA). The 1986 law created the first sanctions against employers who hire illegal migrants and offered amnesties that eventually allowed some 3 million migrants to gain legal status and the right to citizenship. In the mid-1990’s, beneficiaries of the amnesties were able to start sponsoring family members and many subsequently received authorization to migrate legally.
Similarly, analyses of INS apprehensions data in the 1970s and 1980s suggest that male undocumented migration diminished but migration of women and children may have increased following the passage of IRCA (Bean et. al., 1990). The Encuesta Nacional de la Dinamica Demográfica, or ENADID, was a large nationally representative survey of Mexican labor migrants to the United States conducted in 1992. In addition to enumerating migrants who had returned to Mexico from the United States, ENADID included migrants residing in the United States as long as one household member remained behind in Mexico to report on them and considered the absent migrant to “normally” reside in the Mexican household. Analysis of ENADID revealed “remarkable continuity over time” in the gender composition of Mexican migrants (Durand, Massey, and Zenteno, 2001). This study supplemented the analysis of ENADID with matched samples from the U.S. Census of Mexican-born persons residing north of the border. The authors conclude that “women and children continue to be involved more or less as they were before.”
Forthcoming research from the Mexico/U.S. Migration Management Study Group, an academic research team funded by the William and Flora T. Hewlett Foundation and the Mexico’s Secretariat of Foreign Affairs, examines data from the U.S. Current Population Survey. The Current Population Survey is the monthly national household survey conducted by the Census Bureau. It is the source for the widely-watched national monthly unemployment rate figures and other labor force indicators. The research team’s analysis of the March CPS over several years between 1995 and 2002 (the March survey has a larger sample size) finds an increase in the female proportion of recent arrivals from Mexico. The female share of Mexican recent arrivals increased from 46% in 1995 to 50% in 2002 (Lowell, Pederzini, and Passel, forthcoming).
Small surveys of Mexican nationals conducted by the Center for U.S.-Mexican Studies at UC-San Diego provide modest evidence that the migrant flow is increasingly feminine (Marcelli and Cornelius, 2001). The surveys are conducted among households and businesses in Los Angeles and San Diego counties. The California surveys suggest an increase in the percentage of female migrants in the early 1990s, but they do not reveal if that change continued beyond IRCA legalization period.
Appendix: Data Sources and Tables
The tabulations presented are from the Decennial Census Integrated Public Use Micro Samples and the 2004 American Community Survey (ACS). The ACS surveys the household population, excluding persons residing in group quarters. To make the Decennial Census figures comparable to the ACS tallies, all the tabulations are restricted to the population residing in households for all years.
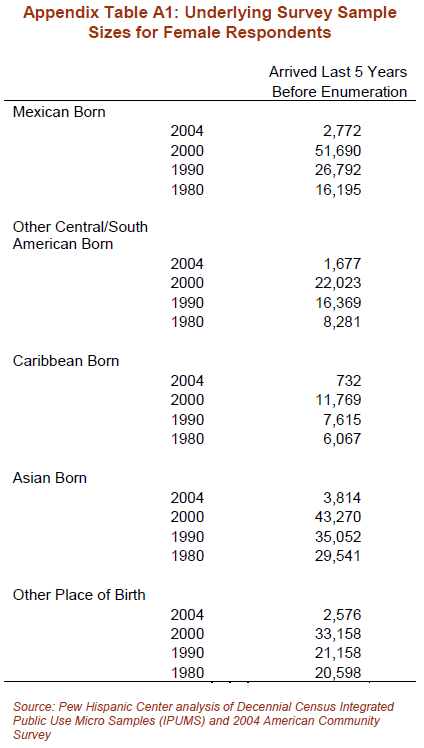
The 2004 ACS surveyed about 483,000 households, roughly 0.4 to 0.5% of all households. The micro samples utilized from the Decennial Censuses are the 5% samples. The underlying unweighted sample sizes for the female immigrants who arrived within five years of the sample enumeration are reported in Table A1.
The survey instrument for the ACS is very similar to the Decennial Census questionnaire. The ACS school enrollment question differs from the Decennial Census and thus the strict comparability between the two sources in regard to school enrollment is uncertain. For this reason, school enrollment tabulations from the ACS are suppressed. The analysis is restricted to individuals born outside the United States and outlying areas and hence persons born in Puerto Rico are not included.
This analysis did not attempt to adjust for Census undercount issues. It is well-known that the Census undercounts undocumented immigrants, an issue particularly relevant for Mexican-born arrivals. The undercount rate of the Mexican foreign-born population is thought to be larger for the 1980 Census than the 2000 Census. Since undocumented Mexican immigrants have been disproportionately male, the 1980 female share of the Mexican arrivals from 1975 to 1980 (45.3% in Table 2) is likely biased upward. Nonetheless, there is not any straightforward, transparent evidence that the arrival flow from Mexico has become more feminine since 1980.