Pew Research Center

FOR RELEASE MARCH 7, 2006

Size and Characteristics of the Unauthorized Migrant Population in the U.S.

Estimates Based on the March 2005 Current Population Survey

BY Jeffrey S. Passel

FOR MEDIA OR OTHER INQUIRIES:

Communications Department
202.419.4372
www.pewresearch.org

RECOMMENDED CITATION

Pew Research Center, March 2006, "Size and Characteristics of the Unauthorized Migrant Population in the U.S."

About Pew Research Center

Pew Research Center is a nonpartisan, nonadvocacy fact tank that informs the public about the issues, attitudes and trends shaping the world. It does not take policy positions. The Center conducts public opinion polling, demographic research, computational social science research and other data-driven research. It studies politics and policy; news habits and media; the internet and technology; religion; race and ethnicity; international affairs; social, demographic and economic trends; science; research methodology and data science; and immigration and migration. Pew Research Center is a subsidiary of The Pew Charitable Trusts, its primary funder.

© Pew Research Center 2026

Table of contents

  • About Pew Research Center
  • Size and Characteristics of the Unauthorized Migrant Population in the U.S.
  • II. Unauthorized Migrants: The Numbers
  • III. Unauthorized Migrants: Families and Children
  • IV. Unauthorized Migrants: The Workforce
  • Note on Methods and Terminology

Size and Characteristics of the Unauthorized Migrant Population in the U.S.

Estimates Based on the March 2005 Current Population Survey

I. Overview

The Pew Hispanic Center estimates that there are currently 11.5 to 12 million unauthorized migrants living in the United States.

Unauthorized Migrants

This report uses the term “unauthorized migrant” to mean a person who resides in the United States but who is not a U.S. citizen, has not been admitted for permanent residence, and is not in a set of specific authorized temporary statuses permitting longer-term residence and work. (See Passel, Van Hook, and Bean 2004 for further discussion.)

Two groups account for the vast majority of this population: (a) those who entered the country without valid documents, including people crossing the Southwestern border clandestinely; and (b) those who entered with valid visas but overstayed their visas’ expiration or otherwise violated the terms of their admission. Some migrants in this estimate have legal authorization to live and work in the United States on a temporary basis. These include migrants with temporary protected status (TPS) and some migrants with unresolved asylum claims. Together they may account for as much as 10% of the estimate.

This estimate is based on data from Census 2000, the March 2005 Current Population Survey (CPS) and the monthly Current Population Surveys through January 2006. Analysis of the March 2005 CPS shows that there were 11.1 million unauthorized in the United States a year ago. Based on the monthly Current Population Surveys conducted since then and other data sources that offer indications of the pace of growth in the foreign-born population, the Center developed an estimate of 11.5 to 12 million for the unauthorized population as of March 2006. See “Note on Methods and Terminology” below for definitions, data sources, and methods.

Using a well-established methodology, this report offers estimates for the size and certain characteristics, such as age and national origins, of the unauthorized population. Major findings include:

Numbers and Origins

  • The number of unauthorized migrants living in the United States has continued to increase steadily for several years, reaching an estimated 11.1 million based on the March 2005 compared to an estimate of 8.4 million based on Census 2000.
  • Since 2000, growth in the unauthorized population has averaged more than 500,000 per year. Based on evidence that this trend has persisted, the current unauthorized population can be estimated at between 11.5 and 12 million.
  • In the March 2005 estimate two-thirds (66%) of the unauthorized population had been in the country for ten years or less, and the largest share, 40% of the total or 4.4 million people had been in the country five years or less.
  • Unauthorized migrants accounted for 30% of the foreign-born population in 2005. Another 28% were legal permanent residents, and 31% were U.S. citizens by naturalization.
  • Most of unauthorized migrants came from Mexico. There were an estimated 6.2 million unauthorized Mexican migrants in 2005, or 56% of the unauthorized population.
  • About 2.5 million unauthorized migrants, or 22% of the total, have come from the rest of Latin America, primarily from Central America. Unauthorized migrants from Mexico and the rest of Latin America represented 78% of the unauthorized population in 2005.
  • Between 2000 and 2005 the number of unauthorized migrants from Mexico increased by about 1.5 million. Other large increases occurred among unauthorized migrants from Central America (+465,000) and South and East Asia (+365,000).

Family Characteristics

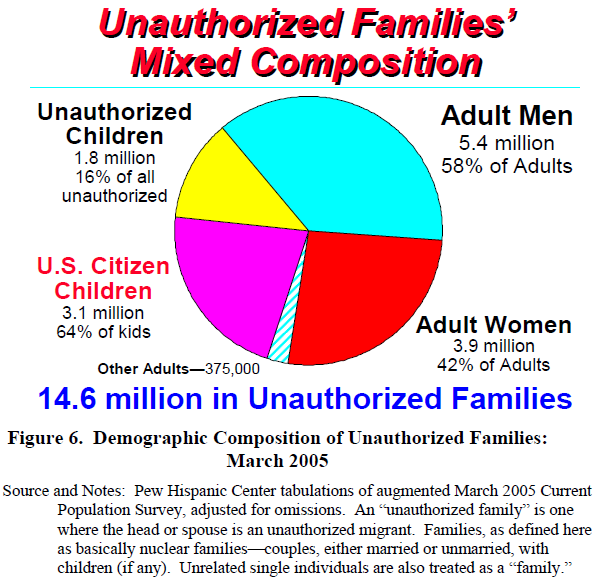
  • There were 5.4 million adult males in the unauthorized population in 2005, accounting for 49% of the total. There were 3.9 million adult females accounting for 35% of the population. In addition, there were 1.8 million children in the unauthorized population, or 16% of the total.
  • Among adults, males make up 58% of the unauthorized population while females make up 42%.
  • As of 2005, there were 6.6 million families in which either the head of the family or the spouse was unauthorized. These unauthorized families contained 14.6 million persons.
  • Nearly two-thirds (64%) of the children living in unauthorized families are U.S. citizens by birth, an estimated 3.1 million children in 2005.

Labor Force Characteristics

  • Unauthorized migrants accounted for about 4.9% of the civilian labor force in March 2005, or about 7.2 million workers out of a labor force of 148 million.
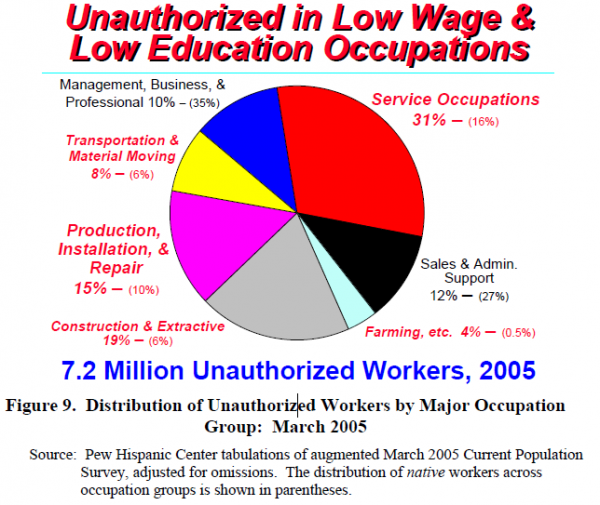
  • Unauthorized workers are employed in a variety of occupations, although the distribution of the unauthorized workforce across occupations differs from that of native-born workers. For example, nearly a third (31%) of unauthorized workers were employed in service occupations compared to onesixth (16%) of native workers in March 2005. Unauthorized migrants are underrepresented in white-collar occupations.
  • About 19% of unauthorized workers were employed in construction and extractive occupations, 15% in production, installation and repair and 4% in farming.
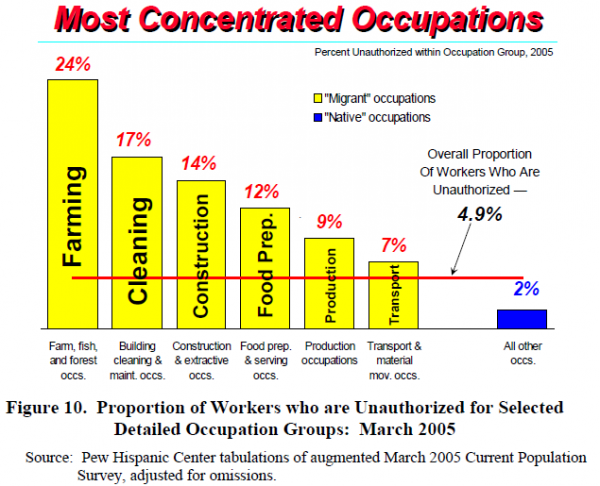
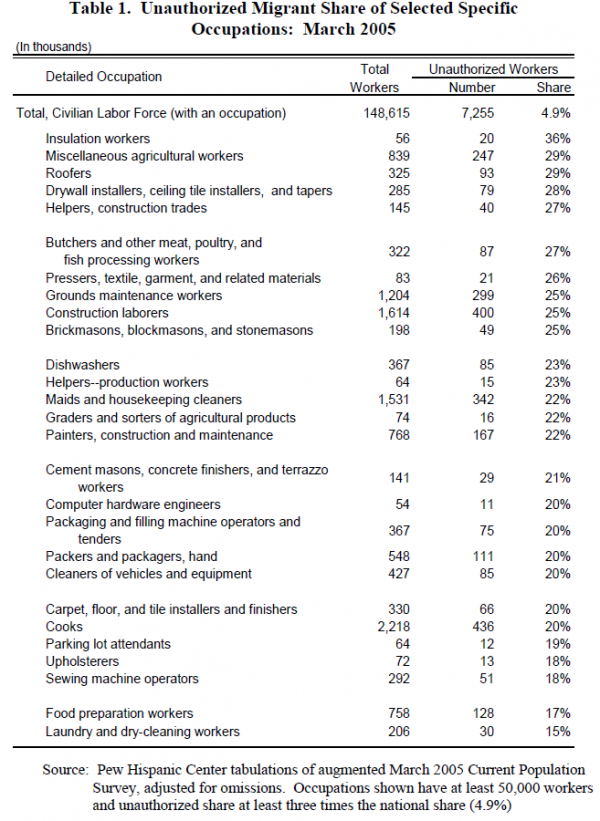
  • Unauthorized migrants make up a large share of all workers in a few more detailed occupational categories. They were 24% of all workers employed in farming occupations, 17% in cleaning, 14% in construction and 12% in food preparation industries. Within those categories, unauthorized workers were a very large share of all workers in certain specific occupations. For example, the unauthorized were 36% of all insulation workers and 29% of all roofers and drywall installers, 27% of all butchers and other food processing workers.
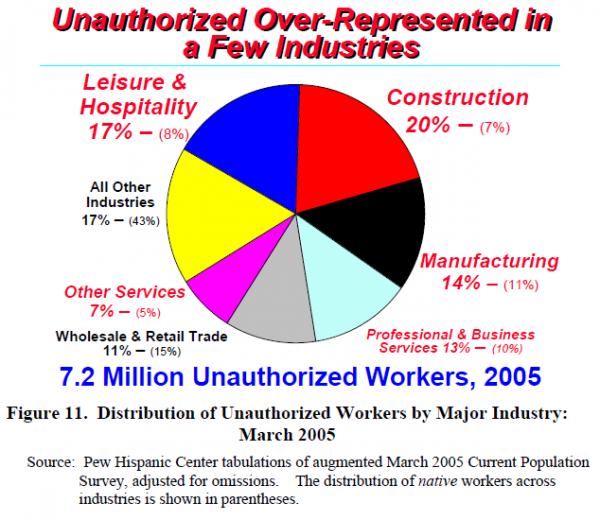
  • The concentration of unauthorized workers in broad industries is not as marked as the concentration in broad occupation groups. Only in “leisure & hospitality” and in “construction” does the share of unauthorized workers greatly exceed the share of natives. About 1 in 5 unauthorized workers was in the construction industry (20%) and 1 in 6 was in the leisure & hospitality industry (17%). Only about 7%–8% of native workers was in each of these industries.
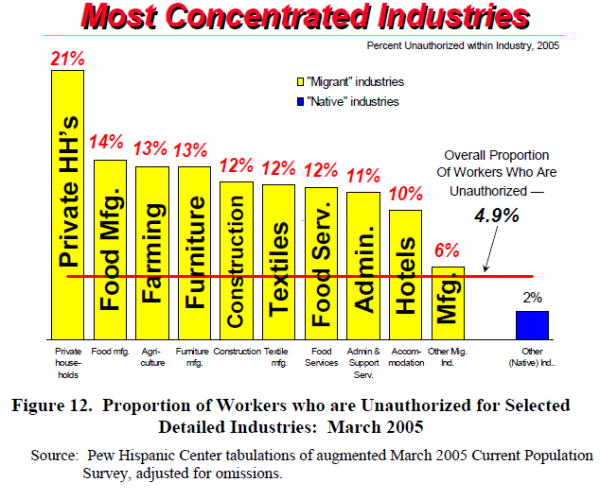
  • There are a few detailed industries with high concentrations and significant numbers of unauthorized workers. The unauthorized were 21% of the workers in private household industries. They were between 12% and 14% of all the workers in food manufacturing, farming, furniture manufacturing, construction, textiles, and food services.

II. Unauthorized Migrants: The Numbers

How the estimates are formulated

Neither the Census Bureau nor any other U.S. government agency counts the unauthorized migrant population or defines its demographic characteristics based on specific enumeration. The “residual method” is, however, a widely-accepted methodology for estimating the size and certain characteristics, such as age and national origins, of the undocumented population based on official data. This methodology essentially subtracts the estimated legal-immigrant population from the total foreign-born population and treats the residual as a source of data on the unauthorized migrant population (Passel, Van Hook, and Bean 2004).

The estimates reported here are based on this methodology applied to data from the March 2005 Current Population Survey (CPS). The CPS, a monthly survey of about 50,000 households conducted jointly by the U.S. Bureau of Labor Statistics and the Census Bureau, is best known as the source for monthly unemployment statistics. Every March both the sample size and the questionnaire of the CPS are augmented to produce the Annual Social and Economic Supplement, which provides additional data on several additional subjects, including the foreign-born population. See “Note on Methods and Terminology” below for definitions, data sources, and methods. A report based on data from the March 2004 CPS was published by the Center on June 14, 2005 and can be accessed at the following link: Unauthorized Migrants: Numbers and Characteristics

This methodology uses the term “unauthorized migrant” to mean a person who resides in the United States, but who is not a U.S. citizen, has not been admitted for permanent residence, and is not in a set of specific authorized temporary statuses permitting longer-term residence and work. (See Passel, Van Hook, and Bean 2004 for further discussion.) Two groups account for the vast majority of this population: (a) those who entered the country without valid documents, including people crossing the Southwestern border clandestinely; and (b) those who entered with valid visas but overstayed their visas’ expiration or otherwise violated the terms of their admission. Some individuals in our estimated unauthorized migrant population initially belonged to one of these groups but have obtained a temporary legal authorization to live and work in the United States. These individuals, many of whom are likely to revert to an unauthorized status, include migrants with temporary protected status (TPS) and others with unresolved asylum claims. Together they may account for as much as 10% of the estimate. In assessing potential programs for dealing with the unauthorized population, it seems appropriate to treat the quasi-legal group as part of the unauthorized program since a significant share of this group would probably be eligible to participate in any program that might lead to regularization of their status, such as a temporary worker program or an earned legalization program. (For an opposite view, see Martin 2005.)

Current estimates

As of March 2005, there were an estimated 11.1 million unauthorized migrants living in the United States. A comparison to past estimates derived with the same methodology shows that the undocumented population has grown rapidly in recent years. There were 8.4 million unauthorized migrants living in the United States in April 2000 according to estimates derived from Census 2000 (Passel, Van Hook, and Bean 2004). Thus, average annual growth over the 5-year period since 2000 was more than 500,000 per year. This number reflects the number of new unauthorized migrants arriving minus those who either die, return to their country of origin, or gain legal status. Data from the monthly Current Population Surveys conducted since March 2005, as well as other evidence such as the number of apprehensions by the Border Patrol, indicate that the unauthorized flow is continuing. Assuming that the rate of growth evident between Census 2000 and the March 2005 CPS held steady, the best estimate for March 2006 is between 11.5 million and 12 million for the current number of unauthorized migrants.

Most unauthorized migrants arrived in the past decade

More than 40% of the unauthorized population in 2005 or 4.4 million persons had been in the country since 2000 (Figure 1). Another 26% or 2.9 million people in the 2005 estimate arrived in the 5 years before that. Thus, about two-thirds of unauthorized migrants have been in the country less than 10 years.

The March 2005 estimates are consistent with earlier findings which show that the pace of the unauthorized arrivals accelerated at the end of the 1990s and the early years of this decade (Passel and Suro 2005). Between 2000 and 2005 the number of new arrivals averaged 850,000 a year. Note that this number is higher than the annual net increase to the population because it only measures the number of unauthorized migrants being added to the population and does not subtract the number who either die, return home or gain legal status.

The unauthorized are 30% of the foreign born population

The foreign-born population totaled 37 million in the March 2005 estimates, including: 11.5 million naturalized citizens (31%), 10.5 million legal permanent resident (LPR) aliens (28%), 2.6 million refugees (7%) and 1.3 million temporary legal migrants such as students and temporary workers (3%). The rest of the foreign-born population 11.1 million or 30% are unauthorized migrants.

[Note that some of the 2.6 million refugees have naturalized. If the refugees are grouped with LPRs and naturalized citizens, LPRs represent 11.8 million or 32% of all immigrants and naturalized citizens account for 12.8 million or 35%.]

National origins: Mexico dominates the flow

Most unauthorized migrants come from Mexico. There were 6.2 million unauthorized migrants from Mexico in 2005, or 56% of the total, according to the CPS-based estimates (Figure 4). The Mexican-born population in the United States, including both legal and unauthorized migrants, has grown by about 500,000 people a year for the past decade. Of the Mexican migrants in the U.S. less than 10 years, the Pew Hispanic Center estimates that approximately 80 to 85% are unauthorized.

About 2.5 million unauthorized migrants had come from the rest of Latin America in 2005, with most of those from Central America. Taken together, unauthorized migrants from Mexico and Latin America represented 78% of the unauthorized population in 2005. There were about 1.5 million unauthorized migrants from the Asian continent in 2005, representing about 13% of the total. Europe and Canada accounted for 600,000, or 6%, and Africa and other countries for about 400,000, or 3%.

While the shares from different regions have hardly changed in the last few years, between 2000 and 2005, the number of unauthorized Mexicans increased by 1.5 million, from 4.7 million to 6.2 million (Figure 5). During the same time period, the number of unauthorized migrants from Central America increased by 465,000, to 1.4 million; those from South and East Asia by 365,000, to 1.4 million; and those from South American by 160,000, to 705,000.

III. Unauthorized Migrants: Families and Children

Gender and family composition

Because unauthorized migration is driven primarily by the search for better wages (Kochhar 2005), the undocumented migrant is commonly thought of as a young, male worker usually unaccompanied by a wife or children. In fact, the full portrait of the unauthorized migrant population is more varied. Unauthorized migrants also live as couples (sometimes with a spouse who is a U.S. citizen or legal immigrant), and many of these couples have children. Some children are U.S. citizens and some are unauthorized, and sometimes there are both U.S. citizen and unauthorized children in the same family. There are also hundreds of thousands of single women.

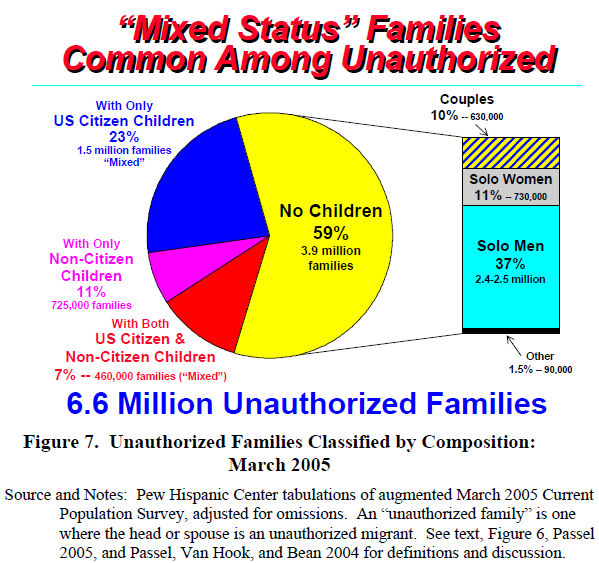
The unauthorized population included about 5.4 million adult males which is a little less than half of the 11.1 million total in the March 2005 estimate. There were more unauthorized adult men than women, with those 5.4 million males accounting for 58% of the 9.3 million unauthorized adults in the March 2005 estimates. (See Figure 6.) Approximately half of the adult men, or 2.4 million, were “solo males,” i.e., in the U.S. without wives or children (Figure 7).

There were approximately 3.9 million adult women in the unauthorized migrant population, representing 42% of the adults in the March 2005 estimate. Among adult women, only one in five, or about 730,000, is “solo”— in the U.S. without a husband or children (Figure 7).

There were 6.6 million unauthorized families in March 2005—defined here as a family unit (or solo individual) in which the head or spouse is unauthorized. Since unauthorized families can include U.S. citizens and legal residents as well as unauthorized migrants, the total number of persons in unauthorized families was 14.6 million, a figure that includes the 11.1 million unauthorized migrants.

A majority of these unauthorized families—3.9 million, or 59%—did not have children (Figure 7). They were made up of single adults, couples, or some other combination of adult relatives. The vast majority of these—about 3.2 million of the families without children—were solo individuals.

Families with children

Unauthorized families with children come in many combinations of legal and illegal statuses, both among the parents and their offspring. Of the 14.6 million people in unauthorized families in the March 2005 estimates, there were approximately 4.9 million children. Of these, about 3.1 million children, or 64% of all the children in unauthorized families, were American citizens because they were born in the United States. About 1.8 million of the children in these families were themselves unauthorized. Thus, children make up 16% of the entire unauthorized population of 11.1 million in the March 2005 estimates. (See Figure 6.)

Out of the total of 6.6 million unauthorized families, a significant share can be classified as being of “mixed status”—in other words, families in which at least one parent is unauthorized and at least one child was born in the United States. There were 1.5 million unauthorized families in which all the children were born in the United States. These families represent about one-quarter of all unauthorized families and more than half of unauthorized families with children. Another 460,000 families, or 7% of unauthorized families, had both U.S. citizen children and children who were unauthorized. Taken together, these mixed status families represent about one-third of all unauthorized families and five out of six unauthorized families with children. Finally, 725,000 families, or 11% of all unauthorized families, had only unauthorized children. (See Figure 7.)

IV. Unauthorized Migrants: The Workforce

High levels of employment for men but not for women

There were approximately 7.2 million unauthorized migrants in the civilian labor force in March 2005, accounting for about 4.9% of the U.S. workforce of 148 million workers.

Unauthorized male migrants are more likely to work when compared with males who are either legal immigrants or native-born. A number of factors contribute to this higher rate of participation in the workforce. Unauthorized migrants, for one, are much younger than other groups and older workers are more likely to be retired and disabled. Since fewer unauthorized migrants fall into the older age group within the workforce, more are likely to be working. Another significant factor affecting workforce participation is college attendance. Again, few unauthorized migrants attend college, so they are more likely than other groups to participate in the labor force.

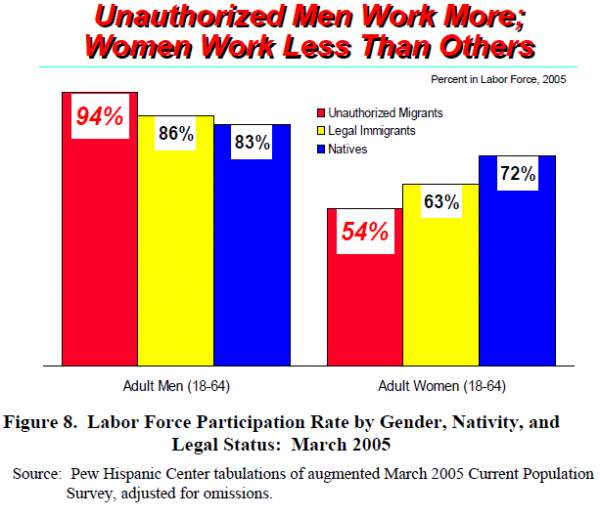
Among unauthorized migrants of working age (18 to 64 years old), 94% of males were in the civilian labor force, compared with 86% of male legal immigrants and 83% 0f native-born males. (See Figure 8.)

Unauthorized females, on the other hand, were less likely to be in the labor force than legal immigrants or native-born women. About 54% of unauthorized women were in the labor force, compared with 63% for legal immigrants and 72% for native-born women. The lower representation for women is likely due to several factors. The principal reason is the presence of young children in the family. Secondly, married women are less likely to participate in the workforce than unmarried women. Immigrant women are more likely to marry than natives. And, because of higher fertility rates, immigrant women are more likely to have children.

Occupations

Unauthorized workers are employed in a variety of occupations throughout the labor force, although the distribution of the unauthorized workforce across occupations differs from that of native-born workers.

Unauthorized workers are notably underrepresented in white-collar occupations. “Management, business, and professional occupations” and “Sales and administrative support occupations” accounted for more than six of ten native workers (62%) but less than one-quarter of unauthorized workers (23%) in March 2005. On the other hand, unauthorized migrants are much more likely to be in major occupation groups that require little education or do not have licensing requirements. The share of unauthorized employed in agricultural occupations (4%) and construction and extractive occupations (19%) was about three times the share of native workers in these types of jobs. The share in service occupations (31%) was about double that of native workers (16%). (See Figure 9.)

Another way to look at the employment of unauthorized is by measuring how much of an occupational category is filled by unauthorized workers. In a few occupational categories unauthorized migrants make up a large share of all workers employed in those categories. So, although only 4% of unauthorized workers were employed in farming occupations, they make up 24% of all workers employed in those occupations. Elsewhere, the unauthorized were 17% of the workforce in cleaning occupations, 14% in construction and 12% in food preparation industries. (See Figure 10.)

The CPS collects extensive employment data which allows a still more detailed look at the occupations of the unauthorized. There are a variety of detailed occupations in which unauthorized workers make up more than a quarter of all the workers employed. Of course, these specific occupations tend to be found in the occupation groups described above. Moreover, they tend to share the characteristics noted earlier: little or no formal education is required; no licensing is involved; and major preparation can involve on-the-job training. Table 1 shows specific occupations with at least 50,000 workers nationally and in which the representation of unauthorized workers was more than three times their 4.9% share of the civilian workforce. The unauthorized represented: 36% of all insulation workers; 29% of all roofers, drywall installers, and miscellaneous agricultural workers; 27% of all butchers, other food processing workers, and construction helpers.

Industries

A somewhat different picture emerges from looking at employment data by industry rather than occupation. The concentration of unauthorized workers in major industries is not as marked as the concentration in broad occupation groups. Only in “leisure & hospitality” and in “construction” does the share of unauthorized workers greatly exceed the share of natives. About one in five unauthorized workers was in the construction industry (20%) and one in six is in the leisure & hospitality industry (17%) in March 2005. Only about 7%–8% of native workers were in each of these industries. Neither of these industries tends to require formal credentials from many of their prospective workers. Further, there are many occupations in these industries that require very little formal education. In several industries including services, wholesale and retail trade, manufacturing, and professional and business services, the unauthorized are employed in roughly the same shares of natives. (See Figure 11.)

There are fewer detailed industries with high concentrations and significant numbers of unauthorized workers than detailed occupations. The range of credential and educational requirements is generally broader for industries than for occupations. Nonetheless, there are some industries in which unauthorized workers make up a sizeable share of the labor force.

The unauthorized were 21% of the workers in private household industries. They were between 12% and 14% of all the workers in food manufacturing, farming, furniture manufacturing, construction, textiles, and food services. (See Figure 12.)

Note on Methods and Terminology

Getting the Number

The estimate of unauthorized workers is derived by using a variant of a basic “residual” method. The method relies on exclusion. In other words, the unauthorized population consists of persons and groups not included in the authorized population. To reach that number, the first step is to develop an estimate for the legal, foreign-born population. That estimate is based on admissions into the country provided by the Department of Homeland Security (DHS) and its predecessor, the Immigration and Naturalization Service (INS), as well on the number of refugees admitted and the number of asylum applications granted.

After allowing for legal temporary migrants and for legal immigrants missed in the Census or the yearly March Supplement to the CPS, the initial estimate of the unauthorized population covered in the survey is derived by subtracting the estimated legal population counted from the Census or CPS figure for the foreign-born population. The initial number of unauthorized migrants is then adjusted upward to account for omissions. All calculations are done by country or region of birth, age, sex, period of arrival and state or region of residence.

The residual method has been used for several decades to measure unauthorized migration to the United States. Specifically, some of the first sound empirical estimates (Passel 1986 and Warren and Passel 1987) were arrived at by applying residual methodology to the 1980 Census. Variants of the residual method have been used or discussed by the Census Bureau, the Panel on Immigration Studies, the Bi-National (U.S.-Mexico) Study, the Commission on Immigration Reform, the Immigration and Naturalization Service, and several other organizations and researchers. Recently, the DHS has released estimates using a similar methodology (Warren 2003; also, Warren 2001 for earlier variants).

Although the residual method has been applied to previous March CPSs (e.g., 2004—Passel 2005; 2003—Capps et al. 2005; 2002—Passel, Capps, and Fix, 2004), the statistical properties of the residual estimates make it very difficult to use estimates from successive CPSs to measure year-to-year changes. Specifically, most of the sampling variance of the total foreign-born population is part of the variance of the residual estimate of unauthorized migrants. This property means that the variance of the measure of annual change is quite large. Nonetheless, the series of annual estimates provides indications of overall trends and the difference in unauthorized population estimates separated by several years can provide information on average annual change. In this report, we use a residual estimate based on Census 2000 together with the CPS-based estimate for March 2005 to assess change over the five-year interval.

Who is Legal

  • Persons who arrived before 1980 are all assumed to be legal by 2000.
  • Persons who are already in legal status in the US and “adjust” to legal permanent residence. These are added to the legal population in the year they receive their permanent residency (unless they have already been counted in other groups listed here); however, they are counted as “arriving” in the U.S. in the earlier when they arrived in their previous legal status.
  • “New Arrivals,” or persons getting green cards as they enter the U.S. These are counted in the year they arrive (unless they are already counted in other groups listed here)
  • Persons who acquired legal status under the Immigration Reform and Control Act of 1986 (IRCA) are included as legal when they obtain their legal permanent residency; their year of arrival is based on survey data of this group.
  • Cubans, Haitians and other entrants, Amerasians and various groups of parolees are included as legal when approved and not when they received their legal permanent residency. The same applies to those who receive asylum
  • Refugees are counted in the year they arrived in the U.S. and not when they receive legal permanent residency.

See Passel, Van Hook, and Bean 2004, 2006 for a more detailed explanation of the methodology.

Who is Unauthorized

Virtually all unauthorized migrants fall into two categories: those who overstayed their visas or those classified by the government as “entries without inspection,” or EWIs. Visa overstayers likely represent between 25% and 40% of the unauthorized migrants.

There are also various administrative categories that are not included in the estimated legal foreign-born population. Many people are classified as having Employment Authorization Documents, or EADs, that are issued by the Department of Homeland Security and thus could be considered “authorized” in some sense.

There are an estimated 1 million to 1.5 million people who fall into the unauthorized category but are under several “quasi-legal” categories. Some examples include persons with Temporary Protective Status, or TPS, and those with Extended Voluntary Departure, or EVD, as well as those applying under these statutes. Together, these migrants may account for 300,000 to 400,000 unauthorized persons.

Another 250,000 persons have applied for asylum but have not had their cases adjudicated. Although some may have their applications approved and may eventually receive legal permanent residency, many and perhaps most will not. A third group not included in the estimate of legal residents is made up of persons who have employment authorization and are waiting for “green cards” or LPR status, but whose status is not yet final. There are about 600,000 people in the U.S. who have applied for legal permanent residency but are waiting for them to be issued. And finally, there are about 100,000 persons who are immediate relatives or fiancées of legal residents who are awaiting their legal permanent residency. Most in these groups will eventually receive permanent legal status.

The inclusion of the quasi-legal group with the unauthorized or their exclusion as legal depends in part on the availability of data to estimate their numbers and in part on the ultimate use of the estimates. The data for these groups are problematic. In particular, the numbers cited above are approximations; the required demographic detail is generally lacking; and the various categories overlap to some unknown (and possibly substantial) degree. For use in assessing potential programs for dealing with the unauthorized population, it seems appropriate to treat the quasi-legal group as part of the unauthorized program since a significant share of this group would probably be eligible to participate in any program that might lead to regularization of their status, such as a temporary worker program or an earned legalization program. (For an opposite view, see Martin 2005.)

Augmentation of the CPS

The CPS data presented here are largely based on tabulations of augmented files from the March 2005 CPS and Census 2000 5-percent PUMS. The augmentation encompasses assignment of probably legal status to individual migrant cases in the survey and adjustment for omissions. The data and techniques employed were developed initially at the Urban Institute by Passel and Clark (Passel and Clark 1998 and Passel, Van Hook, and Bean 2006 for description of the various methods used.)

The methods involve estimating the number of unauthorized migrants with the techniques described previously. In this process, the CPS data are first corrected for over-reporting of naturalized citizenship on the part of aliens. Then, persons entering the U.S. as refugees and individuals holding certain kinds of temporary visas (including students, diplomats, and “high-tech guest workers”) are identified in the survey and assigned an immigration status using information on country of birth, date of entry, occupation, education, and various family characteristics. Individuals that are definitely legal and those that are potentially unauthorized are identified in the CPS (based on state of residence, age, sex, occupation, country of birth, and date of entry). Next, using probabilistic methods, enough of the potentially unauthorized are selected and assigned to be unauthorized so as to hit the estimated numbers of legal and unauthorized migrants included in the survey. This last step, which assigns more than three-quarters of the potentially unauthorized as unauthorized, involves a consistency edit to ensure that the family structures of both legal and unauthorized populations “make sense.” The whole process requires several iterations to produce estimates that agree with the demographically-derived population totals. Finally, the survey weights for the foreign-born are adjusted upward so that the tabulated figures agree with the analytic, demographic estimates of the total number of legal and unauthorized migrants developed in the very first step.