Pew Research Center

FOR RELEASE DECEMBER 15, 2005

The Occupational Status and Mobility of Hispanics

Hispanics and whites perform different types of work in the labor market. Moreover, the occupational divide between the two largest segments of the labor force appears to be widening.

BY Rakesh Kochhar

FOR MEDIA OR OTHER INQUIRIES:

Communications Department
202.419.4372
www.pewresearch.org

RECOMMENDED CITATION

Pew Research Center, December 2005, "The Occupational Status and Mobility of Hispanics"

About Pew Research Center

Pew Research Center is a nonpartisan, nonadvocacy fact tank that informs the public about the issues, attitudes and trends shaping the world. It does not take policy positions. The Center conducts public opinion polling, demographic research, computational social science research and other data-driven research. It studies politics and policy; news habits and media; the internet and technology; religion; race and ethnicity; international affairs; social, demographic and economic trends; science; research methodology and data science; and immigration and migration. Pew Research Center is a subsidiary of The Pew Charitable Trusts, its primary funder.

© Pew Research Center 2026

Table of contents

  • About Pew Research Center
  • The Occupational Status and Mobility of Hispanics
  • II. Introduction
  • III. The Occupational Characteristics of Hispanic Workers
  • IV. A Measure of Occupational Dissimilarity and the Socioeconomic Status of Occupations
  • V. Changes in Occupational Distributions and Status between 1990 and 2000
  • VI. The Determinants of Socioeconomic Status
  • VII. The Occupational Mobility of College-Educated Hispanics
  • VIII. Conclusions

The Occupational Status and Mobility of Hispanics

Hispanics and whites perform different types of work in the labor market. Moreover, the occupational divide between the two largest segments of the labor force appears to be widening.

I. Overview

This report summarizes the major findings of a research project sponsored by the Pew Hispanic Center. The research was conducted by Maude Toussaint- Comeau of the Federal Reserve Bank of Chicago, Thomas Smith of the University of Illinois- Chicago, and Ludovic Comeau, Jr. of DePaul University. Their paper is titled “Occupational Attainment and Mobility of Hispanics in a Changing Economy” and a copy is available at the Web site of the Pew Hispanic Center (www.pewresearch.org/pewresearch-org/hispanic). The full report should be consulted for additional analysis and further details on the findings discussed in this summary report.

Hispanics and whites perform different types of work in the labor market.1 Moreover, the occupational divide between the two largest segments of the labor force appears to be widening. The occupations in which Hispanics are concentrated rank low in wages, educational requirements and other indicators of socioeconomic status. Those indicators also show a worsening in the occupational status of Latinos and a growing gap with respect to whites during the 1990s. That is surprising because the decade was witness to the longest economic expansion in recent U.S. history. But even as unemployment was on the decline for all racial and ethnic groups, structural shifts in employment across industries contributed to a greater division in the occupational status of Hispanics and whites.

These findings emerge from a research project sponsored by the Pew Hispanic Center to examine the occupational status and mobility of Hispanic workers. The study focuses on the 1990 to 2000 time period and uses data from three sources—the Census Bureau, the University of Michigan, and the National Science Foundation. Comparisons of occupational status over time and across groups of workers are facilitated by the development of a composite indicator that assigns a score to each occupation based on its experience and education requirements. Another tool developed for the study is the Dissimilarity Index that provides a measure of the difference in occupational distributions across groups of workers. Utilizing these and other analytical tools, the report presents a rich array of conclusions regarding the occupational distribution of Hispanics, its diversity across country-of-origin groups, changes in the distribution over time, the factors that influence the speed of those changes, and the status of Latinos relative to whites and other racial and ethnic groups.

The key findings of the study are as follows:

  • Hispanics are concentrated in non-professional, service occupations, such as, building and ground cleaning and maintenance and food preparation and serving. The representation of Hispanics in management and professional occupations declined between 1990 and 2000.
  • Occupations in which Hispanic workers are concentrated rank low in earnings, education requirements and a general measure of socioeconomic status.
  • The occupational status of Mexicans and Puerto Ricans lags the furthest in comparison to the status of whites. Cubans and whites are comparable in occupational status.
  • A measure of occupational dissimilarity reveals an increasing degree of separation between Hispanics and whites from 1990 to 2000. Whites increased their representation in professional occupations while Hispanics trended towards construction and service occupations.
  • Changes in the structure of industries, such as the rise of the technology sectors and the decline of manufacturing, diminished the prospects for upward occupational mobility for Hispanics in the 1990s. These shifts led to a decline for Hispanics in employment in several professional occupations with high socioeconomic status.
  • Education contributes to improving the occupational status of a worker but less so for foreign-born Hispanics.
  • The length of time that foreign-born Latinos have been in the U.S. contributes to a narrowing of the gap in occupational status with respect to whites. Assimilation proceeds faster for the more educated and it is estimated that the less educated will never fully assimilate in occupational status.
  • More recently arrived cohorts of Hispanic immigrants have lower occupational status than previously arrived cohorts even if they have the same level of education and experience.
  • Looking just at the college-educated, Hispanics are found to be more likely to change occupations—either in the upward or downward direction—than other workers. Recently arrived immigrants and immigrants who do not speak English have a very high probability of switching occupations within five years.

II. Introduction

The rapidly growing presence of Hispanics in the labor force has sharpened the interest in their economic well-being. Fueled by immigration, the Hispanic labor force nearly tripled in size from 6.1 million to 16.7 million between 1980 and 2000.1 Latinos now make up 13 percent of the labor force in the U.S., higher than the share of blacks. But the growth in numbers has not been accompanied by great success as measured by the traditional metrics of earnings and employment. The unemployment rate for Latinos remains persistently above the rate for whites and their earnings are lower than those of either whites or blacks.

The focus of this report is on the occupational status and mobility of Hispanics. Occupation is an important determinant of earnings and employment prospects in an evolving economy. And occupations often bestow a status upon workers that extends beyond mere economic outcomes. The 1990s witnessed both a record economic expansion and the emergence of an information economy. Were Hispanic workers able to take advantage of those developments to climb the occupational ladder and narrow the gap between them and whites? That is among the central questions addressed in this report.

The analysis finds considerable evidence of an occupational divide across Hispanics and whites. In particular, the occupations in which Hispanics are concentrated rank low in wages, educational requirements and other indicators of socioeconomic status. Those indicators also show a worsening in the occupational status of Latinos in both absolute and relative terms during the 1990s. That is surprising in light of the strong growth in the U.S. economy during most of that decade. But while unemployment was generally on the decline, structural shifts in employment across industries favored different groups of workers in a varying fashion. That, in turn, contributed to a greater division in the occupational status of Hispanics and whites.

The report uses three major sources of data. Foremost are the Public Use Micro Statistics (PUMS) files from the Decennial Censuses of 1990 and 2000. These large datasets are good for studying the occupational status of Hispanics in general and smaller sub-groups of immigrants based on country of origin or year of arrival in the United States. The analysis of the Census data is supplemented with the 1990 Panel Study of Income Dynamics (PSID) and the 1993 National Survey of College Graduates (NSCG). The PSID is a longitudinal data set, i.e. it follows the same panel of individuals over a period of time. The specific PSID panel used in this report features an over sample of Hispanics and covers the 1990 to 1993 time period. The longitudinal nature of the PSID provides an alternative perspective on the occupational mobility of Hispanics and the assimilation of Latino immigrants. The NSCG is a National Science Foundation database that is useful for focusing on the status of the most highly educated Hispanics. The 1993 NSCG enables a study of the occupational mobility of college graduates between 1988 and 1993.

…if more Latinos moved from production to construction occupations, does that mean an improvement or worsening in their occupational status?

The analysis of occupational status is facilitated by the development of a measure of socioeconomic status that assigns a score to each occupation based on its experience and education requirements. Such an indicator is useful because just looking at the distribution of workers across occupations does not necessarily yield the information needed to infer the direction of change in occupational status. For example, if more Latinos moved from production to construction occupations, does that mean an improvement or worsening in their occupational status? That type of question is answered in this report by comparing the socioeconomic status score across occupations. Another tool developed for the study is the Dissimilarity Index that yields a measure of the difference in occupational distributions across groups of workers. That is a useful method for summarizing the gap in the occupational distributions across workers from different racial and ethnic groups. Utilizing these and other analytical tools, the report presents a rich array of conclusions regarding the occupational distribution of Hispanics, its diversity across country-of-origin groups, changes in the distribution over time, the factors that influence the speed of those changes, and the status of Latinos relative to whites and other racial/ethnic groups.

III. The Occupational Characteristics of Hispanic Workers

A distinctive feature of the occupational profile of Hispanic workers is their lack of representation in professional occupations. Instead, Hispanics are more likely than average to be found in construction and production occupations. This trait is particularly true of Latinos of Mexican or Puerto Rican origin. The ongoing immigration of workers from Mexico has served to reinforce these occupational characteristics during the 1990s.

Both white and Asian workers are more than twice as likely as Latino workers to be found in professional occupations. Only 16 percent of Latinos worked in professional occupations in 2000 compared with 34 percent of white and 42 percent of Asian workers (Figure 1). In contrast, Hispanics are much more likely than white and Asian workers to be employed in farming, construction, and production occupations. Over one-third of Latino workers are employed in construction and production work. And while farming engages only 3 percent of Hispanic workers, it is particularly dependent on Latino workers as they are five to ten times more likely than other workers to participate in those occupations. In fact, while Hispanics were only 12 percent of the labor force in 2000, they made up more than 40 percent of workers in farming occupations. Overall, the occupational distribution of Latinos resembles the profile of black workers most closely with similar proportions of both to be found in professional, service, sales, and production occupations.

Hispanic male and female workers have very different occupational attributes. Almost half of Hispanic male workers—49 percent to be more exact—were concentrated in construction and production occupations in 2000 (Figure 2). In contrast, 61 percent of Hispanics females worked in service and sales occupations. Hispanic women are also more likely than their male counterparts to be in professional occupations.

Of the three largest components of the Hispanic community—Mexicans, Puerto Ricans, and Cubans—the occupational profile of Cubans comes closest to resembling that of whites and Asians. Nearly 30 percent of Cubans worked in professional occupations in 2000 (Figure 3). On the other hand, only 13 percent of Mexicans were engaged in professional occupations and nearly twice as many, or 24 percent, were in production occupations. Mexican workers are also the most likely among Latinos to engage in construction and production work and farming occupations are almost their exclusive preserve within the Hispanic workforce.

The occupational traits among Hispanics are reinforced by immigration, especially so for Mexicans. As shown in Figure 4, only 8 percent of immigrant Mexican workers were in professional occupations in 2000. Mexican immigrants are also much less likely to engage in sales occupations than the average for all Mexicans. That is a likely consequence of the lack of English-language skills among recently arrived immigrants. Nearly one-half, or 48 percent, of Mexican immigrant workers were engaged in construction and production occupations in 2000. Similar tendencies, albeit on a much smaller scale, are observed for workers born in Cuba and Puerto Rico.1

IV. A Measure of Occupational Dissimilarity and the Socioeconomic Status of Occupations

This section develops two composite measures that may be used to measure differences in occupational distributions and rank occupations by socioeconomic status. The occupational profile of Latino immigrants is found to be the most dissimilar from the profile of white workers. An important reason for this gap is differences in the levels of education. Hispanics and immigrant from Mexico, in particular, are concentrated in occupations that rank among the lowest in socioeconomic status. There is evidence, however, that the socioeconomic status of immigrant workers improves with time spent in the United States.

The occupation of a worker is an important determinant of his or her earnings and employment prospects. Occupations also convey a status upon workers based on the skill requirements and compensation generally associated with that occupation. But the mere distribution of a group of workers across occupations does not yield the information needed to infer their placement in the hierarchy of occupations. Some occupations require high education but pay relatively little, e.g. priests or teachers, while others require less education but pay relatively well, e.g. hazardous occupations in construction and mining. Which set of occupations is more prestigious depends upon the criterion that is applied. A related issue arises with respect to comparisons over time. If Latinos moved from production to construction occupations over time, does that mean an improvement or worsening in their occupational status? And how can we quickly ascertain whether the occupational characteristics of two or more groups of workers are converging over time? Finding answers to these sorts of questions is facilitated by the use of two composite indicators.

The first indicator, termed the Dissimilarity Index, is a measure of the spread across occupational distributions.1 This index ranges in value from 0 to 100 and is a pure measure of differences in the occupational distributions of two groups of workers. The index does not in any sense imply that one distribution is better than the other. It works as follows: Suppose that all Latinos worked in production occupations and all whites worked in sales occupations. The Dissimilarity Index (DI) would then take a value of 100. If Latinos and whites all worked in sales, the DI value would be zero. The index will also equal zero if the same proportions of Latinos and whites are employed in the two occupations. A value of, say, 20, would mean that 20 percent of Latino workers have to switch occupations so that their occupational distribution resembles the occupational distribution of whites.

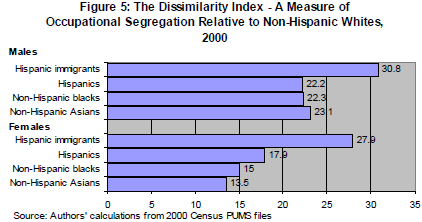
The occupational profiles of immigrant Hispanic and white workers are the most dissimilar. Figure 5 shows the extent to which the occupational distributions of Hispanics and other workers differ from that of whites. Not surprisingly, 31 percent of male, foreign-born Hispanic workers would have to change occupations to match the occupational profile of male white workers in 2000. For all male Hispanics, blacks, and Asians, the DI index is on the order of 22 to 23 percent. Differences across female workers are less pronounced. About 14 to 18 percent of female Hispanic, black, and Asian workers would have to switch occupations to have occupational profiles that resemble the profile of female white workers. However, the gap among female, foreign-born Hispanic workers and white females—28 percent—is as large as the gap observed for male workers.

The evidence in Figure 5 shows that the occupational profile of Hispanic workers is just as different from that of white workers as the profiles of black and Asian workers. It is important to note that this does not mean Hispanic workers have the same occupational characteristics as black and Asian workers. For example, in the case of Latinos and whites the difference is driven by the greater concentration of Hispanics in construction and production occupations. But, with respect to Asians and white, the gap is a consequence of the greater presence of Asians in professional and scientific occupations.

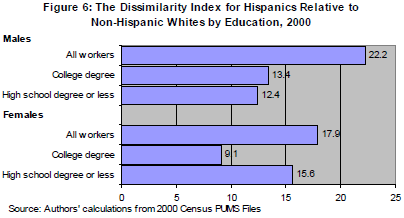
A key factor behind the dissimilarity in occupations is education. When college-educated Hispanic males are compared to their white counterparts, the DI index value shrinks to 13 percent (Figure 6). Similarly, a value of 12 percent emerges when less educated Hispanic and white male workers are compared to each other. But, in the aggregate, it was observed that the gap between Hispanic and white male workers is 22 percent. That is because white males are much more likely to be college-educated than Hispanic male workers. A similar conclusion emerges for Hispanic and white females, but it is worth noting that the gap between college-educated Latino and white females is much narrower than the gap among similar males.

The Dissimilarity Index is a useful tool for summarizing differences in occupational characteristics but it offers no judgment on the status of occupations in which groups of workers are engaged. That is provided by a second indicator that assigns a socioeconomic status score to each occupation. This score is derived from statistical analysis that, based on wages, measures the value each occupation assigns to an additional year of education or experience. The scores are scaled to fall within the range of 0 to 100. Occupations in which education and experience are highly valued will receive scores closer to 100. The average socioeconomic status score across the 475 detailed occupations listed in the Census data in 2000 was 34.8.

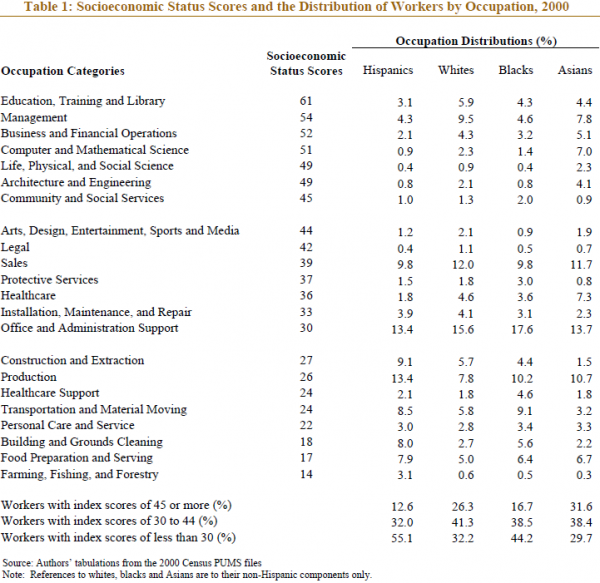
Table 1 shows the socioeconomic status score for each of 23 broad occupational categories. The highest score of 61 is attained by education, training and library occupations. Management occupations are close behind with a score of 54. The lowest scoring occupations, all with scores less than 20, are building and grounds cleaning, food preparation and serving, and farming, fishing and forestry.

Hispanics are concentrated in occupations that rank the lowest in socioeconomic status. In Table 1, 23 occupations are divided into three groups as follows: the seven occupations with a score of 45 or higher, the next seven with scores of at least 30 but less than 45, and the final eight with scores below 30. The occupational distribution of Hispanics (also shown in Table 1) reveals that 55 percent of them were engaged in occupations falling in the bottom third of the rankings. The same is true of 44 percent on blacks, but only about 30 percent of whites and Asians work in occupations with the lowest socioeconomic status scores. The roles are reversed at the top as only 13 percent of Hispanics and 17 percent of blacks are employed in the seven highest ranking occupations. Whites and Asians work in these occupations at double these rates—26 percent and 32 percent respectively.

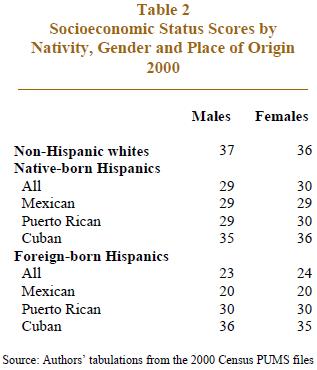
The average socioeconomic status score achieved by Hispanic workers is well below the average for white workers As shown in Table 2 the average socioeconomic status score for white males in 2000 was 37. This is slightly above the overall average of 35. Native-born Hispanic males score only 29 and foreign-born Hispanic males achieve a score of only 23. The lowest score of all belongs to Mexican immigrants whose average is 20 regardless of gender. That average is below the score for all but three of the 23 occupations listed in Table 1. Puerto Ricans and Cubans score above the average for all Hispanics. In fact, Cubans rank along with whites with respect to their socioeconomic status. The scores for male and female workers are virtually identical, differing only by a point here or there.

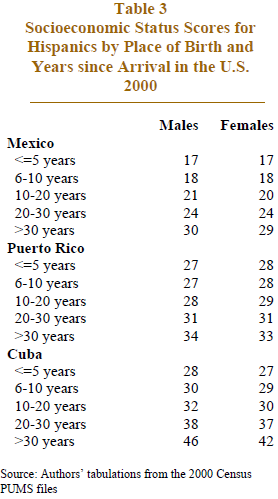
While the socioeconomic status of foreign-born Hispanics is low, it does improve with time spent in the United States. The data in Table 3 show that Mexican immigrants who have been in the U.S. for five years of less attain a score of only 17, but those who arrived in the U.S. over 30 years ago score 30 points, much closer to the overall average of 35 and the average of 37 for whites. Cuban immigrants started high on the scale relative to other Hispanics and those who arrived 20 years ago now have scores of 38 and above, higher than the U.S. average. It should be noted, however, that not all of this increase is necessarily a sign of progress with years spent in the U.S. At least some of this effect could be due to the possibility that immigrants who arrived earlier had a higher level of skills and, therefore, higher occupational attainment regardless of years spent in the U.S. This point is touched upon in greater detail at a later point in the report.

V. Changes in Occupational Distributions and Status between 1990 and 2000

The occupational divide across Hispanics and whites grew wider between 1990 and 2000. That is perhaps surprising in light of the record economic expansion that lasted virtually the entire decade. However, restructuring within and across industries tended to fuel demand for Hispanic and non-Hispanic workers in a differential manner and they trended into different occupation over the decade. Hispanic workers expanded their presence mostly in construction and service occupations during this time. On the other hand, white workers were much more likely to be found in professional occupations in 2000 than in 1990.4

Changes in the distributions of employment of male and female workers are shown in Figures 7 and 8. The data in these figures show the percentage point change between 1990 and 2000 in the proportions of workers in six major occupations. In Figure 2 above it was shown that 13 percent of Hispanic males were engaged in professional occupations in 2000. Figure 7 shows that this share was 1.8 percentage points less than the proportion of Hispanic males in professional occupations in 1990. The opposite happened with white male workers as they increased their representation in professional occupations by more than 2 percentage points between 1990 and 2000. More specifically, the proportion of white male workers in professional occupations increased from about 30 percent to 32 percent in that decade. Another big difference in the occupational trends of Latino and white male workers was that the proportion of Hispanics in construction increased by 4 percentage points between 1990 and 2000, four times the percentage point increase for white male workers. Both groups of workers decreased their representation in production occupations with the reduction being slightly greater for white males.

Like their male counterparts, white female workers also increased their presence in professional occupations. The proportion of white females in professional occupations went up by 4.8 percentage points between 1990 and 2000 (Figure 8). At the same time, the representation of Hispanic females decreased by one-half of a percentage point. On the other hand, the proportion of Hispanic women in service occupations increased by over 4 percentage points. This was four times higher than the 1 percentage point increase in the share of white female workers.

The growing gap in the occupational distributions of Hispanics and whites is captured by the dissimilarity index. As shown in Table 4, the dissimilarity index between Hispanic and white male workers increased from 19.7 in 1990 to 22.2 in 2000. The dissimilarity index between Hispanic and white female workers also increased in this time, from 16.1 in 1990 to 17.9 in 2000. The opposite result obtains for black and white workers as the dissimilarity index for this pair of workers, male or female, shrunk between 1990 and 2000.

Several factors contributed to the growing dissimilarity in the occupational distributions of Hispanics and whites. One factor is education. Hispanics are less likely to be college educated than non-Hispanics and this disparity widened during the 1990s. Table 5 shows the schooling level of Hispanics, whites and blacks (ages 16 and older) in 1990 and 2000. About 27 percent of Hispanic workers had at least some college education in 1990. By 2000, this proportion had increased only slightly to 28 percent.5 In contrast, 47 percent of white workers had at least some college education in 1990 and this proportion increased to 53 percent by 2000. Black workers too registered increases in their level of education during the 1990s. Thus, non-Hispanic workers were relatively more educated in 2000 than in 1990 and this would be one reason why they increased their representation in professional occupations.

In addition to schooling, demand conditions in the labor market also play a role in shaping the occupation distributions of workers. Table 6 summarizes the effect of demand factors in changing the occupation distributions of Hispanic and non-Hispanic white male workers between 1990 and 2000.6 The data in Table 6 show the actual change in employment by occupation and the influence of three factors in determining the extent of the employment change. The first factor is labeled the “job growth effect.” In a world of perfectly balanced growth all industries would expand at the same rate and the demand for workers in all occupations would also increase in the same proportions. If overall employment increases by, say, 10 percent, the job growth effect raises employment in each occupation by 10 percent. Thus, the only difference in the economy and the labor force over time would be in the scale of operations and the occupational distributions of all workers would remain unchanged.

In reality, of course, industries grow at different rates and production technologies shift over time. Differences in the growth rates of industries will alter the relative demand for occupations and this effect is labeled the “industry shift effect” in Table 6. For example, a relatively high growth rate in the construction industry will cause the demand for construction workers to increase at a higher than average rate. That may work in favor of Hispanic male workers who are disproportionately concentrated in the construction industry. On the other hand, a more rapid rate of growth in the professional services industry might mean greater demand for the relatively better educated non-Hispanic workers.

Even if industry growth effects are not at work, changes in production technologies can favor one group of workers over another. For example, the advent of information technologies in the 1990s contributed to increased demand for computer-literate workers. That may have contributed to the growing movement of non-Hispanic white workers into professional occupations. This effect is labeled as the “occupation mix effect” in Table 6.

The data in Table 6 cover six broad occupational categories. The calculations underlying the results, however, were performed at a much greater level of detail for industries and occupations. Thus, it should be noted that the industry and occupation effects can operate in different directions for different groups of workers depending on their particular distribution across detailed industries and occupations within the broad categories shown in the table.

There were 2.8 million Hispanic male workers of ages 25 to 54 employed in the U.S. labor market in 1990. Driven by immigration, the size of this cohort increased by 1.8 million workers, or 65 percent, between 1990 and 2000 (Table 6). Under conditions of balanced growth, the employment of Hispanic males would have increased by 65 percent in each occupation. That would have meant, for example, an additional 364,107 Hispanic male workers in professional occupations. In actual fact, however, the employment of Hispanic males increased by only 176,339 between 1990 and 2000. This lower-than-expected increase in the employment of Hispanic professionals is due to the presence of negative industry and occupation effects. The occupation mix effect shows a loss of 121,079 jobs for Hispanics in professional occupations. This means that as a result of reorganization within industries, professional jobs held by Hispanic workers were less in demand in 2000 than in 1990. Hispanic professionals also tended to be in industries with sub-par growth rates, leading to a loss of 66,688 jobs due to the industry shift effect.

Job growth for Hispanics was above expectation in four occupations—farming, service, production, and construction.

Job growth for Hispanics was above expectation in four occupations—farming, service, production, and construction. Job growth in production occupations happened despite the general decline in manufacturing which was responsible for the negative industry shift effect. Hispanics benefited from a positive occupation mix effect, i.e. there was a shift in the hiring of workers in manufacturing that favored jobs in which Latinos were well represented.

The cohort of white male workers (ages 25 to 54 in 1990) diminished in size by 827,888 workers, or 2 percent, between 1990 and 2000. This decline is not surprising since, unlike Hispanics, immigration is not a significant force for replenishing the size of this demographic group. The overall decline implies a negative job growth effect for white males in all occupations. However, there was positive job growth for white males in professional, service, and construction occupations. Job gains in professional occupations were especially notable with an employment increase of nearly 1 million. Both industry and occupation effects worked to the benefit of white male workers. However, the same effects caused a loss of 1.3 million production jobs for white males between 1990 and 2000.

Overall, the increase in employment of Hispanic workers between 1990 and 2000 is largely explained by the increase in the size of their workforce. Their growth in numbers was either responsible for most of their increase in employment in an occupation, e.g. in service, construction and production occupations, or it was large enough to overcome negative industry and occupation effects, such as, in professional occupations. On the other hand, the size of the white male workforce is stationary and growth in any occupation, such as, in professional occupations, was dependent on the beneficial effects of industry and occupation effects.

VI. The Determinants of Socioeconomic Status

The occupational attainment of all workers improves rapidly with education. Experience in the labor market is another factor that adds significantly to a worker’s occupational status. However, the contribution of experience to a worker’s status does eventually fade over time. Two factors that are important to the success of immigrant workers are English-language skills and time spent in the United States. Not surprisingly, the lack of English-language skills depresses the status of immigrant workers. Years of experience does raise the occupational profile of foreign-born Hispanics but at a relatively slow rate. It is estimated that only college-educated immigrant workers are likely to converge to the status of white workers in the course of their working years.

This section presents the results from a statistical analysis designed to understand the contribution of various factors to the occupational attainment of Hispanic and other workers.7 Occupational attainment is measured by the socioeconomic status score of an occupation. Since the socioeconomic status score is a quantitative measure in the range of 0 to 100 it is possible to estimate the how much of a contribution is made by, say, a college degree versus a high school degree to raising the occupational status of a worker. The analysis is conducted with data from the Panel Survey of Income Dynamics (PSID). The PSID is a longitudinal dataset, i.e. it collects information from the same panel of families and individuals over time. The PSID data used in this study come from the 1990 panel which includes a larger than usual sample of Hispanic households and covers the 1990 to 1993 time period.8 The analysis of the data is designed to estimate the relationships between a worker’s characteristics and his or her occupational attainments. Absent a sudden shift in those relationships the findings from these data are just as relevant for today’s labor market.

Education, not surprisingly, has a strong impact on occupational attainment. It is estimated that with each additional year of schooling workers can attain an 8.5 percent higher score in socioeconomic status. This implies that four years of college opens doors to occupations that have a socioeconomic status score that is nearly 40 percent higher than the occupations in which high school graduates are typically employed. The impact of education does vary across sub-groups. Comparing across some racial or ethnic groups, the highest return to education—8.1 percent—is received by non-Hispanic whites. The return for native-born Hispanics is 7.1 percent and Mexican immigrants receive a 6.2 percent yield for each additional year of education. But even if these returns are somewhat lower it is clear that education has a significant effect on the occupational attainment of all workers.

Labor market experience also contributes to occupational attainment but in a more complicated manner. Experience initially leads to increases in the socioeconomic status score. However, the rate of increase diminishes with more experience and eventually the scores begin to diminish. The first year of labor market experience, for example, leads to an increase of over 2 percent in the socioeconomic status score. The return to experience decreases with each subsequent year of experience and eventually, after about 25 years of experience, turns negative. In other words, occupational attainment reaches a peak after about 25 years in the labor market. That is consistent with other research that shows a decline in the occupational mobility of workers over time along with the opportunity for advancing their socioeconomic status score.

The lack of English language skills has a detrimental effect on the achievement of Hispanic immigrants. Compared to other workers, Hispanic immigrants who do not speak English have an 8.5 percent lower occupational attainment score. However, when immigrants from Mexico and Cuba are compared among themselves, the ability to speak English emerges as an unimportant factor. In other words, immigrants from Mexico are in occupations with similar socioeconomic status scores whether or not they speak English. This suggests that, in addition to language skills, segregation by origin and occupation are also important influences on the occupational attainments of Hispanic immigrants.

The possibility that different waves of immigrants brought different levels of skills with them to the U.S. is also tested with the statistical analysis. Hispanic immigrants are first separated into different cohorts depending upon whether they arrived before 1960 or between 1960-69, 1970-79, 1980-85 and 1986-90. The statistical analysis then controls for differences in education, experience, years since migration and other attributes across cohorts. Even after those controls are applied the pattern that emerges is that earlier arriving cohorts have higher occupational attainment scores. In particular, the cohort that arrived between 1986 and 1990 has socioeconomic status scores that are 36.5 percent below the level for whites. By contrast the cohort that arrived in the 1960s had a disadvantage of 19.3 percent and the 1970s cohort lagged whites by 25.5 percent. Factors that may have contributed to this phenomenon include changes in the regional origin of immigrants and the shift in immigration laws to favor family reunification.

Regardless of the arrival cohort, the length of time Hispanic immigrants have been in the U.S. does raise their occupational attainment but the pace of improvement is slow. Relative to other workers, the socioeconomic status of Hispanic immigrants climbs at the rate of 0.7 percent per year. This means that even 30 years spent in the U.S. leads to a climb of only 23 percent up the ladder of socioeconomic status scores. It was shown earlier in Table 2 that the average socioeconomic status score of Hispanic immigrants would have to increase by about 50 percent to reach the level for whites. Thus, a 30-year career in the U.S. cuts this disadvantage by just under one-half. The pace of assimilation does proceed faster for more educated immigrants. A more detailed analysis shows that the occupational attainment of Mexican immigrants with a college degree converges to the median score for whites in about 15 years. Unfortunately, only a small minority of Mexican immigrants has earned a college degree and economic assimilation for the majority remains a slow process.

VII. The Occupational Mobility of College-Educated Hispanics

A college degree opens the doors to higher levels of occupational attainment for Hispanics both in absolute terms and relative to the attainment of whites. Among immigrants, a college degree appears to be strongly related with the possibility of reaching parity in occupational status with whites. Consistent with the findings in the preceding section, results from a sample of college graduates show a high absolute degree of occupational mobility among the college educated. This tendency is most pronounced among recently arrived immigrants and immigrants who do not speak English. However, Latinos with postgraduate levels of education and tenure in U.S. schools are less likely than average to change occupations.

This section presents evidence from the analysis of the 1993 National Survey of College Graduates (NSCG). As the name suggests, the NSCG is a database of college graduates only. The 1993 NSCG has information on whether a worker is in the same occupation or with the same employer as in 1988. Thus, the data can be used to study the mobility of college-educated workers across occupations and employers over a five-year period. With the application of socioeconomic status scores it is also feasible to determine whether a change in occupation was in an upward or downward direction.9

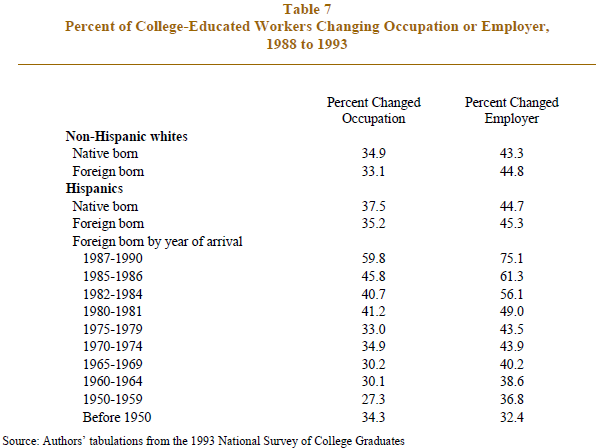
Data on the percentage of Hispanic and white workers that changed occupations or employers between 1988 and 1993 are shown in Table 7. Approximately 45 percent of workers, whether Hispanic, white, immigrant or native born, changed employers between 1988 and 1993.10 The rate at which workers changed occupations—about 35 percent—was slightly lower. The most notable aspect of Table 7 is that the propensity of Hispanic immigrants to change occupations and employers is highest in the first few years spent in the U.S. and then decreases steadily. For example, 60 percent of Hispanic immigrants who arrived in the U.S. between 1987 and 1990 had switched occupations by 1993. In the same group of immigrants 75 percent also switched employers by 1993. But among Hispanic immigrants who arrived in the 1950s these proportions are only 27 percent and 37 percent respectively, or less than half the rate. Thus, the process of assimilation among Latino immigrants involves a very high rate of occupation and employer turnover in the early years presumably as they acquire U.S. labor market experience and find the right match for their skills.

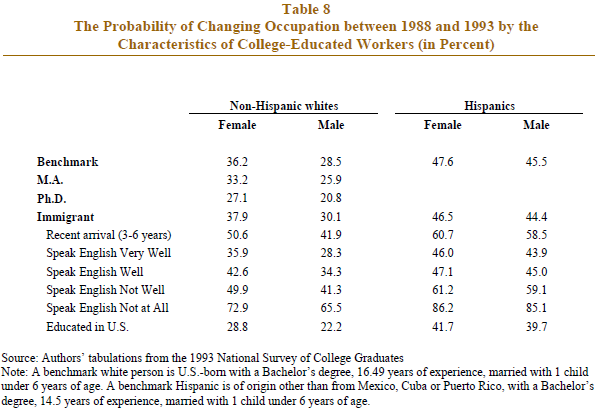
Are there any characteristics that make a worker more or less likely to change occupations? To answer this question, the statistical analysis was first used to estimate the probability, or the likelihood, that the “typical” college-educated worker would switch occupations between 1988 and 1993. The typical, or benchmark, person is defined by the mean values of the characteristics of the workers in the sample.11 For non-Hispanic whites, the benchmark worker is U.S. born with a bachelor’s degree, 16.5 years of labor market experience, and married with one child under six years of age. Among Hispanics, the benchmark worker is U.S. born with ancestry other than Mexican, Cuban or Puerto Rican, has a bachelor’s degree, 14.5 years of labor market experience, and is married with one child under six years of age. Once the probability of switching jobs for the benchmark person has been determined it is possible to alter one characteristic at a time to determine the change in the likelihood of that worker changing occupations.

Table 8 shows the occupation-switching probabilities of white and Hispanic workers and the variation in those probabilities across workers with different characteristics. The data in the table show that there was a 28.5 percent probability that the benchmark white male worker changed occupations between 1988 and 1993. The likelihood of occupation change diminishes with education. For example, there was only a 21 percent chance that white males with a Ph.D. switched occupations between 1988 and 1993. That is consistent with the idea that highly educated workers with specific skills are matched better to their job.

Being an immigrant is associated with a slightly elevated likelihood of changing occupations. However, the probability climbs sharply if the immigrant is a new arrival—42 percent for white males who arrived three to six years ago—and does not speak English—65 percent for white males. An immigrant who is educated in the U.S. has a much reduced tendency—22 percent—to move from one occupation to another. Similar results emerge for white female workers, although it is worth noting that female workers in general reveal a higher proclivity for changing occupations.

Almost all male Latinos that do not speak English…are likely to have switched occupations between 1988 and 1993.

The benchmark Hispanic worker reveals a much higher tendency to change occupations in comparison to the benchmark white worker. In particular, the typical college-educated male Latino worker was likely to change occupations between 1988 and 1993 with a 45 percent probability. The probability among immigrant Hispanics is similar although, once again, it is found that the most recently arrived immigrants switch occupations with a much higher probability. Almost all male Latinos that do not speak English—85 percent to be exact— are likely to have switched occupations between 1988 and 1993. Having received an education in the U.S. does diminish the probability of shedding one occupation for another. The results for Hispanic males and females are very similar.

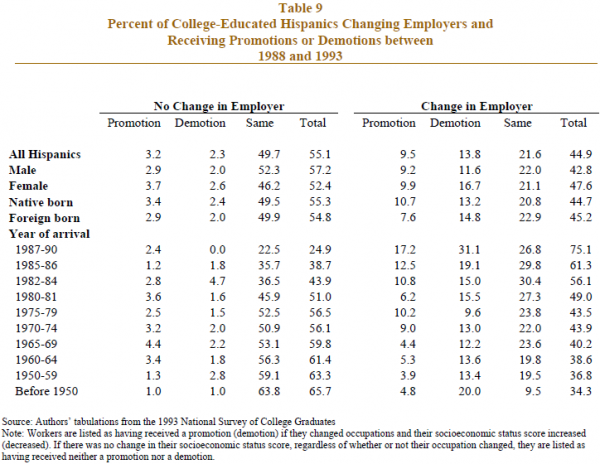
A change in occupation is often accompanied by a change in employer and the association between the two is presented in Table 9. The data in the table show the percentage of college-educated Hispanics that changed, or did not change, employers between 1988 and 1993 and whether there was a change in their occupational status. Workers are listed as having received a promotion (demotion) if they changed occupations and their socioeconomic status score increased (decreased). If there was no change in their socioeconomic status score, regardless of whether or not their occupation changed, they are listed as having received neither a promotion nor a demotion.

For all college-educated Hispanics combined, Table 9 shows that 45 percent changed employers between 1988 and 1993. This move was more likely to be accompanied by a demotion than a promotion. In particular, 13.8 percent of Hispanics switched employers and received a demotion while only 9.5 percent received a promotion with a change in employer. Nearly 50 percent of Hispanics saw no change in employer and socioeconomic status score. In fact, staying with the same employer was unlikely to yield either a promotion—3.2 percent—or demotion—2.3 percent. Almost exactly the same pattern emerges for Hispanic males, females and immigrants. It is somewhat notable that female Hispanics were more likely than men to receive a demotion with a change in employer.

The most distinctive pattern is associated with Hispanic immigrants who arrived between 1987 and 1990. Out of these recent arrivals, only 24.9 percent were with the same employer in 1993 as in 1988. That was less than the 31.1 percent of these immigrants who changed firms and received demotions at the same time. This rate of demotion is double that for all Hispanic combined. At the same time, however, 17.2 percent of recently arrived immigrants earned a promotion when they changed employers, a higher rate than for any other group of Latinos. Thus, Hispanic immigrants with only a brief history in the U.S. are also the most mobile workers moving both up and down the occupational ladder as they assimilate into the labor market.

VIII. Conclusions

This report has highlighted the stark differences in the occupational distributions and socioeconomic status of Hispanic and white workers. Hispanics are concentrated in lowwage occupations with minimal educational requirements and poor socioeconomic status. The record economic expansion of the 1990s did little to lessen the gap between Hispanics and whites. In fact, the opposite happened: the occupational distribution and status of Hispanics and whites grew even further apart during the 1990s. That was a consequence of a shift in the structure of employment across industries that affected the two groups of workers differentially. Thus, the recent gains in employment of Latino workers have not translated into improvements in their occupational status.

Hispanics are much more likely to work in farming, construction and production occupations than in professional occupations. The main exception to this rule is workers from Cuba. But this trait is highly characteristic of Mexican workers and is reinforced by immigration. Many immigrants from Mexico initially lack English-language skills and are unlikely to have a college education. Not surprisingly, Mexican workers are the dominant group among farm workers.

The Dissimilarity Index, a quantitative measure of the difference in occupational distributions, shows that about 20 percent of Hispanic workers would have to change occupations to match the occupational profile of white workers. This figure rises to 30 percent when Hispanic immigrant workers are compared with white workers. The leading cause of this disparity is the gap in educational attainment. The dissimilarity in occupational distributions is much smaller when comparisons are drawn only across college educated workers or only across high school educated workers. However, both in absolute terms and relative to whites, Hispanic workers are much less likely to have a college degree and that drives the overall disparity in the occupational distributions.

This study also devised a measure that can be used to measure the socioeconomic status of an occupation. On a scale of 0 to 100, the average score across all occupations is estimated to be 35. More than half of Latino workers are found to be working in occupations with socioeconomic status scores below 30. Many of those workers are employed in building and grounds cleaning, food preparation and serving, and farming, fishing and forestry. These three occupations score below 20 in socioeconomic status. White workers, on the other hand, are concentrated in occupations with above average scores. Over one-quarter of whites are employed in occupations with a socioeconomic status score of at least 45. These, typically, are occupations in managerial, professional, scientific and technical fields.

The leading determinants of occupational attainment are education and experience. For immigrants, English-language skills and time spent acquiring U.S. labor market experience also contribute to higher socioeconomic status. A college degree is found to boost the socioeconomic status of a worker by 40 percent over the score attained by high school graduates. The boost received by college-educated Mexican immigrants, albeit substantial, is less than average, suggesting that the labor market places lesser value on foreign schooling. Immigrant workers could also raise their occupational attainment scores by overcoming any English-language deficiencies they may have.

…most foreign-born Hispanic workers are unlikely to assimilate to full parity with white workers.

The analysis also finds that years spent acquiring experience in the U.S. labor market do make a difference but that most foreign-born Hispanic workers are unlikely to assimilate to full parity with white workers. Notably, the occupational attainment of immigrant cohorts appears to have slipped over time. The more recently arrived immigrants are further behind in occupational attainment than previously arrived cohorts. Factors that may have contributed to this phenomenon include changes in the regional origin of immigrants and the shift in immigration laws to favor family reunification.

A more detailed examination of the experience of college educated workers shows that Hispanics are more likely to change occupations than other workers within a five-year period. The greater likelihood of change extends to moves in both the upward and downward directions as measured by the socioeconomic status score. Even within the ranks of the college educated, the level and type of education is found to matter. Hispanics with post-graduate college education and tenure in U.S. schools are less likely to change occupations. Arrival date and language skills of immigrants also make a difference. Recent arrivals and immigrants who do not speak English have a very high probability of switching occupations and employers within five years. Overall, the process of assimilation for Latino immigrants, described here as the acquisition of U.S. labor market experience and finding the right match for their skills, involves a high rate of occupation and employer turnover in the early years even for the college-educated.