Rise, Peak and Decline: Trends in U.S. Immigration 1992 – 2004
The number of migrants coming to the United States each year, legally and illegally, grew very rapidly starting in the mid-1990s, hit a peak at the end of the decade, and then declined substantially after 2001.
About Pew Research Center
Pew Research Center is a nonpartisan, nonadvocacy fact tank that informs the public about the issues, attitudes and trends shaping the world. It does not take policy positions. The Center conducts public opinion polling, demographic research, computational social science research and other data-driven research. It studies politics and policy; news habits and media; the internet and technology; religion; race and ethnicity; international affairs; social, demographic and economic trends; science; research methodology and data science; and immigration and migration. Pew Research Center is a subsidiary of The Pew Charitable Trusts, its primary funder.
Rise, Peak and Decline: Trends in U.S. Immigration 1992 – 2004
The number of migrants coming to the United States each year, legally and illegally, grew very rapidly starting in the mid-1990s, hit a peak at the end of the decade, and then declined substantially after 2001.
I. Overview
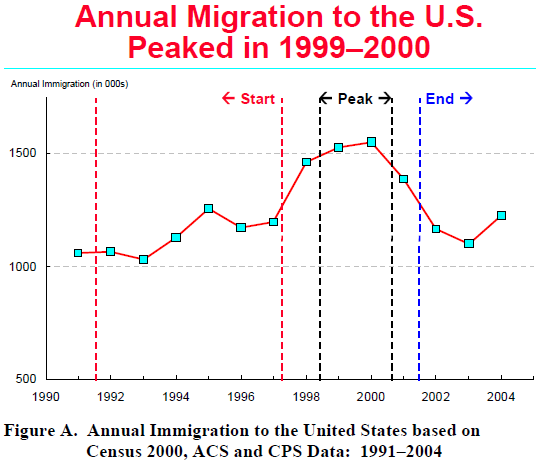
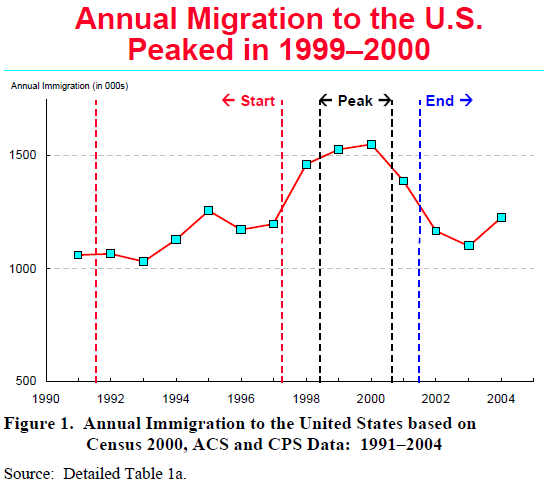
The number of migrants coming to the United States each year, legally and illegally, grew very rapidly starting in the mid-1990s, hit a peak at the end of the decade, and then declined substantially after 2001. By 2004, the annual inflow of foreign-born persons was down 24% from its all-time high in 2000, according to the Pew Hispanic Center analysis of multiple datasets collected by the Census Bureau and other government agencies.
Rather than undergoing a continuous increase in immigrant levels as is commonly perceived, the United States experienced a sharp spike in immigration flows over the past decade that had a distinct beginning, middle and end. From the early 1990s through the middle of the decade, slightly more than 1.1 million migrants came to the United States every year on average. In the peak years of 1999 and 2000, the annual inflow was about 35% higher, topping 1.5 million. By 2002 and 2003, the number coming to the country was back around the 1.1 million mark. This basic pattern of increase, peak and decline is evident for the foreign-born from every region of the world and for both legal and unauthorized migrants.
In 2004, migration bounced back to exceed 1.2 million. Whether or not this move portends further increases is impossible to predict. But even with this recent increase in migration, the most recent data show that immigration flows are at levels comparable with those of the mid-1990s and still significantly below the peak levels of 1999–2000.
Both the run-up to the peak and the drop-off in immigration coincide with a variety of conditions known to influence such flows, most notably the performance of the U.S. economy. Immigration grew sharply during the rapid economic and job expansion of the 1990s and then declined as the economy went into a downturn after 2001. Measures of the change in the Mexican labor force—the largest single source of U.S. immigrants by far—follow trends closely related to the pattern of changes in U.S. immigration. In tracking some trends related to migration, this report does not attempt to assess fully the many different factors that may have caused the rise and fall of immigration flows during this period, but rather illustrates changes in a few key macro-level indicators that mirror the pattern of immigration flows.
The simplest and most commonly available measure of migration to the United States is the size of the foreign-born population; it consistently reaches new highs each year. However, in demographic terms, the total number of foreign-born persons living in the United States at any given point in time does not measure, and can even be misleading concerning, the flow of migrants to the U.S.; i.e., the number of people coming to the country from abroad over a specific period of time. It does provide a measure of the foreign-born stock in the country. Likewise, the foreign-born stock provides a useful measure of the cumulative results of immigration (i.e., additions to the foreign-born population) and of two processes that subtract from the foreign-born stock (deaths among the foreign-born and emigration by the foreign-born).
In this report, a variety of data measuring flows are used to assess changes in migration levels from one year to another over the period from 1992 through 2004. During this period, the steady increases in the overall stock of the foreign-born population could create the erroneous impression that immigration flows themselves have been increasing inexorably at an accelerating pace. In fact, this report demonstrates that entries of migrants suddenly and rapidly accelerated in the second half of the 1990s and then decelerated with almost equal speed after 2001. According to our analyses of the available data, no other spike of these dimensions has occurred since the current era of increased immigration flows began in 1970s. Although the historical data are not strictly comparable, several roughly similar spikes occurred during the trans-Atlantic era of migration; the peaks in immigration then were associated with events such as the Irish potato famine, the end of the Civil War, the dramatic economic swings of the 1890s and 1900s, and World War I.
An accurate assessment of whether immigration flows are rising, falling or holding steady is essential to formulating and evaluating public policy on a variety of issues at the local, state and federal levels. Unfortunately, no single source of data adequately measures such flows. Much of the data supplied by immigration authorities is of little use because the data systems are used to measure administrative processes within the immigration bureaucracy and do not reflect the movement of people into the United States. Further, much of the inflow—a majority in recent years—arrives outside the legal channels. In order to assess recent immigration flows, the Pew Hispanic Center examined data from Census 2000 as well as from two yearly surveys conducted by the Census Bureau—the Current Population Survey and the American Community Survey. All three identify the foreign-born and ask when they came to live in the United States. Additionally, the two surveys ask respondents where they lived a year earlier. Altogether, these data produced at least five and as many as seven different measures of immigrant flows for each of the years examined. Each data source and survey question was analyzed separately to generate comparable measures of the number of arrivals for each calendar year. The individual sources produced different estimates of the level of the inflow in a given year, but all of the sources yielded the same basic pattern of a rise, a peak and then a decline at roughly the same points in time and the same rate of change. These results were then combined into an “average of averages” to produce a single, interpretable measure of immigration. While there is a range of estimates for the inflow in each year, the overall pattern of change over the period is supported by the full weight of the data.
Some of the major findings presented in this report:
Levels of Immigration Flows:
Immigration flows increased through most of the early and mid-1990s but to a limited extent and very gradually—growing from slightly more than 1 million in 1992 to about 1.2 million in 1997.
At the turn of the 21st century, immigration levels increased dramatically. This spike took the total inflow to more than 1.5 million in 1999 and 2000—a level about 35% higher than in the middle of the decade. This peak proved to be short-lived, though.
Since 2000, inflows of immigrants have decreased by about 25% to roughly the levels of the mid-1990s, returning to 1.1 million in 2003.
The most recent data show a slight uptick in the flow to more than 1.2 million in 2004. With this level of immigration, the foreign-born population will continue to grow, albeit at a slower pace than the rates reached around 2000.
Origins and Types of Immigrants:
With some variations, the same basic pattern of gradual increase, spike and then decrease holds true for migration from every region of the world.
Migration from Mexico followed the same overall trends. It peaked in 1999–2000 at a level more than one third above the inflows of the mid-1990s, then declined by about one quarter to 2002–2003 levels that were only slightly higher than those of the mid-1990s. Throughout this period, the Mexican share of total migration held relatively steady at about a third of the overall flow. However, there are indications in new data for 2004–2005 that Mexican migration is again increasing.
From 1992 to 2004, the unauthorized share of immigration inflows increased and the share that was legal decreased. By the end of the period, more unauthorized migrants than authorized immigrants were entering the United States.
Declines in legal immigration accounted for the largest part of the drop from the peak flows at the turn of the 21st century. From the peak in 1999–2000 to the trough in 2003, over 60% of the decrease in flow is attributable to lower levels of inflows of legal permanent residents and legal temporary immigrants counted as part of the population.
Destination of New Immigrants:
The shift of immigrant flows away from states with large foreign-born populations such as California and New York towards new settlement states such as North Carolina and Iowa accelerated during both the peak and the decline that followed.
The Pew Hispanic Center is a nonpartisan research organization supported by The Pew Charitable Trusts. Its mission is to improve understanding of the U.S. Hispanic population and to chronicle Latinos’ growing impact on the entire nation. The Center does not advocate for or take positions on policy issues. It is a project of the Pew Research Center, a nonpartisan “fact tank” in Washington, D.C., that provides information on the issues, attitudes and trends shaping America and the world.
II. Introduction
The number of immigrants living in the United States has been increasing steadily since 1970 as measured by the size of the foreign-born population in decennial censuses. Fueled primarily by immigration from Latin America—especially Mexico—and Asia, the foreign-born population grew from 9.6 million in 1970 to 19.8 million in 1990. In the last decade of the 20th century the numbers jumped dramatically by 57% to 31.1 million in Census 2000. Data from the Census Bureau’s Current Population Surveys (CPS) and other sources indicated that much of the growth in the 1990s took place in the second half of the decade. But significant questions remained: How much did the immigration flow increase in the late 1990s? After 2000, did the number of migrants added to the population every year continue to increase, level off or decline? And, more important, is there a basic long-term trend that produces steady year-to-year increases in the flow of migrants? Or, alternatively, are immigration flows variable from year to year and subject to factors, such as the condition of the U.S. economy, that cause them to increase or decline? How the volume of immigration has changed in the face of the dramatic economic swings of the past decade, the reactions to September 11 in terms of popular attitudes and official enforcement efforts, and attempts to tighten U.S. borders and admission procedures is not easy to address with standard measures of immigration.
To address these issues, the Pew Hispanic Center analyzed data from several sources collected by the Census Bureau and developed estimates of the number of foreign-born persons flowing into the country on a yearly basis for 1992 to 2004. (See “Measurement Methods” below.) These figures must be considered approximations of the true level of immigration since they represent averages across several data years, several different measures, and multiple, repeated measures for some of the methodologies used. Although data sources produced different numbers for the flow in a given year, all the sources yielded the same general pattern of change over the period: Immigration flows increased gradually through most of the 1990s, spiked dramatically at the end of the decade and then fell back after 2001 to the levels registered in the mid-1990s.
The spike was significant both in absolute numbers and in percentage change. The peak immigration flows in 1999 and 2000 reached at least 1.5 million people a year (1.8 million by some measures), roughly 400,000 more than the troughs before and after. (See Figure 1 and Summary Table A.) In retrospect, it is now clear that the surge in immigration flows that occurred at the end of the 1990s was a discrete event with a beginning, middle and end. The extremely high flows at the end of the past decade were not the norm, nor part of a long-term trend, but rather the peak of a momentary increase that lasted for only a few years. Thus, even as the United States consistently experiences historically high rates of migration, flows are subject to considerable variation. If levels surge again, the change will mark a new episode in the long saga of immigration into the United States, and so too if they decline sharply.
As will be detailed below, both the increases and decreases in migration flows over the past 15 years coincided with sharp changes in the U.S. economy. Immigration increased rapidly as the United States experienced a record expansion at the end of the 1990s, and the flows dropped after 2001 as the U.S. economy went into a prolonged downturn. As economic growth resumed in 2003 and 2004, migration levels showed signs of increasing again. This same basic pattern held true for migration flows from every region of the world as immigrants came at roughly the same pace from countries and regions that were experiencing economic booms and those undergoing hard times. The correlation of U.S. economic trends to migration levels rather than the trends in immigrant-sending countries clearly suggests that the demand for immigrant labor in the United States is a powerful factor is determining migration flows. Just as the U.S. economy experiences distinct episodes of expansion and contraction, migration levels can also be expected to rise and fall with them.
III. The Migration Flow Peaked in 1999–2000
At the start of the 1990s, immigration flows had reached historically high levels of more than a million people a year. (See Detailed Table 4 and Figures 8–9.) In the early and middle parts of the 1990s, the annual numbers held relatively steady at around 1.1 million people a year. Depending on the measure used, the flows started increasing between 1995 and 1997 towards about 1.2 million per year (Detailed Table 2a).
By 1999, immigration levels had increased substantially to the point where the average inflow during the peak period of immigration—a period encompassing 1999–2000 in most estimates and extending a year in either direction in some—reached at least 1.5 million per year. Again, this figure is “an average of averages” that may actually understate the inflows of immigrants, since about 1.8 million arrived in 1999 according to data from Census 2000 (Detailed Table 2a). The average annual level of immigration during this peak period is about 400,000 greater than during the mid-1990s, or about one third higher (Detailed Table 1a).
After 2001, the annual inflow of immigrants slowed a bit and decreased to a level of 1.1 million to 1.2 million per year. Thus, average annual immigration declined by about 300,000 to 400,000 per year or at least 20% below the peak. With the decrease, immigration appears to have returned to roughly the levels of the mid-1990s. However, some data from the most recent March CPS and the American Community Survey (ACS) give contradictory pictures of current flows; some measures suggest continued lower levels of inflows, but others point to very recent (i.e., late 2004 and 2005) increases in migration from Mexico and Latin America. According to these measures, migration flows could again be approaching 1.3 million a year and moving upward.
All the measures and data sources, however, are consistent in telling the same basic story: Migration flows gradually increased in the mid-1990s, grew very rapidly at the end of the decade, peaked for two or three years and then fell off after 2002, returning to roughly the same levels as before the run-up. (See “Measurement Methods” and Figure 10.)
IV. Changes in the Composition of Immigrant Flows
Different types of immigrants (grouped for example by legal status, country of origin or racial/ethnic composition) tended to have similar patterns of change through the upward trend and the subsequent downturn. However, some experienced different trends and certainly not all groups changed at the same rate. Consequently, the changing levels of immigration over the past decade have also resulted in some shifts in the composition of the immigrant inflow. At the end of the 1992–2004 period, the country-of-origin and racial/ethnic mix of the immigrant inflow was basically unchanged from the initial period, notwithstanding a changed mix at the peak. The most notable change over the period was the marked decrease in the share of immigration accounted for by legal permanent residents (i.e., legal immigrants).
Legal Status
The mix of legal and unauthorized migrants in the flow changed considerably from 1992 to 2004. The inflow of legal permanent immigrants (LPRs, or “green card” holders) increased only very slightly (3%) from the mid-1990s to the peak around 2000. On the other hand, annual arrivals of both unauthorized migrants and legal temporary migrants (or “legal nonimmigrants”) increased by substantially higher rates. The increase to the peak for unauthorized migrants was 36% and for legal nonimmigrants, 68% (Summary Table A and Detailed Table 1a).
During this period, immigration laws governing admissions did not change in any significant way to affect the number of new arrivals,1 so it is not surprising that the number of legal immigrants did not increase when the other two groups did. Moreover, the very large number of immediate relatives of immigrants who acquired legal status under the Immigration Reform and Control Act of 1986 (IRCA) accounted for a large number of both new arrivals and status adjustments beginning in the early 1990s. By the end of our observation period, the pool of potential immigrants in this group had become smaller. By 2001, increased security requirements leading to processing delays and shrinking ceilings for refugee admissions resulted in fewer admissions of LPRs. In the case of nonimmigrants, the increase during the peak period was fueled, in large part, by an increased demand for temporary workers, especially high-tech workers, and was facilitated by a large increase in the number of visas available. For unauthorized migrants, heightened demand was almost certainly a large factor in the increase as this period coincided with heightened efforts by the federal government to control illegal crossings of the Southern border.
After 2000, annual levels in all three major categories of legal status groups (legal immigrants, unauthorized migrants and legal nonimmigrants) decreased at roughly equal rates— by about 30%. But, because legal immigration had increased less in the run-up to the peak, it ended up at considerably lower annual levels than it had been in the mid-1990s, both in absolute and relative terms. By 2004, the number of legal immigrants arriving in the U.S. was about 30% below the levels of the mid-1990s. While legal immigrants accounted for about five in ten of all new arrivals before the peak, they represented only about four in ten afterwards. For unauthorized migrants, the reverse is true; they represented fewer than four in ten new immigrants before the peak and almost five in ten afterwards. Moreover, in absolute numbers, the flow of legal immigrants had been significantly larger than the flow of unauthorized immigrants in the mid-1990s. Both groups arrived in roughly equal numbers during the peak and immediately afterwards, but, by 2003 and 2004, more unauthorized migrants than legal immigrants arrived each year. The annual numbers of legal immigrants arriving since the peak is actually lower than it was in the mid-1990s while the number of unauthorized migrants in the annual inflow has returned to roughly the same levels.
National Origins, Race and Ethnicity
The racial/ethnic composition of the immigrant inflow was almost identical at the end of the 1992–2004 period as at the beginning (Detailed Table 1a). But, during the peak period of 1999–2000, the representation of white2 immigrants was higher and of Asians lower than either before or afterward. With the exception of a few isolated years, Hispanics made up roughly the same share of annual immigration throughout the entire period—just about half of annual inflows. Thus, the percentage increase to peak and decrease from the peak for Hispanics was about the same as the overall rates of increase and decrease (Summary Table A and Detailed Table 1a). White and Asian immigration moved in opposite directions relative to one another during these periods. White immigration increased by the highest percentage to the peak—about 60%; Asian increase was the smallest—19%. The reverse was true for the decrease from the peak as white immigration decreased most rapidly and Asian the least. As a result, the white share of incoming immigrants was higher at the peak than it had been previously, but by 2002– 2004 the overall racial distribution was essentially identical to 1992–1997.
The differences in patterns of change for racial/ethnic groups reflect underlying legal status differences among the race groups and how the changes in admission and arrival patterns by status (described above) played out over the 1992–2004 period. Asian and European countries account for very large shares of legal temporary migrants, especially students, intracompany transfers and high-tech guest workers. Because of historic declines in legal admissions from Europe and, to some degree, Canada, LPR numbers from these areas are relatively low so that the legal temporary migrants account for a large share of all immigrants from these areas. Thus, the patterns of change in white immigration are largely driven by changes in legal temporary migration. Hence, the relatively large increase to the peak and the subsequent decline.
In the case of Asians, most of the migration is by LPRs and refugees, with relatively small shares of both unauthorized and legal temporary migrants. Even though migrants from Asia account for a large share of the legal temporary flow, these migrants are only a small proportion of the total flow from Asia. Thus, the patterns of change for Asian migration during the 1992–2004 period are driven largely by the changing flows of LPRs from Asia. This group did not increase a great deal to the peak, nor did it decrease much. This pattern is reflected in the changing flows from Asia.
The distribution of immigrants by country of birth changed hardly at all over the 12-year period we examine (Detailed Table 1b). Mexicans accounted for roughly a third of the total throughout with the rest of Latin America contributing another fifth. Migrants from Canada and Europe accounted for nearly one seventh of the flow and the rest of the world the remainder. This rough distribution remained remarkably stable as the total annual flow underwent dramatic changes. The basic pattern of increase, peak and decline was apparent in migratory flows from all over the world although some source countries and regions experienced sharper increases and drops than others.
Mexico represents by far the largest source of immigrants and is sending about 400,000 migrants each year. But Mexican immigration reached a level of at least about 500,000 per year at the peak period of 1999–2000. (See also Figure 4.) These measures, being averages of averages, tend to smooth out peaks and valleys; thus, by some measures, Mexican inflows to the U.S. appear to have exceeded 650,000 per year at the highest levels (Detailed Table 2b). While the data show a clear downturn in Mexican immigration during 2002–2003, some of the most recent data point to the possibility of a sizable increase in Mexican immigration levels by 2004, albeit to levels still lower than the 1999–2000 peaks.
The data for Mexican arrivals also show a localized peak in 1995 (Figure 4 and Detailed Table 1b). It is not clear from the data we examined whether this short-lived uptick represents a problem with reporting by respondents or a real increase. Mexico did experience economic problems in 1994–1995 that could well be associated with short-term increases in migration. Moreover, this one-year increase occurs in four of the five estimation methods (Table 2b), which suggests that the increase was real and not a reporting anomaly. The fact that the one-year peak in 1995 also occurs for immigrants from other Latin American countries further supports the notion of a real increase for the year.
Trends from other broad regional aggregations followed much the same trends as Mexican migration (Figure 4 and Detailed Table 1b). The rate of increase to the peak was higher for European/Canadian migrants and lower for Asians. These differences were offset by larger rates of decline from the peak for Europeans and smaller rates for Asians. These patterns lead to a virtually identical distribution of immigrants at the beginning and end of the period. The region of birth differences also largely reflect the legal status differences in composition, as discussed above for race/origin groupings. Individual countries do not necessarily adhere to the same regional patterns. For example, immigration from India registered the sharpest increase prior to the peak of any major source country—a spurt that produced a 77% increase in the annual flow, much higher than even the Mexican migration (Detailed Table 1b). This increase reflects the composition of the migration stream in that India was one of the major beneficiaries of the increased number of visas made available to high-tech workers in the peak period.
V. Changes in the Destinations of Immigrants
Another significant shift occurred in the destinations of immigrants within the United States. The well-documented shift of new immigrants away from traditional settlement areas, such as California and New York, and to the so-called “new growth” states3 (Passel et al. 2002, Kochhar et al. 2005) is quite apparent in these data, as the share going to these two large states dropped from 37% in the mid-1990s to about 30% at the circa-2000 peak (Detailed Table 1c and Figure 5). The changes over time were certainly not uniform among the major receiving states. California and New York lost significant shares of the immigrant inflow between 1992 and 2004. New York was unique among these states in that it did not experience the 1999–2000 peak and actually had less immigration than in 1992–1997; immigration to New York continued to fall after 2000. Florida and Texas received slightly larger shares of the immigrant flow in 2002– 2004 than in 1992–1997, unlike the other four large receiving states.
The share of immigration flows settling in the new growth states increased throughout this period. These states received 23% of new immigration during the 1999–2000 peak as compared with 19% in the initial period. Further shifts occurred as immigration levels declined from their peak as the new growth states continued to increase their share of new immigration to 25% of the total. (In the decline, the share going to California and New York dropped a little further to 28% of new arrivals.)
These data point to even further geographic diversification than do many other studies, as states other than the new growth states (the “other states” in Detailed Table 1c) also showed increases in both the share and the number of new immigrants settling there. The “other states” share increased to 18% from 16% in the mid-1990s, representing a growth of 59% in the number of new immigrants going to these states. After the peak period, these other states maintained their increased share of new immigrants. Thus, the shifting of immigrant settlement to new destinations is not just a short-lived phenomenon associated with the peak levels of immigration; it continued even as immigration decreased from the 1999–2000 peak.4
VI. Mexico-U.S. Migration and Related Factors
The pattern of rise, peak and decline evident in total immigration flows coincides closely with a similar pattern in the performance of the U.S. economy, and the correlation is particularly strong with the flow from Mexico. During the period of increased migration prior to the peak, U.S. employment increased by 1.59 million in 1993, the first full year of recovery after the 1991 recession; even greater increases in U.S. employment followed and 1.85 million jobs were added in 1998. The annual number of migrants coming from Mexico increased from about 332,000 to 507,000 over the same period. (See Detailed Table 5a.) In 2000, both the U.S. expansion and the growth of Mexican migration reached a peak. That year the U.S. economy added nearly 3.4 million jobs and migration from Mexico crested at an estimated 530,000 new arrivals. In the decline phase, the U.S. economy lost 415,000 jobs in 2002 and, while migration from Mexico continued, it dropped to 378,000.
As the U.S. economy regained momentum in 2003 and 2004, the pace of Mexican migration picked up also. Detailed studies of the U.S. labor market during this recovery phase show that there has been heightened demand for low-skilled, low-wage workers largely because the construction industry has been responsible for much of the new job creation while other sectors such as manufacturing have continued to contract (Kochhar 2004 and 2005). Recently arrived Hispanic immigrants have constituted a disproportionate share of the new workers hired into the construction industry, according to these studies.
The annual flow of migrants from Mexico over the 1992–2004 period appears to be more closely correlated to macrotrends in the U.S. economy than in the Mexican economy. Of the variables we examine, changes in the rate of U.S. employment correlate most strongly, at 0.90. (See Detailed Table 5a and Figure 6.) Other U.S. economic variables have correlations of 0.40– 0.50 whereas the correlations for Mexican macroeconomic indicators vary from about -0.23 to – 0.30. (See Detailed Tables 5a-5b.) These patterns suggest that during this period the “pull” factors have been somewhat more powerful than the “push” factors in determining short-term migration levels.
The Mexican economy underwent a severe crisis in 1995 that produced a dramatic 6.2% drop in the country’s gross domestic product (GDP) that year (Detailed Table 5b). By the time migration levels peaked in 1999 and 2000, the Mexican economy was in a full-blown expansion phase, registering 6.6% GDP growth in 2000. Although the economy recovered quickly, the migration impact of a sharp downturn can stretch out as discouragement gradually produces decisions to seek work in another country. Moreover, the expansion’s impact on migration was somewhat muted because productivity gains in Mexico outpaced job creation. As a result, even when it was growing robustly at the end of the decade, the Mexican economy was not generating enough jobs to absorb all new entrants to the labor market. Following 2001, the Mexican economy experienced a downturn in sync with the U.S. economy. Indeed, with much of its economy linked to the U.S. market under the North American Free Trade Agreement, Mexico’s business cycle now very clearly mirrors trends in the U.S. economy.
Macro-economic trends alone do not determine migration flows. A variety of other factors also influence the number of people moving from one place to another, and these can include everything from border controls in a receiving country to agricultural support policies in a sending country. An overarching factor is the operation of family networks that link migrants to relatives left behind. These networks can greatly facilitate new migration by providing access to housing, information about work opportunities and the comfort of familiar faces in a new land. The annual migration flows to the United States, particularly those from Mexico, suggest that all of these factors, especially family networks, combine to create the conditions for the high and increasing levels of immigration recorded for more than two decades. Specific economic circumstances such as the U.S. boom of the late 1990s and the subsequent downturn can then provide the stimuli for specific and contained fluctuations in migration levels of the sort described here.
VII. Measurement Methods
Problems with Existing Measures
Although there have been occasions in the past when immigration has been higher in relation to the size of the country’s population, the number of immigrants coming to the United States has reached unprecedented levels in each of the last three decades (Figure 8). Accurate measurement of immigration is important for developing measures of the total U.S. population and for formulating and evaluating public policy on a variety issues at the local, state and federal levels. Unfortunately, the United States does not have very good data on the numbers of new immigrants arriving in the country each year and no single source of data adequately measures such flows. Available data from immigration agencies are generally designed for administrative purposes rather than as measures of the number of people moving into the United States; immigrants arriving outside legal channels have increased numerically and as a share of the total inflow. Some of the serious measurement and tracking issues include:
Legal immigration is conventionally measured as the number of persons getting legal permanent resident status (“green cards”) in a given year. This number bears little relationship to the demographic concept of immigration, which is the number of people moving into the country during the year. In particular, well over half of those getting green cards are “adjusting status” because they are already in the United States (Detailed Table 3). Further, the total number of green cards each year fluctuates wildly because of processing backlogs and resource allocation decisions made formerly at the Immigration and Naturalization Service (INS) and now at the Department of Homeland Security (DHS). Thus, the annual number of new-arrival green cards stayed within a fairly narrow range for 1995–2002, averaging about 390,000 per year, with the highest level exceeding the lowest by only about 18%. In 2003–2005, new arrivals dropped slightly to about 360,000 per year. In contrast with the relatively smooth pattern of change in new arrivals, the number of status adjustments varied from a low of 245,000 in 1999 to a peak almost three times as large at 680,000 in 2002.5
Large fluctuations in the number of immigrants arriving in the United States have occurred at various times in the nation’s history, notably during and after the Civil War, coincident with economic swings in the late 19th century, and before and after World War I (Figure 9). From the 1930s through the 1980s, variability in annual admissions decreased substantially. Since then, large swings in admissions have again become the norm. Unlike the situation a century ago, however, the current fluctuations do not seem to reflect real changes in the numbers of people entering the country or the numbers wanting to come. While the pattern of annual flows portrayed in the foregoing analysis is very roughly mirrored in the federal government’s administrative data on the processing of key categories of legal immigrants and visitors, the increases in “green cards” and arrivals of students and other temporary migrants that occurred through the 1990s to 2001 and then the subsequent declines appear to reflect processing backlogs, security delays and other developments that followed the September 11 attacks.
Significant numbers of temporary migrants arrive in the United States each year with legal nonimmigrant visas. The vast majority of legal nonimmigrants are not immigrants per se but visitors who are coming as tourists or for business.6 The largest numbers of temporary migrants who could be considered U.S. residents enter as students (F visas and M visas), highly skilled guest workers (H-1B visas), and intracompany transfers (L visas). The data systems for tracking arrivals and residents have improved to some degree but still do not provide the data needed to measure immigration inflows accurately—specifically, how many people have newly entered the country, how many have left and how many have acquired other statuses.7
Large numbers of immigrants arrive without authorization. In recent years, estimates suggest that this group is the largest of the three. While techniques have improved substantially to the point where there seems to be broad agreement that the unauthorized population has reached or exceeds 10 million (Passel 2005), the available data do not accurately measure year-to-year changes as would be needed to measure inflows.
Measures of the size and composition of the foreign-born population have traditionally drawn on data from the decennial census and two annual surveys conducted by the Census Bureau—March Supplements to the Current Population Survey (CPS) and the American Community Survey (ACS). These data provide an excellent basis for assessing impacts of immigrants. However, comparison of the size of the foreign-born population from one year to the next is not an adequate method for measuring annual changes in size or for measuring inflows. With the number of foreign-born residents reaching 35 million, the standard error (or sampling variability) of the annual change is so large that the year-to-year difference can vary substantially due to random measurement factors. Thus, while the overall trend in foreign-born growth is clear from the annual population totals (Detailed Table 3), it seems unlikely that the annual changes fluctuated between about 84,000 as measured by the 1995–1996 CPS difference to the more than 1.9 million difference between the 1999 and 2000 CPSs. The larger samples of the ACS seem to produce less fluctuation in measured change in the foreign-born population, but other problems remain before year-to-year changes can be converted into inflow estimates.
Annual inflows of new immigrants account for only part of the annual change in the foreign-born population. In demographic terms, there are three components that account for changes in the size of the foreign-born population. The largest is the arrival of new immigrants, now numbering well over 1 million per year. The other two are deaths of immigrants living in the country and outmigration (emigration) of former immigrants. Neither of these flows is small. During the 1990s, deaths of the foreign-born averaged 200,000 to 250,000 per year. This component can be measured directly by vital statistics and its adequacy can be assessed with conventional analysis of mortality data. However, measurement of emigration has been especially problematic. Original estimates for the 1990s were about 275,000 per year (Robinson 2001; Passel 2001). However, new estimates (Van Hook, et al. 2004) suggest that true levels of emigration were probably somewhat higher. Unfortunately, even with current methodological improvements, the available methods and data do not permit development of precise annual estimates of emigration required to convert changes in the foreign-born population into measures of newly arriving immigrants.
VIII. Immigration Measures from the Census, ACS and CPS
Our goal of measuring trends and patterns in annual immigration—specifically in the number of foreign-born persons coming to the United States in a given year with the intention of living in the country—and its characteristics thus requires expansion of the data and methods brought to bear on the problem. In assessing immigration levels and trends, we use three sources of data:
(1) The March Supplements to the Current Population Survey, the annual socioeconomic supplement to the U.S. government’s monthly labor force survey, for 1994–2005, with two different weighting schemes, one covering 1994–2001 and the other overlapping to cover 2000–2005;
(2) Sample data from Census 2000; and
(3) The American Community Survey (ACS) national sample for 2000–2004.8
Two different types of data from these sources enter into our measures. The March CPSs and the ACSs include a question asked of all respondents at least 1 year old about residence one year earlier. Thus, the number of foreign-born who lived abroad one year before the survey data provides an assessment of the inflow of immigrants in the year before the survey. The estimates coming from the analyses of this question, particularly from the CPS,9 give figures slightly lower than other measures, but, as we will see, the pattern of change across the 1990s and 2000s is consistent with other measures.
The CPS, Census 2000 and the ACS all ask immigrants when they “came to live in the United States.” While there is some controversy about the interpretation of these data in relation to new arrivals of immigrants,10 their use to assess migration flows is well established and the results track well with other measures. Our approach involves averaging arrival cohorts across several survey years for both the ACS and CPS. It is also necessary to annualize the CPS estimates because the data are only available for arrival in groups of years, not for single years.
Further complications are introduced by the use of CPS data spanning the 1994– 2005 period. CPS population figures arise out of a complicated weighting process that uses postcensal population estimates, generated by the Census Bureau and benchmarked to the previous census. In most decades, this switch in weighting from the previous census to a new one introduces only minor discontinuities. However, the Census Bureau underestimated the population count from Census 2000 by almost 5 million persons (Passel 2001) so that CPS data developed with weights based on the 1990 Census differ considerably from similar data developed using weights based on Census 2000. The two groups most affected by the reweighting that occurred officially for March 2002—Asians and Hispanics—are immigrant-dominated populations. Thus, the reweighting process had a marked effect on the size of the foreign-born population as measured by the CPS. Because of the magnitude of the changes introduced by the weighting change, the Census Bureau has released two transitional, overlapping CPS datasets. For March 2001, there is an entire alternative dataset available for producing measures consistent with data from 2002 and later.11 For March 2000, the Census Bureau supplied an alternative set of weights consistent with the regular March supplement and Census 2000 (Passel 2001). Thus, we have two CPS measures for 2000 and 2001 to help assess the impact of the new census results on measures of immigrant inflows.
Year/Period of Arrival
The CPS, the ACS and Census 2000 all include a series of questions asking place of birth, citizenship and the year that respondents born outside the United States “came to live” in the United States. These questions define the immigrant or foreign-born population as persons born outside the United States who were not US citizens at birth. The estimates in Detailed Tables 2a–2d3 labeled “arrival” are derived from the Census, ACS and CPS questions on the year that respondents came to live in the United States.
Census 2000. The estimates from Census 2000 use the 5-percent Public-Use Microdata Sample (PUMS) as augmented with assignments of legal status (Passel, Van Hook and Bean 2005). The estimates are straightforward tabulations of the foreign-born population for single years of arrival by race/Hispanic origin,12 legal status, country of birth or state of residence. The only estimation required is for the year 2000. Census data for arrivals in 2000 are incomplete because the census enumerates persons at their residence as of April 1, 2000. Persons entering the U.S. after April 1 should not be included in the census count; however, the census enumeration process actually spreads over a period of several months after April 1 as enumerators collect information from persons who failed to respond initially to the Census. Accordingly, we treat the data for persons arriving in 2000 as representing one third of the entrants during the calendar year rather than the one fourth share implied by the Census date. Thus, the estimate from the 2000 PUMS of 589,000 immigrants arriving in 2000 is inflated to the figure of 1,765,000 for the full year shown in Detailed Table 1a.
American Community Surveys, 2000–2004. The detailed data collected in the American Community Survey are basically the same as collected in the sample phase of the Census. The ACS design, however, differs in that the survey consists of non-overlapping samples collected on a monthly basis over the course of the calendar year rather than the traditional census or survey method of collecting all data for a specific reference date. For our ACS-based estimates, we again use tabulations from the PUMS. For 2000–2004, the ACS was not in full production; the sample size will be 250,000 households per month, or 3 million per year, but during testing the ACS had a nominal sample size of 700,000 households over the course of the calendar year. Because only about one third of nonresponses are followed up in the ACS, the actual sample size for each year was about 480,000.13 The ACS, as implemented for these years, covers only the household population, not the whole population, of the United States; accordingly, the ACS figures for immigrants are slightly less than the Census values in 2000 and are a bit lower in other years than the entire U.S. total would be, were it available.
As with the Census-based estimates, we use straightforward tabulations of the foreign-born population by single years of arrival from the ACS as our initial estimates for race/Hispanic groups,14 countries of birth and states of residence. There are several data-driven limitations to the ACS estimates, though. Because of the smaller sample size of the ACS, not all of the countries of birth coded in Census 2000 were available in the ACS; the impact of this limitation is small, however, since all large sending countries are separately identified in the data. We did not generate estimates of inflows by legal status because the status assignments have not been done with ACS data.
The ACS estimates for each year of arrival presented in Detailed Tables 2a–2d3 are an average of the five individual ACS estimates (i.e., from the 2000–2004 ACSs). The principal technical issue in developing these averages is the handling of estimates of the number of immigrants arriving in the year of the survey, because the data are collected throughout the year rather than at the end of the year. Thus, the tabulated ACS data from 2003, for example, do not generate an estimate of the full number of immigrants arriving in 2003. This deficiency affects the estimates for 2000–2004 only, not those for years before 2000. Immigrant arrivals in each year through 1999 are averages of five individual estimates. For the 2000–2003 estimates, the survey conducted in the year of the estimate is dropped from the average; that is, the average estimate for 2000, as shown in Detailed Tables 2a–2d3, is based on four separate estimates from the 2001–2004 ACSs; for 2001, from the three ACSs of 2002–2004; for 2002, from the two ACSs of 2003–2004, and for 2003, from the 2004 ACS alone. The estimate shown for 2004 is obtained by inflating the partial-year data from 2004 to a full-year estimate. The inflation factor for 2004 is the average of factors for 2000–2003 obtained by computing the ratio of the partial-year estimate from the year’s survey to the full-year estimate from the next year’s ACS. For example, the inflation factor for the 2000 ACS is the ratio of immigrant entries in 2000 from the 2000 ACS (a partial year) to immigrant entries in 2000 from the 2001 ACS (a full year).
Current Population Surveys, 1994–2005. The Current Population Survey is the U.S. government’s labor force survey that provides the monthly data used for the official measure of the unemployment rate. Beginning in 1994, the information needed to identify immigrants and to measure immigration (country of birth, citizenship and year of entry) was added to the data collected in the basic CPS and its supplements as part of the redesign process done every decade. The regular monthly CPS is a complex state-based sample of about 50,000 households; each month’s sample overlaps with the previous year and adjacent months to minimize the variance of estimates of month-to-month change in employment. In March of every year, the sample size is increased by augmenting it with CPS households from other months; the data collected are greatly expanded also. The additional data include information on income (by source of income), health insurance, participation in social programs, detailed labor force history and a variety of other items. The CPS universe is the civilian, noninstitutional population; this universe is larger than the ACSs—the household population—but smaller than the Census’s universe—the total population.
Through 2001, the March CPS expansion increased the sample size by about 10% over the regular monthly sample to 55,000 households by doubling the sample of Hispanic households. The weights for the CPS are based on the Census Bureau’s population estimates obtained by updating the previous census. So the population estimates for the March 1994–2001 CPSs are based on the 1990 Census, as corrected for undercount, using detailed national estimates by age, sex and race; national estimates by age, sex and Hispanic origin; and state estimates of the population aged 16 and over. In general, figures for the foreign-born population from these 1990-based CPSs are less than those from 2000-based CPSs.
In the post-2000 redesign of the CPS, the March supplement sample size was increased substantially to about 80,000 households by oversampling households with children and minority households other than Hispanics (which were already oversampled).15 The weighting scheme was also changed. The weights for the post-2000 redesign are based on Census 2000, without a correction for undercount, using the same detailed national categories for age, sex and race; national estimates for age, sex and Hispanic origin; and state estimates but for all ages and with detail by broad age groups, sex and simplified race groups. The redesigned questionnaire, expanded sample and new weighting scheme were introduced for the March 2002 supplement. Beginning in 2003, the race question was changed to allow for multiple responses as in Census 2000 and the ACS; to incorporate these new race data, the weighting categories were adjusted slightly by placing all persons with multiple race responses into a separate weighting group. For March 2001, the Census Bureau tested the entire redesign including the greatly expanded sample (but not the new race question) and released a separate set of CPS data for that year that are consistent with the data for March 2002 and later. In addition, for the March 2000 supplement, the Census Bureau produced a special set of CPS weights consistent with the population as enumerated in Census 2000 rather than the official CPS data for March 2000 which are weighted to a population estimate based on the 1990 Census carried forward to 2000. As a result of the redesign and testing, we have a series of March CPS supplements for 2000– 2005 that are consistent with Census 2000 and that overlap for two years with the 1990-based series of 1994–2001.16 We use the CPS supplements to produce two separate series of immigration estimates by race, by country of birth,17 by legal status18 and by state of residence— a 1990-based series and a 2000-based series.
Producing annual estimates of immigrants arriving from the CPS question on year of arrival in the United States is more complicated than the analogous process for Census 2000 and for the ACSs of 2000–2004. Although the CPS collects information on year of arrival for every year, the data released to the public group the responses into intervals. Thus, for the period of interest (i.e., 1992 and later), the CPS provides information only for two-year periods of arrival, beginning with even-numbered years; that is, the data responses are coded as arrived in 1992–93, 1994–95, 1996–97, etc. To produce annual estimates of arrivals, we assign each year of the two-year period the same value equal to one half of the estimate for the two-year period. A further complication is introduced because the most recent period of arrival in every CPS is expanded to include the current year of the survey. Also, since all of the coded intervals must begin with an even numbered year and must include at least two full years (according to the Census Bureau’s data disclosure standards), the most recent period of arrival is coded to cover three full years plus the partial year of the survey in odd-numbered years. Since the March CPS interviews are done during the week including March 19, the most recent arrival period shown in even-numbered years covers two full years and 2.5 months (i.e., 1992–94 for the March 1994 CPS; 1994–96 for March 1996, 1996–98 in March 1998, etc.). In odd-numbered years, the most recent period of arrival encompasses three years and 2.5 months (i.e., 1992–95 for the March 1995 CPS; 1994–97 for March 1997, 1996–99 for March 1999, etc.). To estimate annual arrivals by calendar year for these most recent periods, we divide the number of immigrants arriving in the interval by the number of years covered (either 2.208 or 3.208) and assign the average value to each year covered by the interval, including the year of collection. This averaging across periods tends to smooth out the time series of estimates and produce estimates that change in “steps” when compared with the series from the ACS and Census. (Note, for example, in Detailed Tables 2a–2d3, that the 2000-based CPS values for immigrants arriving during 1990–1999 are identical in adjacent years whereas the ACS and Census estimates vary from year to year.)
The CPS-based estimates from the period of arrival data are also averaged across multiple CPSs. Because of sampling variability and attrition of some arrival cohorts due to the combined effects of small sample sizes, emigration and mortality, not all of the CPSs could be used for every estimate year. However, all periods of arrival, with a very few exceptions, draw on data from at least three CPS supplements; the following table details the supplements used to estimate arrivals for each calendar year:
In averaging the annual estimates across multiple CPS observations, each CPS is given an equal weight except that the annualized estimates for the year of the CPS supplement (e.g., the estimate for 2002 based on the March 2002 CPS) are only weighted at 0.208 or a weight equivalent to an observation covering 2.5 out of 12 months.
Because of the multiple averaging involved in developing estimates for calendar year arrivals from CPS data, the CPS-based time series of arrivals tend to be smoother than the other estimates (Detailed Tables 2a–2d3). Because they are averaged across time and CPSs, the increases to peak values tend to start a year earlier than other estimates, the peak values sometimes last a year longer than other estimates, and the declines from the peaks tend to start a year later than in some series. There are substantial differences in the estimates developed from 1990-based CPS weights (the series for 1994–2001 CPS data) and those developed from the 2000-based CPS weights (the series for 2000–2005 CPS data). The 1990-based population estimates were substantially different from the population figures that emerged from Census 2000. Specifically, the 1990-based population estimates understated the Hispanic and Asian populations by a bit more than 10%, with some of the age-sex groups (e.g., Hispanic males ages 20–29) falling as much as 20 to 30% below the Census 2000 counts. Further, the state-level estimates for states that were new destinations for immigrants, especially for Hispanic immigrants, were lower than Census 2000 counts, especially for the minority populations in these states. The introduction of Census 2000-based population data into the weighting process thus led to significantly higher figures for immigrants. The overall foreign-born totals, in Detailed Table 3, show that the 1990-based totals for 2000 and 2001 are about 6% less than the 2000-based figures. The impact of new weights is, of course, much larger for Hispanic and Asian populations and for more recent arrival cohorts. Thus, comparison of the averaged estimates for arrival cohorts in Detailed Table 2a shows that the Hispanic figures for 1990–2001 arrivals run about 20% lower for the 1990-based estimates; for Asians and blacks, the 1990-based estimates also are lower but with more variability than for Hispanics; for white immigrants, the 1990-based estimates are actually slightly larger than the 2000-based series. Whereas some of these differences are substantial, they should not be taken as indicative of flaws in the overall estimates; rather, they demonstrate the degree of error that had built up in the population estimates and data series for the 1990s due to inadequate information about immigrant flows to the United States (Passel 2001).
Residence 1 Year Ago
[respondent]
American Community Survey, 2000–2004. The development of estimates from the ACS information on residence one year earlier is very straightforward compared with the year of immigration variables. We first tabulate foreign-born individuals who report living outside the United States a year ago by race, by country of birth and by state of residence using the procedures described above for these variables. The only issue in combining the estimates is the date of reference for the migration period. Since the ACS data are collected through the calendar year, we assume that, on average, the data were collected at the midpoint of the survey year; for example, we assume that the 2003 ACS data were collected as of July 1, 2003. Thus, the reference period during which migration is assumed to have occurred is July 1 of the year before the survey through June 30 of the year of the survey. To convert these estimates to calendar years, we average estimates from adjacent ACS years with weights of 0.5; for 1999 estimates, we use one half of the value from the 2000 ACS and assume that it applies to the entire calendar year. Likewise for 2004, we assume that the ACS value for migration applies to the whole year. The results of this averaging process are shown as estimates of immigration (labeled as “yr ago”) for 1999–2004 in Detailed Tables 2a–2d3.
Current Population Surveys, 1994–2005. Again, the CPS estimates are somewhat more complex than the ACS estimates, but the overall process is very similar. Again, we first tabulate the number of foreign-born individuals who lived outside the United States one year before the survey from each March CPS Supplement by race, by legal status, by country of birth, and by state. We again have two separate series of estimates—based on the 1994–2001 CPSs for 1990-based weights and on the 2000–2005 CPS for the 2000-based weights. As before, each series is treated separately. Because of the data deficiencies noted above, we do not use country of birth data from the 1994 CPS, and the values for other years have been edited to reduce the number of unknowns; the race data for 1994–95 have been edited to correct Census Bureau processing errors and the data for 2003–05 edited to assign multiracial individuals to single races. We do not have legal status information for the 1994, 1997 and 2005 CPSs, so the annualized estimates for years affected by these surveys draw on less information.
Finally, the CPS data required one further modification. In processing the data, it became apparent that there were serious problems with the residence one year earlier data from the March 1995 CPS. Specifically, the estimated annual immigration based on this survey was only about 55% of the estimated values from the 1994 and 1996 CPSs. However, there was no indication from any other data source (including the year of arrival data) to suggest that the numbers were so low during the period. It appears that an additional question in the March 1995 CPS asking about residence five years earlier may have affected responses to the residence one year ago question. Because of these data problems, we dropped the 1995 data from this analysis.19
The conversion of basic CPS tabulation of immigrants in the year before the survey followed the annualization process described above for averaging ACS data. The reference period of the migration is specified more clearly in the CPS than in the ACS, so the process for developing calendar year estimates is also better specified. Specifically, the annual estimate of immigration for the year before the CPS using the residence one year ago data weights the current CPS for 10 months and the previous CPS for 2 months. For example, the number of immigrants arriving in calendar year 1998 is computed as 10 times the foreign-born population living outside the U.S. one year ago identified in the March 1999 CPS plus twice the number from the March 1998 CPS with the total divided by 12 (i.e., 10+2). If either year is missing (as with 1995 data as just noted or, for example, 1997 data on legal status), an adjustment is made in the denominator so that, in essence, the migration rate observed in the available CPS is assumed to apply to the entire calendar year.
Detailed Table 2a–2d3 shows the two separate series of annualized estimates based on CPS data for residence one year ago. Again, the weighting has an impact on the estimates as the 2000-based weights give measures of immigration about 10% higher than the 1990-based weights. There is, however, little overlap in the series as only the 2000 and 2001 CPSs carry two sets of weights. In contrast to the period of arrival estimates, the ACS tends to yield somewhat higher estimates of immigration from the residence one year ago question than the CPS estimates. Because the time reference in the CPS is more specific than in the ACS (i.e., “March 1” versus “1 year ago”), the ACS may pick up more migrants and movers whose actual date of moving occurred slightly more than one year before the interview.20 Alternatively, the ACS-CPS difference may be due to sampling variability or differences in the population estimates used in weighting the surveys.
Combined Estimates
To arrive at a single set of immigration values for calendar years 1992–2004, we take a simple average of the estimates available for each year, but restrict the averaging to estimates based on weights consistent with Census 2000. Specifically, the estimates incorporated into our overall average are: (a) Census 2000 estimates based on year of arrival for 1992–2000; (b) average ACS estimates based on year of arrival for 1992–2004; (c) average CPS 2000-based estimates based on year of arrival for 1992–2004; (d) average ACS estimates based on residence abroad 1 year ago for 1999–2004; (c) average CPS 2000-based estimates based on residence abroad 1 year ago for 1999–2004. In averaging these estimates (most of which are averages themselves), we are trying to address questions surrounding the trend in immigration over this period, not the level of immigration. The different measurement techniques provide somewhat different information about levels of immigration but all show the same trends over time. Thus, the average across methods should not be treated as the single best measure of the number of immigrants entering the country, but rather as an indicator of the relative contributions of different groups (e.g., race, legal status, geography) to immigration and of how these contributions have changed over time.
Figure 10 shows the estimated annual level of immigration for all of the series of annual estimates based on different methods; Figure 11 shows the same level of detail, but for immigration from Mexico. The variability across different estimate methods is clear in both figures as the lines show a range of several hundred thousand from highest to lowest for a number of years. The largest high-low differences tend to be in peak immigration years, however. What is also apparent from the figures is that all of the separate estimates series show similar patterns of a relatively low plateau at the beginning, an increase to peak values, followed by a decline from the peak.