Pew Research Center

FOR RELEASE DECEMBER 27, 2004

Dispersal and Concentration: Patterns of Latino Residential Settlement

Some 20 million Hispanics—57 percent of the total—lived in neighborhoods in which Hispanics made up less than half of the population at the time of the 2000 census.

BY Roberto Suro and Sonya Tafoya

FOR MEDIA OR OTHER INQUIRIES:

Communications Department
202.419.4372
www.pewresearch.org

RECOMMENDED CITATION

Pew Research Center, December 2004, "Dispersal and Concentration: Patterns of Latino Residential Settlement"

About Pew Research Center

Pew Research Center is a nonpartisan, nonadvocacy fact tank that informs the public about the issues, attitudes and trends shaping the world. It does not take policy positions. The Center conducts public opinion polling, demographic research, computational social science research and other data-driven research. It studies politics and policy; news habits and media; the internet and technology; religion; race and ethnicity; international affairs; social, demographic and economic trends; science; research methodology and data science; and immigration and migration. Pew Research Center is a subsidiary of The Pew Charitable Trusts, its primary funder.

© Pew Research Center 2026

Table of contents

  • About Pew Research Center
  • Dispersal and Concentration: Patterns of Latino Residential Settlement
  • II. Introduction
  • III. Methods
  • IV. Majority-Latino versus Minority-Latino Neighborhoods
  • V. Traditional Versus New Settlement States
  • VI. Examples of Growth in Traditional and New Settlement States
  • Appendix Tables

Dispersal and Concentration: Patterns of Latino Residential Settlement

Some 20 million Hispanics—57 percent of the total—lived in neighborhoods in which Hispanics made up less than half of the population at the time of the 2000 census.

I. Overview

Rather than clustering in ethnic enclaves, Census data show that most Latinos live scattered through neighborhoods where they are a small share of the population. Some 20 million Hispanics—57 percent of the total—lived in neighborhoods in which Hispanics made up less than half of the population at the time of the 2000 census. These Latinos lived in census tracts where only seven percent of residents were Hispanics on average. This pattern of dispersal even holds for Latino immigrants and for low-income Hispanics although to a somewhat lesser degree.1

Of course, this leaves a sizeable share of the Hispanic population—43 percent—in neighborhoods where Latinos are a majority. These communities are large, and the Hispanic population that lives in such neighborhoods is growing faster than the Hispanic population that lives dispersed among non-Hispanics. A comparison of data from the 1990 and 2000 census counts shows that as the size of the Hispanic population increased in big cities with already large Hispanic populations, such as New York and Los Angeles, these majority-Latino neighborhoods spread across the urban landscape. Although such neighborhoods where Latinos dominate can be highly visible and sometimes controversial, they are not the norm for the Latino population.

Thus, the recent growth of the Hispanic population has produced two countervailing trends in residential settlement: dispersal and concentration. The increase of the Hispanic population between 1990 and 2000 was almost equally shared between neighborhoods where Latinos are a majority of residents (6.5 million) and neighborhoods where they are a minority (6.9 million). As of 2000, however, more Hispanics were dispersed than were concentrated. Moreover, a variety of different types of Latinos— immigrant and native born, poor and middle class—live in predominately Hispanic neighborhoods.

The Hispanic population is classified as a minority group, and it is growing rapidly through immigration. On both scores questions arise about patterns of residential settlement: Are Latinos segregated into neighborhoods where they constitute the dominant population? What are the characteristics of Latinos who live in neighborhoods populated mostly by non-Hispanics? In order to help resolve these and other related questions, the Pew Hispanic Center conducted an analysis of data from the 2000 census. Each of the nation’s more than 65,000 census tracts was sorted according to whether or not Latinos constituted a half or more of the population in the tract. Then, the characteristics of the Hispanic population in what we have termed “majority-Latino” tracts were contrasted to those in “minority-Latino” tracts. Further analysis examined the residential distribution of the Hispanic population in these kinds of tracts in the 1990 census to determine how patterns changed over the course of a decade. In addition, this analysis was applied to states where large numbers of Latinos have lived for many years and to states that have recently experienced rapid growth of the Hispanic population to determine whether these residential patterns differed in traditional and new settlement areas.

Overall, this analysis shows that by a significant measure most Latinos live in communities that they share with non-Latinos. And, while majority-Latino neighborhoods are large and growing, especially in the nation’s biggest cities, those neighborhoods contain a mix of native-born and foreign-born Latinos, Spanish speakers and English speakers, the poor and the middle class. On balance, Balkanization is not the defining trend. Most Latinos are not conglomerating into densely packed, highly homogenous communities characterized by a prevalence of Spanish-language and immigrant cultures. Rather, most are living with non-Hispanics and even neighborhoods where Latinos dominate show considerable variety.

Some of the major findings:

  • In 2000 most Latinos, 57 percent, lived in neighborhoods where Latinos constituted less than half of the population while 43 percent lived in census tracts where Latinos were a majority of the population
  • By this measure the Hispanic population is somewhat less concentrated than the African-American population. Some 48 percent of the black population lived in tracts with a majority black population.
  • The number of Hispanics living in majority-Latino neighborhoods grew faster (76%) than the number in minority-Latino neighborhoods (51%) between 1990 and 2000.
  • A greater share of the Hispanic foreign-born population (48%) lived in majority- Latino neighborhoods than the native-born (39%). But, most people in both nativity categories lived in minority-Latino neighborhoods.
  • Language is a powerful factor in neighborhood distribution. Over three-quarters of Latinos who speak only English lived in minority-Latino neighborhoods. Spanish-monolingual Latinos were more evenly divided between neighborhoods where Latinos predominate and those where they do not.
  • Spanish is spoken to some degree by most Hispanics living in neighborhoods where Latinos are the majority population, but English is also a strong presence. In 2000 more than half (58%) of the Latino residents of these neighborhoods were bilingual in English and Spanish and another sizeable share (14%) spoke only English. Individuals who spoke only Spanish constituted a little more than a quarter (28%) of the population in census tracts where more than half of the residents were Hispanics.
  • Although Latinos with higher incomes are more likely to live in minority-Latino neighborhoods, all income ranges are well represented both in majority- and minority-Latino communities.
  • Nearly half of the Latino population living in poverty was located in communities where most of their neighbors are not Hispanics.
  • In states with large, long-standing Hispanic populations, Latinos were almost evenly divided between majority- and minority-Latino communities in 2000. In the new settlement states, however, the number of Hispanics in non-Latino neighborhoods was more than three times larger than the number in heavily Latino communities.

II. Introduction

Throughout U.S. history, as well as in many other nations at various times, some commentators have expressed concerns that immigrant populations tend to cluster in ethnic communities where they cling to native languages, cultures and political beliefs. For example, Samuel P. Huntington, a prominent political scientist at Harvard, argued in Who Are We: The Challenges to America’s National Identity that previous waves of immigrants to the United States had scattered across the landscape rather than concentrating in homogeneous enclaves. This, he said, was both an essential element of the national heritage and a critical factor in the nation’s historical success in absorbing immigrants, concluding, “The Founding Fathers were right. Dispersion is key to assimilation.” Huntington worried that contemporary “Hispanic immigration has deviated from the historical pattern of dispersion” in a manner that will slow or even prevent assimilation.1

Latino population growth in the past decade has been characterized by countervailing trends of concentration and dispersal. We find that most Latinos live in neighborhoods that are not predominantly Latino. In 2000 more than half of the Hispanic population—20 million people—lived outside of concentrated Latino neighborhoods, while fewer—15 million— lived in concentrated Latino neighborhoods. However, we also find that the rate of growth has been faster for Hispanics in majority-Latino neighborhoods. On a larger geographic scale, we show that over the past two decades both immigrant and native-born Latinos have dispersed to states other than those with long-standing Hispanic populations, here called the “traditional Hispanic states.” Overall, the Latino population in the eight states that collectively make up our “new settlement states” grew by 130 percent between 1990 and 2000. Nearly 4 million Latinos lived in these new settlement states by 2000, and growth in minority-Latino neighborhoods accounted for nearly three-quarters of all growth of the Hispanic population in these states. As of 2000, as many as 3 million Latinos lived in the minority-Latino neighborhoods within new settlement states. On the other hand fewer than one million Latinos in these new settlement states lived in concentrated Latino neighborhoods.

III. Methods

The findings we present here are derived from an analysis of 1990 and 2000 Summary File 3 data from the United States Census Bureau.2 A neighborhood in this report refers to what the Census Bureau terms a census tract. About 4,200 people live in an average census tract which makes it small enough to give a picture of the kinds of people who live in close proximity to each other. We define a “majority-Latino” neighborhood as a tract which is more than 50 percent Hispanic. If a tract does not fit the definition of a majority-Latino neighborhood we refer to it as a “minority-Latino” neighborhood.3 We use the summary data that characterize the residents of both neighborhood types to look for differences between Latinos who live in concentrated Latino neighborhoods and those who do not. No data source other than the decennial census permits an examination of population characteristics in such small geographic areas, and as such there is no reliable means to assess trends since the 2000 count.

At a higher geographic level, we examine dispersal patterns by dividing states into traditional Hispanic states and new settlement states. We define new settlement states as those in which the Hispanic population grew by at least 200,000 between 1980 and 2000, and roughly tripled in size. New settlement states include Arizona, Nevada, Georgia, North Carolina, Oregon, Virginia, Washington, and Massachusetts. Traditional Hispanic states include California, Texas, Illinois, New York, New Jersey, Florida and New Mexico. In 2000, nearly 90 percent of the nation’s Latinos live in either traditional Hispanic or new settlement states. As in the analysis of neighborhood data, we use the summary data that characterize the residents to see how Latinos who live in traditional states differ from those who do not.

IV. Majority-Latino versus Minority-Latino Neighborhoods

Although the dividing line between majority-Latino and minority-Latino neighborhoods in this analysis is a simple matter of whether half or more residents are Hispanics, these communities have very different characteristics. On average, 71 percent of the residents in Latino-majority census tracts were Hispanics in the 2000 census. Meanwhile, the minority-Latino tracts averaged a Latino population of only seven percent. Thus, Hispanics tended to live either in neighborhoods with a very high or a very low density of Latinos. Overall this population is both highly concentrated and highly dispersed.

As might be expected, a considerably greater share of the Hispanic population of majority-Latino neighborhoods is made up of immigrants (43% on average) compared to minority-Latino communities (27% foreign born on average). However, this does not mean that majority-Latino neighborhoods are necessarily immigrant enclaves. On average, 57 percent of the Hispanics living in majority-Latino neighborhoods are native born. Other evidence suggests that significant shares of these native-born Latinos are the U.S.-born children of immigrant parents.4 Not surprisingly, Spanish is widely spoken in majority-Latino communities but not to the exclusion of English by any means. Only a little more than a quarter (28%) of the residents of majority-Latino neighborhoods speaks just Spanish. Of the rest, 14 percent only speak English and 58 percent are bilingual in English and Spanish.

The Hispanic population of majority-Latino neighborhoods is more concentrated in the lower income brackets than in minority-Latino communities. That does not mean, however, that Latino-majority communities are populated primarily by lower-income households. While 42 percent of the Hispanic households in majority-Latino neighborhoods had incomes of $25,000 a year or less, 33 percent had incomes of $50,000 or more.

In summary then, the Hispanic population in Latino-majority communities is considerably diverse in terms of nativity, language and income. While low-income, Spanish-speaking, foreign-born Latinos represent a large share of the population in these neighborhoods, they are by no means the dominant type.

More Latinos lived in minority-Latino neighborhoods than in majority-Latino neighborhoods in 2000. Over half of all Latinos, 57 percent, lived in minority-Latino neighborhoods, while the remaining 43 percent lived in majority-Latino neighborhoods.

Between 1990 and 2000 the Hispanic population counted by the census increased by more than 13 million, and this rapid growth was accompanied by a trend towards greater concentration in Latino neighborhoods. In 1990, 61 percent of all Hispanics lived in minority-Latino neighborhoods while 39 percent lived in neighborhoods where Latino constituted the majority.

Between the two census counts, 6.5 million Hispanics were added to majority- Latino neighborhoods and slightly more, 6.9 million, were added to minority-Latino neighborhoods. However, because the Hispanic population in majority-Latino neighborhoods started out smaller, the rate of growth was faster there.

Clustering into ethnic enclaves is commonly thought of as an immigrant trait, and indeed a greater share of the Hispanic foreign-born population (48%) lives in majority- Latino neighborhoods than the native-born (39%). Nonetheless, most Hispanics of both nativity groups lives in minority-Latino neighborhoods. Indeed, while the native-born dominate the Hispanic population in minority-Latino neighborhoods (63% vs. 37%), the Hispanic population of majority-Latino neighborhoods is more closely divided and includes sizeable shares of both native-born (55%) and foreign-born Hispanics (45%).

English monolingualism is a more powerful factor in the neighborhood distribution of the Latino population than nativity. Three-quarters of Latinos who speak only English live in minority-Latino neighborhoods, whereas fewer than half of Spanish monolingual Latinos residents live in such neighborhoods.

For Latinos, residential patterns correlate to income but only to a limited extent. As household incomes increase, the share of Latinos living in minority-Latino neighborhood increases as well. So, most middle and upper income Latinos live in minority-Latino communities. However, most Latinos in the lowest income bracket also live in neighborhoods where Latinos are a minority, and sizeable shares of those with higher incomes live in majority-Latino neighborhoods. Thus, the full range of incomes is represented in both kinds of communities. More than seventy percent of Latinos in the highest household income class (annual incomes $75,000 or more) live in minority- Latino neighborhoods. Moreover, about half (52%) of Latino households in the lowest income category (annual incomes of $25,000 a year or less) also live in communities where non-Hispanics are the dominant population. Conversely, densely Latino neighborhoods include sizeable shares of Latino middle and upper income households.

Not surprisingly given the income distributions described above, a majority of Hispanics living in poverty, both adults and children, reside in majority-Latino neighborhoods. But, it is a slim majority because this segment of the Hispanic population is also significantly dispersed. Both in terms of absolute numbers and proportion, nearly half of the Latino poverty population lives scattered through neighborhoods where Latinos are a distinct minority.

The correlation between income and residential patterns among African Americans is similar to that of Latinos with one exception: In 2000 larger shares of middle and upper income black households lived in neighborhoods where blacks are a majority than was the case with the distribution of Hispanics among Latino and non- Latino neighborhoods. Otherwise, as with Latinos, very large shares of the black low income (48%) and poverty population (46%) lived in neighborhoods where most residents are not of the same racial/ethnic category.

Overall, nearly half of the black population (48%) lived in census tracts where blacks are a majority of residents. That is a somewhat larger proportion of the population than is the case for Hispanics who lived in majority-Latino neighborhoods (43%).

V. Traditional Versus New Settlement States

Between 1990 and 2000 large numbers of Hispanics were added to a handful of states where Latinos have long been concentrated. In addition, several states that previously had comparatively small numbers of Latinos saw very rapid growth in their Hispanic population. The change in the population numbers for Latinos was largest in the traditional states (8.9 million vs. 2.2 million), but the pace of growth was fastest in the new settlement states (130% vs. 50%). In 2000 nearly nine of every ten Hispanics (87%) lived in what can be termed either a traditional or a new settlement state (see “Methods” above). The rest lived in states with relatively small Latino populations that underwent modest growth in the 1990s. There are striking differences between traditional and new settlement states in the ways that Latinos cluster at the neighborhood level.

In traditional states the Hispanic population was almost evenly divided in 2000 between communities in which Latinos constituted a majority of the population and those in which they were a minority. In the new settlement states, however, the number of Hispanics in minority-Latino neighborhoods was more than three times larger than the number in heavily Latino communities.

In the new settlement states, about three-quarters (74%) of the growth took place in non-Latino neighborhoods. Thus, as the Latino population dispersed to new areas of the country the vast majority of these new arrivals settled in neighborhoods where Hispanics were a sparse presence. This runs contrary to the classic model of ethnic clustering in which new arrivals in an area seek out each others’ company. Given that there were relatively few Latinos in these states as the process of dispersal got underway in the 1980s, these new arrivals did not have the ready option of seeking out already established Latino communities of the sort that exist on a large scale in the traditional Hispanic states. On the other hand, this process has already been underway for a decade at least and involves many thousands of people, and yet the census data suggests that the primary trend in the new settlement states is not the formation of high-density Latino communities. Rather, dispersal on a national level is being mirrored by dispersal at the local level in the new settlement states.

In the traditional Hispanic states, the relationship between growth and residential settlement is very different. While the rate of growth was faster in the new settlement states, the number of Hispanics started out far higher in the traditional Hispanic states and the number added was also much greater. While the new settlement states saw a process of dispersal, the addition of nearly 9 million Latinos to the population of the traditional states was accompanied by an increase in the number of Latinos living in neighborhoods where Latinos are a majority of the residents and in the geographic scope of such communities. This is evident both in measures of the number of people involved and of the pace of growth.

The 5.6 million Hispanics added to heavily Latino communities in traditional Hispanic states represented 63 percent of the overall growth of the Hispanic population in those states. Moreover, the population in these communities grew twice as fast as in low concentration neighborhoods. Given these very large numbers, this process could not simply have added residents to existing enclaves because there was simply not enough room in the existing majority-Latino communities for so many more people. Indeed, those neighborhoods overflowed. Mapping the change in several of the major metropolitan areas where this growth took place shows a process of geographic expansion. Existing Latino neighborhoods did not merely grow denser; they grew bigger.

VI. Examples of Growth in Traditional and New Settlement States

Illinois

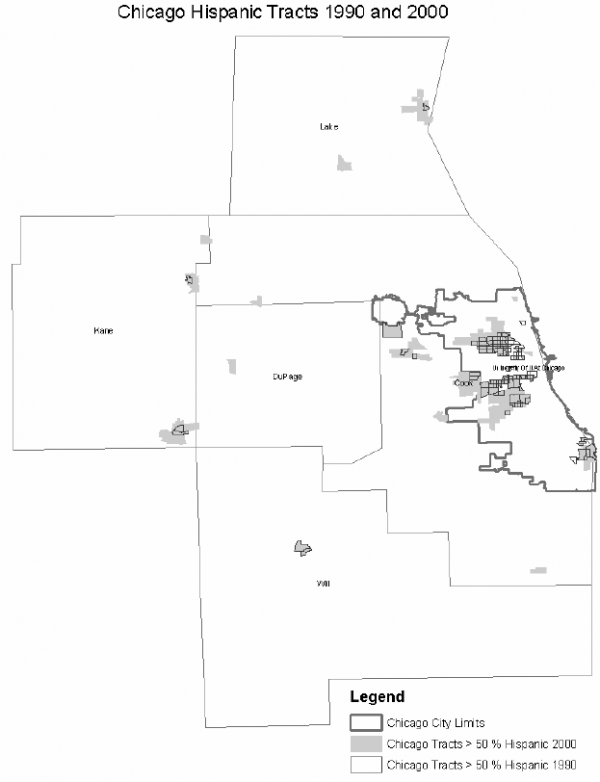
After a process of Hispanic settlement that dates back to the 1920s, substantial communities with contiguous majority-Latino tracts had developed in several parts of Chicago by 1990. A scattering of Latino neighborhoods had also emerged in suburban areas.

Illinois added 650,000 Hispanics between 1990 and 2000, and this increase was overwhelmingly (92%) registered in the Chicago metropolitan area (the Chicago PMSA which includes the five counties shown on the map below).6 So, within the state the growth was geographically highly concentrated. And, 55 percent of this additional population of Hispanics was located in majority-Latino neighborhoods in the Chicago area. Another, 37 percent of the increase in the state’s Latino population went to “non- Hispanic” neighborhoods in metropolitan Chicago. As shown on the map below, the growth of the Latino population led to the substantial geographic expansion of existing enclaves. Yet, at the same time, a smaller but still substantial process of dispersal was taking place as a third of the added population was scattered through “non-Latino” neighborhoods.

New York

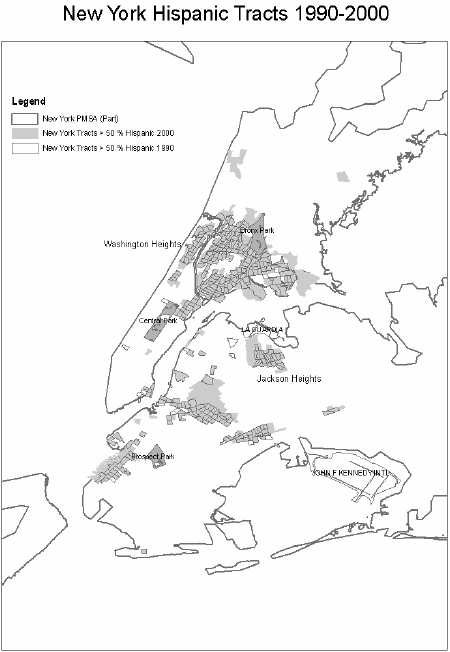
The state of New York added 713,275 Latinos to its population between 1990 and 2000. As in Illinois, nearly all (91%) of the increase took place in a single major metropolitan area, the New York City PMSA.7 In 2000, half of this growth was to be found in majority Hispanic neighborhoods within the New York PMSA, and another 41 percent was added to minority-Latino tracts in the same area. Again, as in the case of Chicago, non-Hispanic communities that were geographically contiguous to majority Hispanic neighborhoods in 1990 had gained a majority Latino population by 2000. An increase in the Hispanic population was accompanied by a process of geographic expansion of the largely contiguous majority Hispanic neighborhoods even as a sizeable portion of the Latino population found homes in non-Hispanic communities.

Florida

Florida’s Latino growth pattern was much more geographically diffuse than in other traditional Hispanic states. This may reflect the attractiveness of the state to both domestic and international migrants. While other studies have shown that the Miami-Ft Lauderdale CMSA was a magnet for immigrants over the decade, the Tampa-St. Petersburg-Clearwater and Orlando metropolitan areas (not shown in map) attracted Latino movers from elsewhere in the United States.8 Of the 1.1 million Latinos added to the state of Florida between 1990 and 2000, fewer than half (45 percent) were added in the Miami-Ft Lauderdale CMSA. More (55 percent) were added outside the bounds of the Miami Ft. Lauderdale CMSA, and most of them were found in “non-Hispanic” neighborhoods in 2000.9 Only 32 percent of the increase in Florida’s Hispanic population was added in the Latino neighborhoods of Miami-Ft Lauderdale CMSA.

California

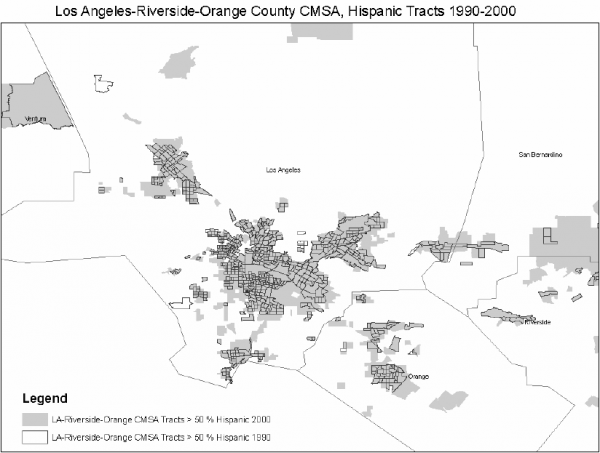
California’s Latino population grew by 3.4 million people between 1990 and 2000. A little over half (55 percent) of California’s Latino growth was in and around Los Angeles, and in that swath of Southern California almost all of the increase went into majority Latino neighborhoods. In the Los Angeles-Riverside-Orange County CMSA, the Latino population grew by 1.9 million, and 1.7 million were added to Latino neighborhoods within that area.10 On the fringes of the metropolitan area, large expanses of majority-Latino neighborhoods developed where in 1990 there had only been a handful of majority-Latino tracts. Meanwhile, an almost equal number (1.5 million) of additional Latinos found homes in California outside the Los Angeles metropolitan area.

Arizona

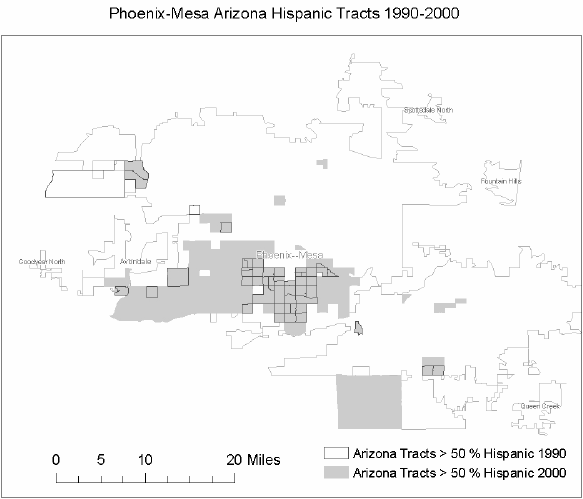
Among the new settlement states, Arizona was the only state that added more than half a million Latinos between 1990 and 2000. Compared to Illinois and New York, a lesser share (72 percent) of the Latino growth was in state’s largest metropolitan area, the Phoenix-Mesa MSA. And, compared to California, a smaller share (38 percent) went into majority-Latino neighborhoods.

Georgia

Georgia had no neighborhoods that were more than 50 percent Hispanic in 1990 and only a handful in 2000. Only six percent of the Hispanic population of Georgia resided in these concentrated Latino neighborhoods in 2000. Most of the Latino population growth was in the Atlanta metro area, with most Latinos added in minority- Latino neighborhoods.11 However, among the non-metro areas, Dalton, GA. attracted many Latinos. Work in the carpet industry drew many Latinos to this small town in Georgia. And similar settlements in non-metro areas of Georgia have been established around poultry processing plants.

Appendix Tables