Pew Research Center

FOR RELEASE JANUARY 29, 2026

How Americans See Immigration Officers’ Behaviors and Civilian Actions

Most say it’s acceptable for people to record immigration arrests and warn others where enforcement efforts are happening

BY Andrew Daniller and J. Baxter Oliphant

FOR MEDIA OR OTHER INQUIRIES:

Communications Department
202.419.4372
www.pewresearch.org

RECOMMENDED CITATION

Pew Research Center, January 2026, "How Americans See Immigration Officers’ Behaviors and Civilian Actions"

About Pew Research Center

Pew Research Center is a nonpartisan, nonadvocacy fact tank that informs the public about the issues, attitudes and trends shaping the world. It does not take policy positions. The Center conducts public opinion polling, demographic research, computational social science research and other data-driven research. It studies politics and policy; news habits and media; the internet and technology; religion; race and ethnicity; international affairs; social, demographic and economic trends; science; research methodology and data science; and immigration and migration. Pew Research Center is a subsidiary of The Pew Charitable Trusts, its primary funder.

© Pew Research Center 2026

About this research

This Pew Research Center analysis is part of a broader project that examines Americans’ views of immigration policy, immigration officers’ actions and the public’s response to immigration enforcement.

Why did we do this?

Pew Research Center conducts research to help the public, media and decision-makers understand important topics. We have studied Americans’ views of politics and major policy issues, including immigration, for decades.

Learn more about Pew Research Center.  

How did we do this?

We surveyed 8,512 U.S. adults from Jan. 20 to 26, 2026. Everyone who took part in this survey is a member of the Center’s American Trends Panel. The survey represents the views of the full U.S. adult population.

Here are the survey questions used for this analysis, the detailed responses and the survey methodology.

Table of contents

  • About Pew Research Center
  • About this research
  • How Americans See Immigration Officers’ Behaviors and Civilian Actions
  • How Americans view key Trump administration immigration policies
  • Appendix: Did attitudes shift after Alex Pretti was killed?
  • Acknowledgments
  • Methodology

How Americans See Immigration Officers’ Behaviors and Civilian Actions

Most say it’s acceptable for people to record immigration arrests and warn others where enforcement efforts are happening

Amid ramped-up immigration enforcement efforts around the country, Americans overwhelmingly say it is acceptable for ordinary people to record video of immigration arrests. A clear majority also say it’s acceptable for people to share information about where enforcement is happening.
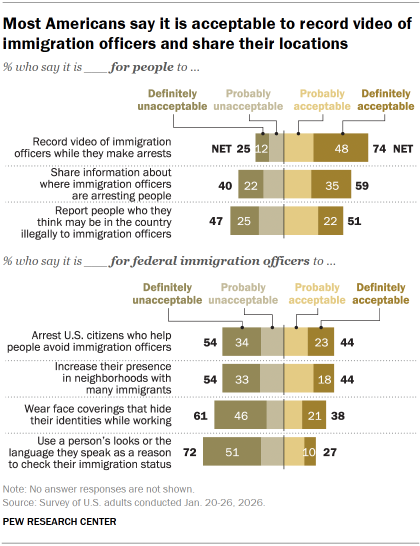
Chart shows Most Americans say it is acceptable to record video of immigration officers and share their locations

And by wide margins, the public says it’s not acceptable for federal immigration officers to wear face coverings that hide their identities, or to use people’s appearance or language use as a reason for checking their immigration status. 

A new Pew Research Center survey of 8,512 U.S. adults conducted Jan. 20-26 finds that:

  • 74% say it is acceptable for people to record video of immigration officers while they make arrests.
  • 59% say it’s acceptable to share information about where officers are making arrests.

When it comes to the actions of federal immigration officers:

  • 72% of Americans say it’s unacceptable for them to use people’s appearance or the language they speak as a reason to check their immigration status.
  • 61% say it is unacceptable for officers to wear face coverings that hide their identities while working.

Americans are more divided when it comes to officers arresting U.S. citizens who help others avoid immigration enforcement: 44% say this is acceptable, while 54% say it is unacceptable. Similarly, 44% say it is acceptable for immigration officers to increase their presence in neighborhoods with many immigrants, while 54% say this is unacceptable.

Note: The survey was in the field on Jan. 24, when 37-year-old Alex Pretti was shot and killed by U.S. Customs and Border Protection agents in Minneapolis – the second killing of a protestor by federal immigration agents in Minneapolis this month.

Partisans’ views of actions by ordinary people

Majorities of both Republicans and Democrats say it is acceptable for people to record video of immigration officers while they make arrests. However, Democrats and independents who lean toward the Democratic Party (89%) are substantially more likely to say this than Republicans and Republican leaners (59%).

The partisan gap is wider when it comes to sharing information about where immigration officers are making arrests. Eight-in-ten Democrats say this is acceptable, compared with 36% of Republicans. A majority of Republicans (63%) say this is unacceptable.

By contrast, Republicans are far more likely than Democrats to say it is acceptable for ordinary people to report those they think may be in the country illegally: 77% of Republicans say this is acceptable, compared with just 27% of Democrats.
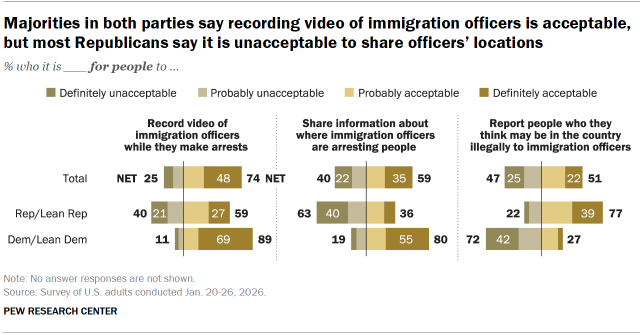
Chart shows Majorities in both parties say recording video of immigration officers is acceptable, but most Republicans say it is unacceptable to share officers’ locations

Within each party, there are notable differences by racial and ethnic background.

Among Democrats

  • About two-thirds of Black Democrats (68%) say it is acceptable to share officers’ locations. Larger shares of White (84%), Asian (81%) and Hispanic (79%) Democrats say the same.
  • Hispanic Democrats are less likely than other Democrats to say it is acceptable to report people they suspect of being in the country illegally. Just 16% hold this view.

Among Republicans

  • Hispanic Republicans are more likely than White Republicans to say it is acceptable to record video of immigration officers (67% vs. 56%) or share the location of immigration officers (47% vs. 32%).
  • Conversely, White Republicans are more likely than Hispanic Republicans to say it is acceptable to report those they suspect of being in the country illegally (82% vs. 62%).

There are also age differences among Republicans:

  • 66% of Republicans ages 18 to 49 say it’s acceptable to record video of immigration officers. This drops to 52% among Republicans ages 50 and older.
  • 48% of Republicans ages 18 to 49 say it’s acceptable to share officers’ locations, compared with just 25% of those ages 50 and older.

Full breakdowns by party, age, and race and ethnicity are shown in the detailed tables.

How Democrats and Republicans view the actions of immigration officers

Republicans are far more likely than Democrats to approve of actions that federal immigration officers might take.

Large majorities of Republicans say it is acceptable for immigration officers to:

  • Arrest U.S. citizens who help others avoid arrest (76%)
  • Increase their presence in neighborhoods with many immigrants (74%)
  • Wear face coverings that hide their identities while working (68%)

Overwhelming majorities of Democrats say each of these actions is unacceptable.
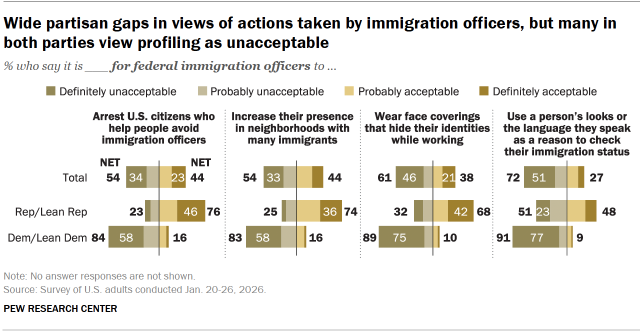
Chart shows Wide partisan gaps in views of actions taken by immigration officers, but many in both parties view profiling as unacceptable

When it comes to using a person’s looks or the language they speak as a reason to check their immigration status, Republicans are divided: 48% say this is acceptable, while 51% say it is unacceptable. Roughly nine-in-ten Democrats (91%) say this is unacceptable.

Similar to the patterns in how people interact with immigration officers, White Republicans are at least 13 percentage points more likely than Hispanic Republicans to view each of these actions by officers as acceptable.

Note: While responses to the items in the survey were largely consistent across the Jan. 20-26 field period, Republicans who completed the survey in the days after Pretti was killed were somewhat more likely than those who responded earlier to say recording immigration officers and sharing their locations are acceptable. They were also somewhat less likely than those who responded earlier to view immigration officers wearing face coverings and using a person’s looks or the language they speak as a reason to check their immigration status as acceptable. Refer to the appendix for details.
How Americans view key Trump administration immigration policies

President Donald Trump has moved to make sweeping changes to the U.S. immigration system, but public views of his policies and proposals in this area vary.

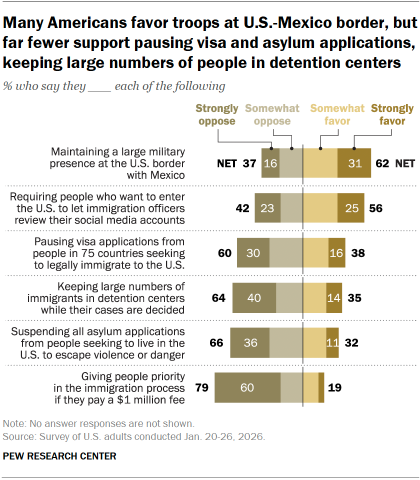
Chart shows Many Americans favor troops at U.S.-Mexico border, but far fewer support pausing visa and asylum applications, keeping large numbers of people in detention centers

Several of the administration’s most restrictive policies face substantial opposition from the public, while others receive widespread support.

According to a new Pew Research Center survey of 8,512 U.S. adults conducted Jan. 20-26, 2026, a majority of Americans favor:

  • Maintaining a large military presence at the U.S.-Mexico border (62%)
  • Requiring people who want to enter the U.S. to let immigration officers review their social media accounts (56%)

But the survey also finds that most Americans oppose:

  • Giving immigration priority to people if they pay a $1 million fee (79% oppose, including 60% who strongly oppose)
  • Suspending all applications for asylum (66% oppose)
  • Keeping large numbers of immigrants in detention centers while their cases are decided (64%)
  • Pausing immigration visa applications from people in 75 countries (60%)

Related: How Americans see immigrations officers’ enforcement behaviors and civilian actions

How Republicans and Democrats view these policies

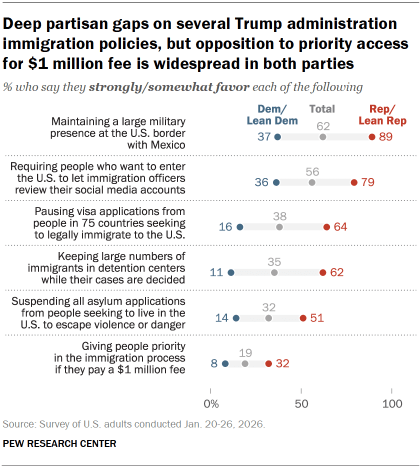
There are wide partisan gaps on many immigration proposals and actions from the Trump administration. But majorities of both Republicans and Democrats oppose giving people priority status in the immigration process for a $1 million fee.

Republican support for the immigration actions we asked about varies –  but majorities support most of them.

Chart shows Deep partisan gaps on several Trump administration immigration policies, but opposition to priority access for $1 million fee is widespread in both parties

Large majorities of Republicans and independents who lean toward the Republican Party favor a strong military presence on the border with Mexico (89%) and requiring people wanting to enter the U.S. to let immigration officers review their social media accounts (79%).

Republicans are about evenly split over suspending asylum applications (51% favor, 47% oppose).

By about two-to-one, Republicans oppose giving people priority in the immigration process if they pay a $1 million fee: 67% oppose, while 32% favor this.

Most Democrats and Democratic-leaning independents oppose each of these actions, though to different degrees.

A third or more support maintaining a large military presence on the border with Mexico (37%) and requiring people who want to come to the U.S. to make their social media accessible to immigration officers (36%). The other actions are supported by fewer than 20% of Democrats.

Appendix: Did attitudes shift after Alex Pretti was killed?

Pew Research Center surveyed 8,512 adults from Jan. 20 to 26, 2026 about Americans’ views of immigration. Read findings on immigration officers’ actions and the public’s response to immigration enforcement.

This survey was in the field on January 24, the day Alex Pretti was shot and killed by Border Patrol agents in Minneapolis. While the vast majority of interviews were completed prior to the shooting, 12% of respondents completed their interviews January 24-26.

We examined whether Americans’ views on questions about the acceptability of behaviors by immigration officers and ordinary civilians differed after Pretti was killed.

The results suggest that while attitudes were relatively consistent before and after the event, there were modest changes, primarily among Republicans and Republican leaners.

Of course, those who take our surveys earlier and later in the field period aren’t necessarily identical. For example, we know that some harder to reach groups tend to take surveys later in the field period.

To test this, the best way to understand the relationship between two variables while controlling for other factors is often through the statistical method of regression analysis. To do this we limited our sample to Republicans and Republican leaners, as Democrats’ attitudes showed no evidence of systematic change. We then regressed each of our seven survey items on a dummy variable indicating when each respondent took the survey, as well as a mix of political and demographic control variables such as strength of partisanship, age, education, and race or ethnicity, using ordinary least squares regression.

The results of the regression analysis show that while some of the difference between early and late survey respondents on our questions about the actions of ordinary people and the actions of immigration officers can be explained by other differences between these groups besides the date on which they took the survey, some of the differences between early and late respondents remain statistically significant even after controlling for the other variables included in our model.

Republicans’ views on two survey questions in particular appear to be influenced by whether they took the survey before or after Alex Pretti was killed: The acceptability of immigration officers wearing face coverings that hide their identities and the acceptability of immigration officers using a person’s looks or the language they speak as a reason to check their immigration status. However, the size of these differences is relatively modest.

Acknowledgments

This report is a collaborative effort based on the input and analysis of the following individuals:

Research team

Jocelyn Kiley, Director, Political Research
Steven Shepard, Associate Director, Political Research
Hannah Hartig, Senior Researcher
Baxter Oliphant, Senior Researcher
Gabe Borelli, Research Associate
Andrew Daniller, Research Associate
Andy Cerda, Research Analyst
Joseph Copeland, Research Analyst
Shanay Gracia,Research Analyst
Ted Van Green, Research Analyst

Communications and editorial

Nida Asheer, Senior Communications Manager
Maya Pottinger, Communications Associate
David Kent, Senior Editorial Specialist
Anna Jackson, Editorial Specialist

Graphic design and web publishing

Peter Bell, Associate Director, Design and Production
Alissa Scheller, Senior Information Graphics Designer
Reem Nadeem, Digital Producer
Beshay Sakla, Associate Digital Producer

Methodology

Andrew Mercer, Senior Research Methodologist
Dorene Asare-Marfo, Senior Panel Manager
Dana Popky, Associate Panel Manager
Arnold Lau, Research Methodologist

Methodology

The American Trends Panel survey methodology

Overview

Data in this report comes from Wave 185 of the American Trends Panel (ATP), Pew Research Center’s nationally representative panel of randomly selected U.S. adults. The survey was conducted from  Jan. 20 to Jan. 26, 2026. A total of 8,512 panelists responded out of 9,302 who were sampled, for a survey-level response rate of 92%.  

The cumulative response rate accounting for all stages of nonresponse and attrition is 3%. The break-off rate among panelists who logged on to the survey and completed at least one item is 2%. The margin of sampling error for the full sample of 8,512 respondents is plus or minus 1.4 percentage points.

The survey includes oversamples of non-Hispanic Asian adults and adults ages 18-to-29 in order to provide more precise estimates of the opinions and experiences of these smaller demographic subgroups. These oversampled groups are weighted back to reflect their correct proportions in the population.

SSRS conducted the survey for Pew Research Center via online (n=8,272) and live telephone (n=240) interviewing. Interviews were conducted in both English and Spanish.

To learn more about the ATP, read “About the American Trends Panel.”

Panel recruitment

Since 2018, the ATP has used address-based sampling (ABS) for recruitment. A study cover letter and a pre-incentive are mailed to a stratified, random sample of households selected from the U.S. Postal Service’s Computerized Delivery Sequence File. This Postal Service file has been estimated to cover 90% to 98% of the population.1 Within each sampled household, the adult with the next birthday is selected to participate. Other details of the ABS recruitment protocol have changed over time but are available upon request.2 Prior to 2018, the ATP was recruited using landline and cellphone random-digit-dial surveys administered in English and Spanish.

A national sample of U.S. adults has been recruited to the ATP approximately once per year since 2014. In some years, the recruitment has included additional efforts (known as an “oversample”) to improve the accuracy of data for underrepresented groups. For example, Hispanic adults, Black adults and Asian adults were oversampled in 2019, 2022 and 2023, respectively.

Sample design

The overall target population for this survey was noninstitutionalized persons ages 18 and older living in the United States. It featured a stratified random sample from among ATP members who previously completed Wave 183. Non-Hispanic Asian adults and adults ages 18 to 29 were selected with certainty. The remaining panelists were sampled at rates designed to ensure that the share of respondents in each stratum is proportional to its share of the U.S. adult population to the greatest extent possible. Respondent weights are adjusted to account for differential probabilities of selection as described in the Weighting section below.

Questionnaire development and testing

The questionnaire was developed by Pew Research Center in consultation with SSRS. The web program used for online respondents was rigorously tested on both PC and mobile devices by the SSRS project team and Pew Research Center researchers. The SSRS project team also populated test data that was analyzed in SPSS to ensure the logic and randomizations were working as intended before launching the survey.

Incentives

All respondents were offered a post-paid incentive for their participation. Respondents could choose to receive the post-paid incentive in the form of a check or gift code to Amazon.com, Target.com or Walmart.com.  Incentive amounts ranged from $5 to $20 depending on whether the respondent belongs to a part of the population that is harder or easier to reach. Differential incentive amounts were designed to increase panel survey participation among groups that traditionally have low survey response propensities.

Data collection protocol

The data collection field period for this survey was Jan. 20 to Jan. 26, 2026. Surveys were conducted via self-administered web survey or by live telephone interviewing.

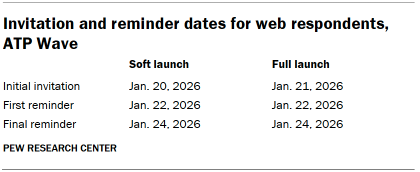
For panelists who take surveys online:3 Postcard notifications were mailed to a subset on Jan. 20.4 Survey invitations were sent out in two separate launches: soft launch and full launch. Sixty panelists were included in the soft launch, which began with an initial invitation sent on Jan. 20. All remaining English- and Spanish-speaking sampled online panelists were included in the full launch and were sent an invitation on Jan. 21.

Table shows Invitation and reminder dates for web respondents, ATP Wave

Panelists participating online were sent an email invitation and up to two email reminders if they did not respond to the survey. ATP panelists who consented to SMS messages were sent an SMS invitation with a link to the survey and up to two SMS reminders.

For panelists who take surveys over the phone with a live interviewer: Prenotification postcards were mailed on Jan. 16. Soft launch took place on Jan. 20 and involved dialing until a total of four interviews had been completed. All remaining English- and Spanish-speaking sampled phone panelists’ numbers were dialed throughout the remaining field period. Panelists who take surveys via phone can receive up to six calls from trained SSRS interviewers.

Data quality checks

To ensure high-quality data, Center researchers performed data quality checks to identify any respondents showing patterns of satisficing. This includes checking for whether respondents left questions blank at very high rates or always selected the first or last answer presented. As a result of this checking, two ATP respondents were removed from the survey dataset prior to weighting and analysis.

Weighting

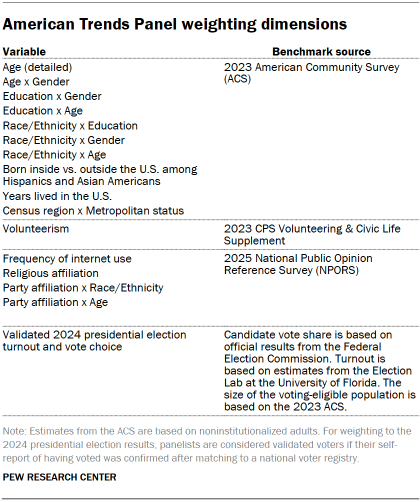
Table shows American Trends Panel weighting dimensions

The ATP data is weighted in a process that accounts for multiple stages of sampling and nonresponse that occur at different points in the panel survey process. First, each panelist begins with a base weight that reflects their probability of recruitment into the panel. These weights are then calibrated to align with the population benchmarks in the accompanying table to correct for nonresponse to recruitment surveys and panel attrition. If only a subsample of panelists was invited to participate in the wave, this weight is adjusted to account for any differential probabilities of selection. Because respondents to this wave were sampled from among respondents to Wave 183, the weights were also adjusted to account for nonresponse to Wave 183.

Among the panelists who completed the survey, this weight is then calibrated again to align with the population benchmarks identified in the accompanying table and trimmed at the 1st and 99th percentiles to reduce the loss in precision stemming from variance in the weights. Sampling errors and tests of statistical significance take into account the effect of weighting.

The following table shows the unweighted sample sizes and the error attributable to sampling that would be expected at the 95% level of confidence for different groups in the survey.

Table shows Sample sizes and margins of error, ATP Wave 185

Sample sizes and sampling errors for other subgroups are available upon request. In addition to sampling error, one should bear in mind that question wording and practical difficulties in conducting surveys can introduce error or bias into the findings of opinion polls.

Dispositions and response rates

Table shows Final dispositions, ATP Wave 185
Table shows Cumulative response rate, ATP Wave 185