Pew Research Center

FOR RELEASE MAY 23, 2024

Public’s Positive Economic Ratings Slip; Inflation Still Widely Viewed as Major Problem

Majorities in both parties remain fearful about the state of the country

FOR MEDIA OR OTHER INQUIRIES:

Communications Department
202.419.4372
www.pewresearch.org

RECOMMENDED CITATION

Pew Research Center, May 2024, "Public’s Positive Economic Ratings Slip; Inflation Still Widely Viewed as Major Problem"

About Pew Research Center

Pew Research Center is a nonpartisan, nonadvocacy fact tank that informs the public about the issues, attitudes and trends shaping the world. It does not take policy positions. The Center conducts public opinion polling, demographic research, computational social science research and other data-driven research. It studies politics and policy; news habits and media; the internet and technology; religion; race and ethnicity; international affairs; social, demographic and economic trends; science; research methodology and data science; and immigration and migration. Pew Research Center is a subsidiary of The Pew Charitable Trusts, its primary funder.

© Pew Research Center 2026

Table of contents

  • About Pew Research Center
  • Public’s Positive Economic Ratings Slip; Inflation Still Widely Viewed as Major Problem
  • 1. Views of the nation’s economy
  • 2. Top problems facing the U.S.
  • Acknowledgments
  • Methodology

Public’s Positive Economic Ratings Slip; Inflation Still Widely Viewed as Major Problem

Majorities in both parties remain fearful about the state of the country

How we did this

Pew Research Center conducted this study to understand Americans’ views of the economy and problems facing the country. For this analysis, we surveyed 8,638 adults from May 13-19, 2024. Everyone who took part in this survey is a member of the Center’s American Trends Panel (ATP), an online survey panel that is recruited through national, random sampling of residential addresses. This way nearly all U.S. adults have a chance of selection. The survey is weighted to be representative of the U.S. adult population by gender, race, ethnicity, partisan affiliation, education and other categories. Read more about the ATP’s methodology.

Here are the questions used for this report, along with responses, and the survey methodology.

Inflation may be cooling, but it continues to loom large over Americans’ evaluations of the country and the economy.
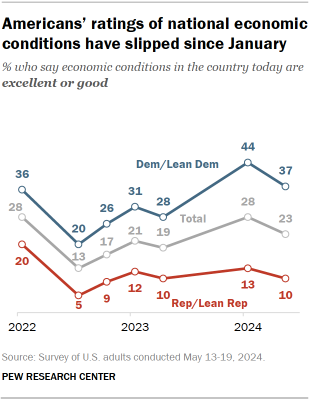
Chart shows Americans’ ratings of national economic conditions have slipped since January

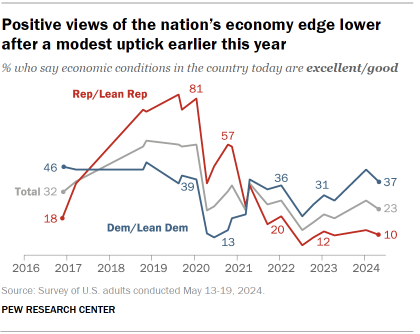
Today, 23% of U.S. adults say the economy is in excellent or good shape, down from 28% in January but higher than the 19% who rated the economy positively last April.

  • The recent negative slide in economic ratings has mainly taken place among Democrats and those who lean to the Democratic Party: 37% rate the economy positively today, down from 44% in January (but up from 28% last spring).
  • Republicans and Republican leaners’ views are little changed over this period – only one-in-ten rate the economy positively.

The public again sees inflation as one of the top problems facing the nation, with 62% saying inflation is a very big problem for the country – only slightly down from the 65% who said this last year.

But another economic concern – unemployment – is not widely viewed as a very big problem for the country. Just 25% of Americans currently say it’s a very big problem.

What’s in this report?

  • National economic and personal financial ratings (Chapter 1)
  • Trends in views of the top problems facing the nation (Chapter 2)

Views of top problems facing the nation

Two other economic concerns – the affordability of health care and the federal budget deficit – continue to be seen as very big problems for the country.
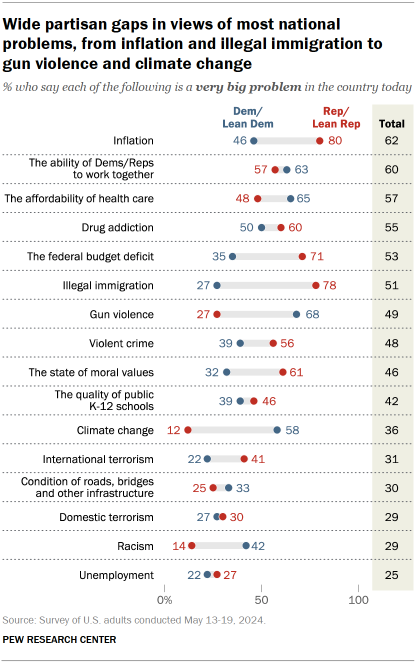
Chart shows Wide partisan gaps in views of most national problems, from inflation and illegal immigration to gun violence and climate change

The public’s list of the top problems facing the nation also includes drug addiction, illegal immigration, gun violence and violent crime. Each of these is seen as a very big problem by roughly half of the public.

  • “The ability of Republicans and Democrats to work together” also continues to rate as a top problem.
  • Of the 16 concerns included in the survey, it’s the only one that majorities in both partisan coalitions (57% of Republicans and 63% of Democrats) say is a very big problem for the country.

In contrast, the Pew Research Center survey of U.S. adults, conducted May 13-19 among 8,638 members of the Center’s nationally representative American Trends Panel, finds:

  • Republicans and GOP leaners are far more likely than Democrats and Democratic leaners to see illegal immigration, the federal budget deficit and inflation as major problems.
  • Democrats are considerably more likely than Republicans to view climate change, gun violence and racism as major national problems.

Americans’ views of the state of the nation

Americans continue to be more likely to feel fearful and angry about the state of the nation than to feel hopeful or proud – and this has largely been the case since Pew Research Center first asked these questions in June 2020.
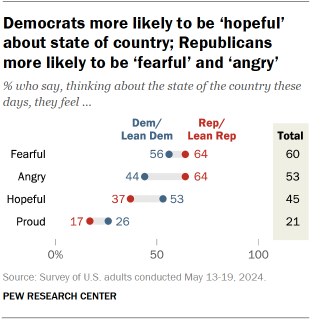
Chart shows Democrats more likely to be ‘hopeful’ about state of country; Republicans more likely to be ‘fearful’ and ‘angry’

Since Joe Biden won the 2020 presidential election, Democrats have been considerably more likely than Republicans to express positive emotions about the state of the country (and less likely to express negative emotions). This is a reversal of the partisan patterns on these questions during the Trump administration.

Still, majorities in both parties – 64% of Republicans and 56% of Democrats – say they are fearful about the state of the country.

The public also continues to express much more dissatisfaction than satisfaction with the state of the nation – a trend that dates back decades. Today, 78% of Americans are dissatisfied with national conditions, while 22% are satisfied (34% of Democrats and 10% of Republicans).
1. Views of the nation’s economy

Fewer than a quarter of Americans (23%) currently rate the country’s economic conditions as excellent or good, while 36% say they are poor and about four-in-ten (41%) view conditions as “only fair.”

While positive ratings of the economy have slowly climbed since the summer of 2022, there has been a slight drop since the start of the year – when 28% rated economic conditions as excellent or good.

Chart shows Positive views of the nation’s economy edge lower after a modest uptick earlier this year

This change has been largely driven by Democrats and Democratic leaners: In January of this year, 44% of Democrats rated the economy positively, compared with 37% now.

Still, ratings among Democrats remain higher than they were last year.

Views among Republicans and GOP leaners remain negative: Just one-in-ten rate economic conditions as excellent or good, while half say they are poor and another four-in-ten view them as “only fair.”

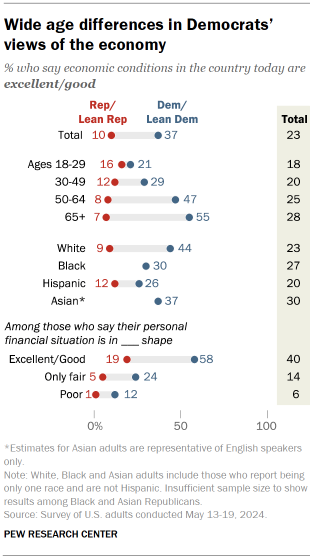
Chart shows Wide age differences in Democrats’ views of the economy

Views of the nation’s economy have long been partisan.

  • Republicans expressed far more positive views of the economy than did Democrats throughout most of Donald Trump’s presidency.
  • Democrats have been consistently more likely than Republicans to rate conditions as excellent or good during Biden’s presidency. However, their ratings have been far less positive than Republicans’ ratings of the economy were when Trump was president. 

There also are wide differences in views of the economy by age and race and ethnicity – especially among Democrats.

Age, race and ethnicity

As in the past, Democrats under age 50 express much less positive views of the nation’s economy than do Democrats 50 and older:

  • Just 21% of Democrats under 30 rate economic conditions positively, as do 29% of those 30 to 49.
  • By contrast, nearly half of Democrats ages 50 to 64 (47%) and a majority of those 65 and older (55%) say conditions are excellent or good.

However, since January there has been a steeper decline in positive views among Democrats 65 and older (from 70% to 55%) than among Democrats in younger age groups.

Republicans are much less likely to view current economic conditions in positive terms across age groups.

There are also significant differences among Democrats by race and ethnicity. White Democrats are more likely than Black, Hispanic and Asian Democrats to rate the economy positively. However, ratings have dropped across these groups since January.

Views of personal finances and national economic ratings

As might be expected, those who rate their personal finances positively also are more likely to rate national economic conditions as excellent or good.

Among the roughly four-in-ten Americans (41%) who rate their own finances positively, 40% rate the national economy positively. Among those who say their finances are only fair or poor, far fewer say national economic conditions are excellent or good (14% among only fair, 6% among poor).

However, partisanship is a factor here as well. Among Democrats who have a positive evaluation of their finances, 58% rate economic conditions positively. That compares with just 19% of Republicans who give similarly positive ratings of their financial situation.

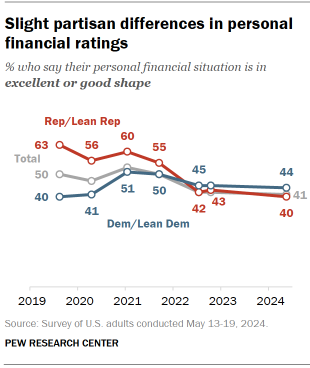
Similar shares in both parties view personal financial situation positively

Overall, personal financial ratings have fluctuated less dramatically than national ratings.

Chart shows Slight partisan differences in personal financial ratings

However, the share of Americans who rate their personal finances as excellent or good declined from about 50% in 2021 to about 40% in 2022 and has remained at about that level since then.

About four-in-ten say their financial situation is in excellent or good shape (41%), while a similar share say their situation is in “only fair” shape (39%). Another 19% say their situation is in poor shape.

Americans’ ratings of their personal finances are considerably less partisan than their views of the nation’s economy. Roughly four-in-ten Democrats (44%) say their financial situation is in excellent or good shape.

Americans’ views on the future of the economy and their financial situation

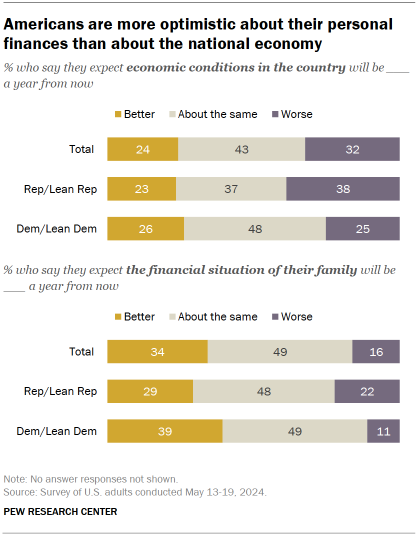
When asked for their expectations of the country’s economic conditions a year from now, 43% of Americans say they expect it to be about the same as it currently is. About a quarter (24%) say they expect the economy will be better a year from now, and nearly a third (32%) expect conditions to worsen.

Chart shows Americans are more optimistic about their personal finances than about the national economy

And when asked for their expectations of their own family’s financial situation a year from now, 49% of adults say they expect it to be about the same. Roughly a third (34%) say they expect their financial situation will be better a year from now, and 16% expect their situation to worsen.

The shares of the public who expect economic conditions to worsen on either a national level or personal level is smaller than in recent years.

Among partisans, similar shares expect economic conditions of the country to be better a year from now (23% of Republicans, 26% of Democrats). However, a larger share of Republicans than Democrats expect the country’s economic conditions to worsen (38% vs. 25%).

Republicans remain less hopeful than Democrats about the future of their personal financial situation. About three-in-ten Republicans (29%) say their family’s personal finances will be better a year from now, compared with 39% of Democrats who say the same. And twice as many Republicans as Democrats say they expect their own financial situation to worsen (22% vs. 11%).

2. Top problems facing the U.S.

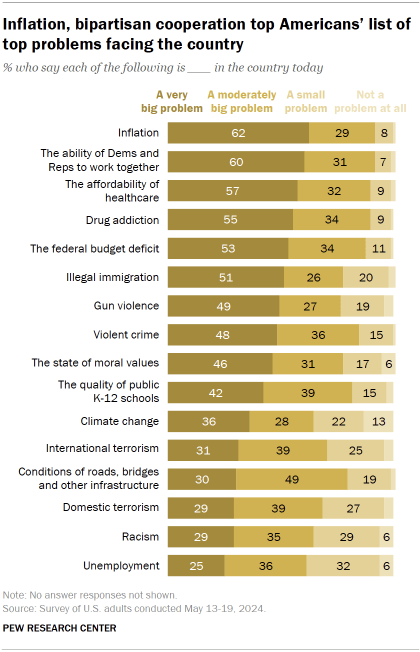
Inflation and the ability of Democrats and Republicans to work together top the public’s list of the biggest problems facing the country, with 62% of Americans describing inflation as a very big problem and 60% saying this about bipartisan cooperation.

Chart shows Inflation, affordability of health care top Americans’ list of top problems facing the country

Narrower majorities say that the affordability of healthcare (57%), drug addiction (55%) and the federal budget deficit (53%) are very big problems in the country today.

And roughly half say that illegal immigration (51%), gun violence (49%), violent crime (48%) and the state of moral values (46%) are each very big problems.

The quality of public K-12 schools, climate change and international terrorism each rate lower on the public’s list of the country’s top problems, though majorities rate these and several other issues included in the survey as at least moderately big problems.

CORRECTION (July 18, 2024): The chart, “Inflation, bipartisan cooperation top Americans’ list of top problems facing the country,” has been updated. Due to a labeling error, most of the percentages were not aligned with the correct category. The title of the chart and text in the above section was also updated to reflect these changes.

Changes in views of the country’s top problems

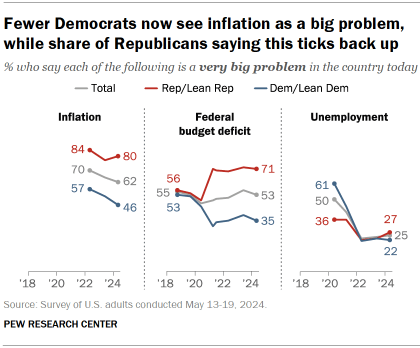
Inflation ranked as the country’s top issue in Pew Research Center surveys from 2023 and 2022, though its perceived importance is lower than it was in 2022. Today, 62% of Americans say inflation is a very big problem, down from 70% in 2022.

Partisan differences in views of inflation

Chart shows Fewer Democrats now see inflation as a big problem, while share of Republicans saying this ticks back up
  • Eight-in-ten Republicans and independents who lean to the Republican Party say that inflation is a very big problem. A far smaller share of Democrats and Democratic leaners – 46% – say the same.
  • The share of Republicans who see inflation as a big problem is up slightly over the past year (from 77% to 80%). In contrast, the share of Democrats seeing inflation as a very big problem for the country has decreased by 6 percentage points over this period.

Federal budget deficit

A narrow majority of the public (53%) says the federal budget deficit is a very big problem. This is little changed in recent years.

Since Joe Biden took office in 2021, Republicans have consistently been about twice as likely as Democrats to describe the federal budget deficit as a very big problem for the country. Roughly seven-in-ten Republicans (71%) say this, compared with 35% of Democrats. During the Trump administration, there was no partisan gap in these views.

Unemployment

Just a quarter of Americans – including similar shares of Republicans (27%) and Democrats (22%) – describe unemployment as a very big problem. The share who view unemployment as a very big problem is essentially unchanged since 2022.

Illegal immigration

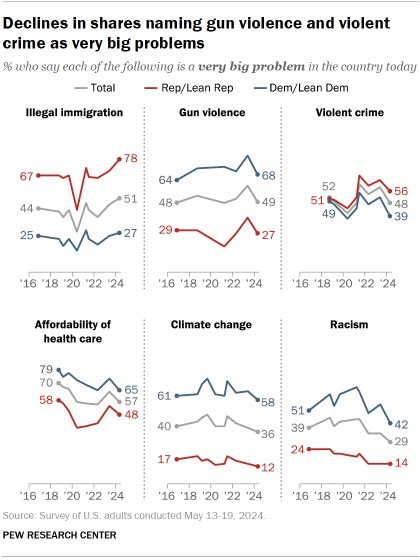
The share of the public that views illegal immigration as a very big problem has increased slightly in the past year, to 51% from 47%.

Chart shows Declines in shares naming gun violence and violent crime as very big problems

Nearly eight-in-ten Republicans (78%) say illegal immigration is a very big problem, up from 70% a year ago. In contrast, just 27% of Democrats say this, almost unchanged from the 25% of Democrats who said illegal immigration was a very big problem a year ago.

Crime and gun violence

Americans are less likely to view both gun violence and violent crime as very big problems than they were a year ago. The shares of both Republicans and Democrats who describe each of these as a very big problem are down somewhat over this period.

Democrats are still far more likely than Republicans to see gun violence as a very big problem (68% of Democrats say this vs. 27% of Republicans). And it ranks as one of the top national problems seen by Democrats (as it did in 2023).

And Republicans continue to be more likely than Democrats (56% vs. 39%) to view violent crime as a very big problem for the country.

Climate change

About a third of Americans (36%) say climate change is a very big problem, down 11 points since 2021.

Democrats are 13 points less likely to say this than they were in 2021, when 71% of Democrats described climate change as a very big problem. Republicans’ views of the importance of climate change have declined by 7 points since 2021.

Racism

Overall, 29% of Americans say racism is a very big problem. This is a substantial decline since 2021, when 45% said this. Among Democrats, the decline is particularly steep: 42% of Democrats now say that racism is a very big problem in the country today, down from 67% in 2021.

(For Republicans’ and Democrats’ views of all problems asked about in this survey, please visit the overview of this report.)

Acknowledgments

This report is a collaborative effort based on the input and analysis of the following individuals:

Research team

Carroll Doherty, Director, Political Research
Jocelyn Kiley, Associate Director, Political Research
Baxter Oliphant, Senior Researcher
Hannah Hartig, Senior Researcher
Gabe Borelli, Research Associate
Andrew Daniller, Research Associate
Joseph Copeland, Research Analyst
Ted Van Green, Research Analyst
Andy Cerda, Research Assistant
Shanay Gracia, Research Assistant

Communications and editorial

Nida Asheer, Senior Communications Manager
Talia Price, Communications Associate
David Kent, Senior Copy Editor

Graphic design and web publishing

Alissa Scheller, Senior Information Graphics Designer
Reem Nadeem, Digital Production

Methodology

Andrew Mercer, Senior Research Methodologist
Dorene Asare-Marfo, Panel Manager
Dana Popky, Associate Panel Manager
Arnold Lau, Research Methodologist

Methodology

The American Trends Panel survey methodology

Overview

The American Trends Panel (ATP), created by Pew Research Center, is a nationally representative panel of randomly selected U.S. adults. Panelists participate via self-administered web surveys. Panelists who do not have internet access at home are provided with a tablet and wireless internet connection. Interviews are conducted in both English and Spanish. The panel is being managed by Ipsos.

Data in this report is drawn from ATP Wave 148, conducted from May 13 to May 19, 2024, and includes an oversample of non-Hispanic Asian adults, non-Hispanic Black adults, Hispanic adults, adults ages 18 to 29 and panelists who are using a Center-provided tablet, in order to provide more precise estimates of the opinions and experiences of these smaller demographic subgroups. These oversampled groups are weighted back to reflect their correct proportions in the population.

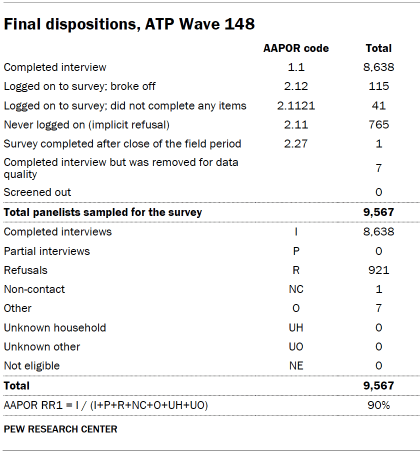
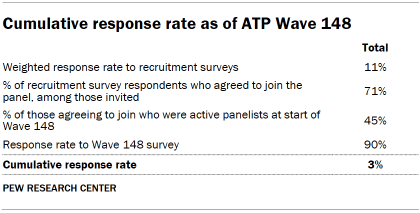
A total of 8,638 panelists responded out of 9,567 who were sampled, for a response rate of 90%. The cumulative response rate accounting for nonresponse to the recruitment surveys and attrition is 3%. The break-off rate among panelists who logged on to the survey and completed at least one item is 1%. The margin of sampling error for the full sample of 8,638 respondents is plus or minus 1.5 percentage points.

Panel recruitment

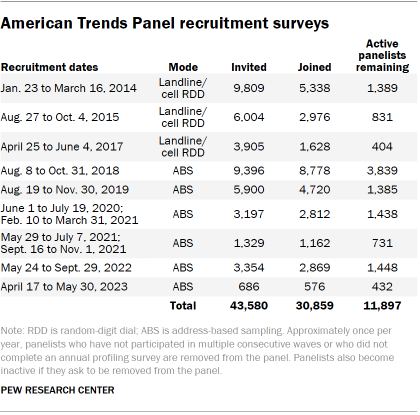
The ATP was created in 2014, with the first cohort of panelists invited to join the panel at the end of a large, national, landline and cellphone random-digit-dial survey that was conducted in both English and Spanish. Two additional recruitments were conducted using the same method in 2015 and 2017, respectively. Across these three surveys, a total of 19,718 adults were invited to join the ATP, of whom 9,942 (50%) agreed to participate.

Table shows American Trends Panel recruitment surveys

In August 2018, the ATP switched from telephone to address-based sampling (ABS) recruitment. A study cover letter and a pre-incentive are mailed to a stratified, random sample of households selected from the U.S. Postal Service’s Delivery Sequence File. This Postal Service file has been estimated to cover as much as 98% of the population, although some studies suggest that the coverage could be in the low 90% range.1 Within each sampled household, the adult with the next birthday is asked to participate. Other details of the ABS recruitment protocol have changed over time but are available upon request.2

We have recruited a national sample of U.S. adults to the ATP approximately once per year since 2014. In some years, the recruitment has included additional efforts (known as an “oversample”) to boost sample size with underrepresented groups. For example, Hispanic adults, Black adults and Asian adults were oversampled in 2019, 2022 and 2023, respectively.

Across the six address-based recruitments, a total of 23,862 adults were invited to join the ATP, of whom 20,917 agreed to join the panel and completed an initial profile survey. Of the 30,859 individuals who have ever joined the ATP, 11,897 remained active panelists and continued to receive survey invitations at the time this survey was conducted.

The American Trends Panel never uses breakout routers or chains that direct respondents to additional surveys.

Sample design

The overall target population for this survey was noninstitutionalized persons ages 18 and older living in the U.S., including Alaska and Hawaii. It featured a stratified random sample from the ATP in which Hispanic men, non-Hispanic Black men, non-Hispanic Asian adults, adults ages 18 to 29 and panelists who are using a Center-provided tablet were selected with certainty. The remaining panelists were sampled at rates designed to ensure that the share of respondents in each stratum is proportional to its share of the U.S. adult population to the greatest extent possible. Respondent weights are adjusted to account for differential probabilities of selection as described in the Weighting section below.

Questionnaire development and testing

The questionnaire was developed by Pew Research Center in consultation with Ipsos. The web program was rigorously tested on both PC and mobile devices by the Ipsos project management team and Pew Research Center researchers. The Ipsos project management team also populated test data that was analyzed in SPSS to ensure the logic and randomizations were working as intended before launching the survey.

Incentives

All respondents were offered a post-paid incentive for their participation. Respondents could choose to receive the post-paid incentive in the form of a check or a gift code to Amazon.com or could choose to decline the incentive. Incentive amounts ranged from $5 to $20 depending on whether the respondent belongs to a part of the population that is harder or easier to reach. Differential incentive amounts were designed to increase panel survey participation among groups that traditionally have low survey response propensities.

Data collection protocol

The data collection field period for this survey was May 13 to May 19, 2024. Postcard notifications were mailed to a subset of ATP panelists3 with a known residential address on May 13.

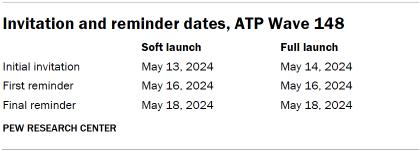
Table shows Invitation and reminder dates, ATP Wave 148

Invitations were sent out in two separate launches: soft launch and full launch. Seventy panelists were included in the soft launch, which began with an initial invitation sent on May 13. The ATP panelists chosen for the initial soft launch were comprised of 60 known responders who had completed previous ATP surveys within one day of receiving their invitation and a random sample of 10 panelists who are using a Center-provided tablet. All remaining English- and Spanish-speaking sampled panelists were included in the full launch and were sent an invitation on May 14.

All panelists with an email address received an email invitation and up to two email reminders if they did not respond to the survey. All ATP panelists who consented to SMS messages received an SMS invitation and up to two SMS reminders.

Data quality checks

To ensure high-quality data, the Center’s researchers performed data quality checks to identify any respondents showing clear patterns of satisficing. This includes checking for whether respondents left questions blank at very high rates or always selected the first or last answer presented. As a result of this checking, seven ATP respondents were removed from the survey dataset prior to weighting and analysis.

Weighting

The ATP data is weighted in a multistep process that accounts for multiple stages of sampling and nonresponse that occur at different points in the survey process.

Table shows American Trends Panel weighting dimensions

First, each panelist begins with a base weight that reflects their probability of selection for their initial recruitment survey. These weights are then rescaled and adjusted to account for changes in the design of ATP recruitment surveys from year to year.

Finally, the weights are calibrated to align with the population benchmarks in the accompanying table to correct for nonresponse to recruitment surveys and panel attrition. If only a subsample of panelists was invited to participate in the wave, this weight is adjusted to account for any differential probabilities of selection.

Among the panelists who completed the survey, this weight is then calibrated again to align with the population benchmarks identified in the accompanying table and trimmed at the 2nd and 98th percentiles to reduce the loss in precision stemming from variance in the weights. This trimming is performed separately among non-Hispanic Black, non-Hispanic Asian, Hispanic and all other respondents. Sampling errors and tests of statistical significance take into account the effect of weighting.

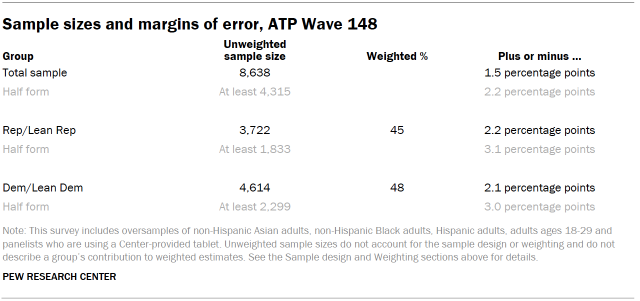
The following table shows the unweighted sample sizes and the error attributable to sampling that would be expected at the 95% level of confidence for different groups in the survey.

Table shows Sample sizes and margins of error, ATP Wave 148

Sample sizes and sampling errors for other subgroups are available upon request. In addition to sampling error, one should bear in mind that question wording and practical difficulties in conducting surveys can introduce error or bias into the findings of opinion polls.

Dispositions and response rates

Table shows Final dispositions, ATP Wave 148
Table shows Cumulative response rate as of ATP Wave 148

© Pew Research Center 2024