Pew Research Center

FOR RELEASE SEPTEMBER 19, 2023

Americans’ Dismal Views of the Nation’s Politics

65% say they always or often feel exhausted when thinking about politics

FOR MEDIA OR OTHER INQUIRIES:

Communications Department
202.419.4372
www.pewresearch.org

RECOMMENDED CITATION

Pew Research Center, September 2023, "Americans’ Dismal Views of the Nation’s Politics"

About Pew Research Center

Pew Research Center is a nonpartisan, nonadvocacy fact tank that informs the public about the issues, attitudes and trends shaping the world. It does not take policy positions. The Center conducts public opinion polling, demographic research, computational social science research and other data-driven research. It studies politics and policy; news habits and media; the internet and technology; religion; race and ethnicity; international affairs; social, demographic and economic trends; science; research methodology and data science; and immigration and migration. Pew Research Center is a subsidiary of The Pew Charitable Trusts, its primary funder.

© Pew Research Center 2026

Table of contents

  • About Pew Research Center
  • Americans’ Dismal Views of the Nation’s Politics
  • 1. The biggest problems and greatest strengths of the U.S. political system
  • 2. Views of the U.S. political system, the federal government and federal-state relations
  • 3. How Americans view Congress, the president, state and local political leaders
  • 4. The Republican and Democratic parties
  • 5. Money, power and the influence of ordinary people in American politics
  • 6. Evaluations of members of Congress and the biggest problem with elected officials today
  • 7. Candidate quality and what drives elected officials to run for office
  • 8. The presidency and presidential politics
  • 9. How well the major parties represent Americans, the public’s feelings about more political parties
  • 10. How Americans view proposals to change the political system
  • 11. Americans’ feelings about politics, polarization and the tone of political discourse
  • Acknowledgments
  • Methodology

Americans’ Dismal Views of the Nation’s Politics

65% say they always or often feel exhausted when thinking about politics

How we did this

Pew Research Center conducted this study to better understand how Americans view the state of U.S. politics today, and to explore in depth how the public thinks about the quality of their political representation and the relationship between political actors and the people they represent. This analysis seeks to examine feelings about the U.S. government, the political environment, elected officials and political candidates and shed further light on the specific factors contributing to overall views.

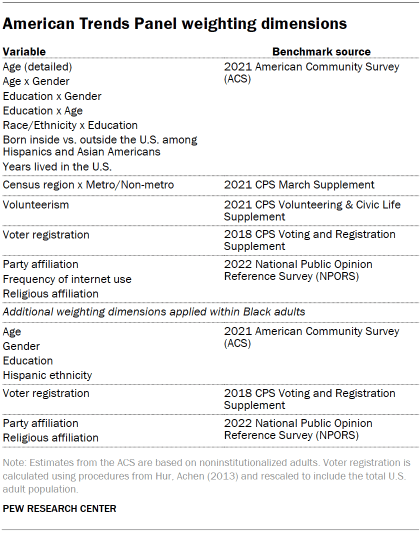
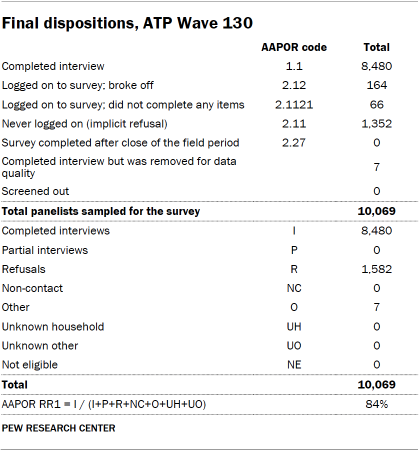
This report is based primarily on a survey of 8,480 adults from July 10 to July 16, 2023. Some of the analysis in this report is based on a survey of 5,115 adults from June 5 to 11, 2023. Everyone who took part in these surveys is a member of the Center’s American Trends Panel (ATP), an online survey panel that is recruited through national, random sampling of residential addresses. This way nearly all U.S. adults have a chance of selection. The survey is weighted to be representative of the U.S. adult population by gender, race, ethnicity, partisan affiliation, education and other categories. Read more about the ATP’s methodology.

Here are the questions used for the report, along with responses, and its methodology.

Americans have long been critical of politicians and skeptical of the federal government. But today, Americans’ views of politics and elected officials are unrelentingly negative, with little hope of improvement on the horizon.

Majorities say the political process is dominated by special interests, flooded with campaign cash and mired in partisan warfare. Elected officials are widely viewed as self-serving and ineffective.

A comprehensive new Pew Research Center study of the state of the nation’s politics finds no single focal point for the public’s dissatisfaction. There is widespread criticism of the three branches of government, both political parties, as well as political leaders and candidates for office.  

Notably, Americans’ unhappiness with politics comes at a time of historically high levels of voter turnout in national elections. The elections of 2018, 2020 and 2022 were three of the highest-turnout U.S. elections of their respective types in decades.

But voting in elections is very different from being satisfied with the state of politics – and the public is deeply dissatisfied.

  • Just 4% of U.S. adults say the political system is working extremely or very well; another 23% say it is working somewhat well. About six-in-ten (63%) express not too much or no confidence at all in the future of the U.S. political system.
  • Positive views of many governmental and political institutions are at historic lows. Just 16% of the public say they trust the federal government always or most of the time. While trust has hovered near historic lows for the better part of the last 20 years, today it stands among the lowest levels dating back nearly seven decades. And more Americans have an unfavorable than favorable opinion of the Supreme Court – the first time that has occurred in polling going back to the late 1980s.
  • A growing share of the public dislikes both political parties. Nearly three-in-ten (28%) express unfavorable views of both parties, the highest share in three decades of polling. And a comparable share of adults (25%) do not feel well-represented by either party.
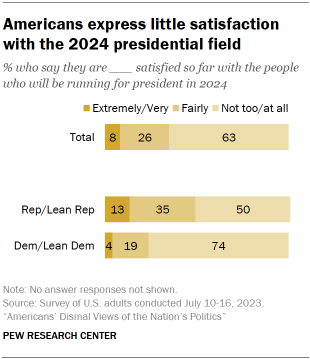
  • Candidate choices are underwhelming. As the presidential campaign heats up, 63% of Americans say they are dissatisfied with the candidates who have emerged so far. Setting aside the presidential campaign, there has been a downward trend in views of the quality of all political candidates. Just 26% rate the quality of political candidates as very or somewhat good, down about 20 percentage points since 2018.
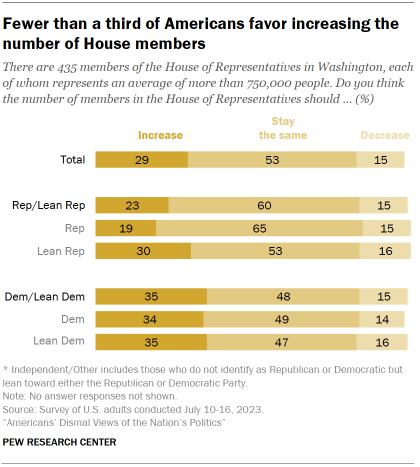
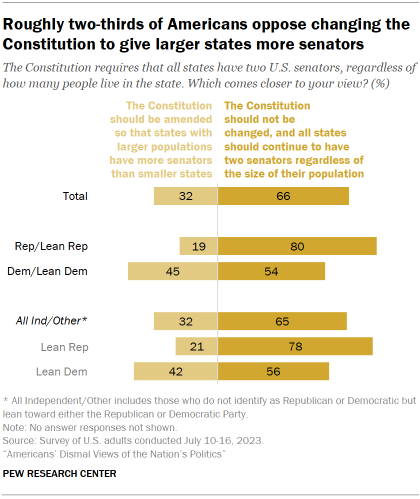
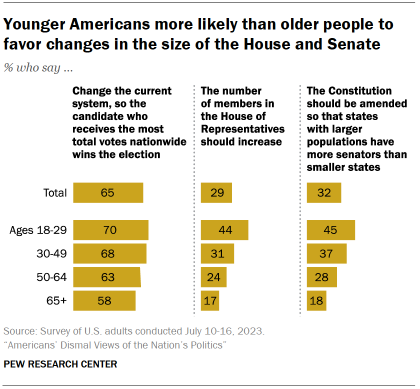
  • Majorities back age and term limits and eliminating the Electoral College. Reflecting the public’s frustration with the federal government and political leaders, large shares of Americans support various changes to the political system, including for such long-standing proposals as establishing term limits for members of Congress and scrapping the Electoral College. Age limits – for both federal elected officials and members of the Supreme Court – draw broad support. But there is little appetite in the public for increasing the size of the U.S. House or modifying the allocation of Senate seats.
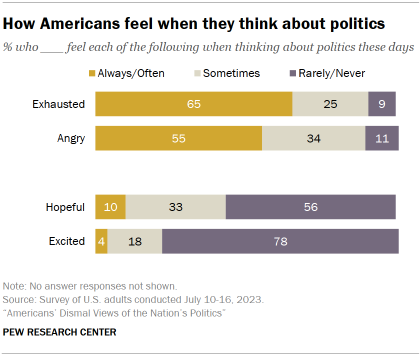
Chart shows how Americans feel when they think about politics

The new study of Americans’ views of the state of the political system is primarily based on a survey conducted July 10-16, 2023, among 8,480 adults, with additional data from a survey conducted June 5-11, 2023, among 5,115 adults. Both were conducted on Pew Research Center’s nationally representative American Trends Panel.

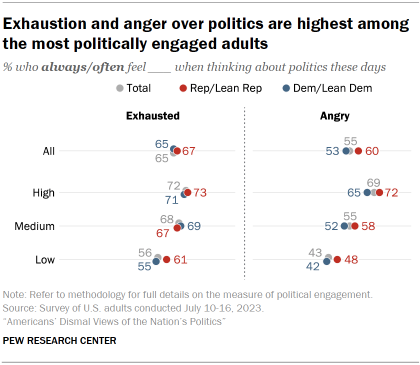
A little more than a year before the presidential election, nearly two-thirds of Americans (65%) say they always or often feel exhausted when thinking about politics, while 55% feel angry. By contrast, just 10% say they always or often feel hopeful about politics, and even fewer (4%) are excited.
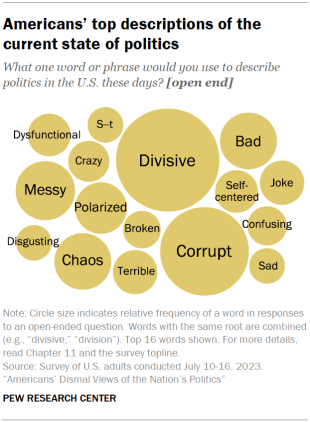
Chart shows Americans’ top descriptions of the current state of politics

The survey also provides people several opportunities to describe in their own words their feelings about the political system and elected officials. When asked to sum up their feelings about politics in a word or phrase, very few (2%) use positive terms; 79% use negative or critical words, with “divisive” and “corrupt” coming up most frequently.

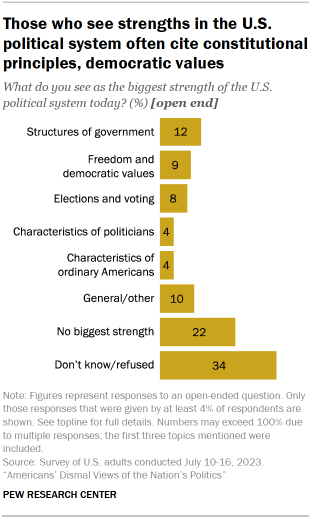
We also asked people to identify the strengths of the political system, as well as its weaknesses. Among the positive responses, roughly one-in-ten point to the structures of U.S. government, including its system of checks and balances (12%), freedoms and democratic values (9%) and the opportunity to vote in elections (8%).

Yet it is telling that a majority of Americans are unable or unwilling to identify strong points of the nation’s political system. While about a third gave no answer, another 22% write “nothing” – meaning that in their view, the political system does not have any strengths.

Explore this report

This overview covers key takeaways from our study of Americans’ attitudes about the political system and political representation. For more in-depth analysis, we encourage you to explore the full report. All chapters are listed out in the table of contents and at the bottom of the page.

These views and other negative sentiments are widely shared among older and younger Americans, White, Black, Hispanic and Asian adults, people who are highly engaged in politics and those who are less engaged. And in most cases, the partisan differences in these attitudes are relatively modest.

In an era defined by partisan polarization, the parties share little common ground politically. But they do share a deep unhappiness with the current state of politics.

The impact of partisan polarization

Ordinary Americans are more polarized than in the past. Partisan divisions on issues are wider than they were a few decades ago, and many Americans hold deeply negative views of those on the “other side” of politics.

Yet the public also is highly critical of the impact of partisan polarization on politics.

More than eight-in-ten Americans (86%) say the following is a good description of politics: “Republicans and Democrats are more focused on fighting each other than on solving problems.”
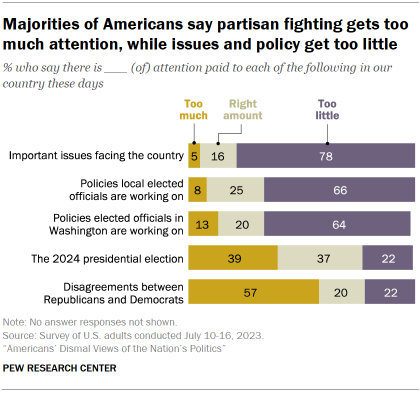
Chart shows majorities of Americans say partisan fighting gets too much attention, while issues and policy get too little

Asked to describe in their own words the biggest problem with the political system, 22% of Americans volunteer partisan polarization or lack of partisan cooperation. Only critiques of politicians (31%) are mentioned more frequently.

Most people (57%) also believe that conflicts between Republicans and Democrats receive too much attention these days. And 78% say there is too little focus on important issues facing the country.

Persistent concerns over money in politics

The public’s belief that special interests and campaign donors have too much influence on politics is not new. Since the 1970s, large majorities have said that the government “is run by a few big interests looking out for themselves,” rather than for the benefit for all the people.

Yet money in politics emerges again and again as a major source of public frustration.

Chart shows Most Americans are critical of the role of money in politics; 72% favor limits on political spending
  • Most say the cost of campaigns keeps good candidates from running. An overwhelming majority (85%) holds the view that “the cost of political campaigns makes it hard for good people to run for office.”
  • Members of Congress are widely seen as mixing financial interests with their work. About eight-in-ten Americans (81%) say members of Congress do a very or somewhat bad job of “keeping their personal financial interests separate from their work in Congress.”
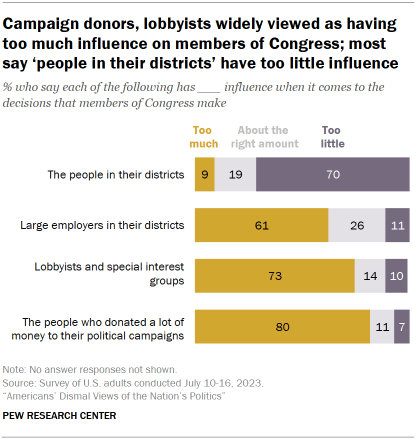
  • Americans feel major donors have too much influence. Large majorities say big campaign donors (80%) and lobbyists and special interests (73%) have too much influence on decisions made by members of Congress.

People in members’ own districts, by contrast, are widely viewed as having too little influence (70% say this).

A sizable majority (72%) – including comparable majorities in both parties – support limits on the amounts of money individuals and organizations can spend on political campaigns. And 58% believe it is possible to have laws that would effectively reduce the role of money in politics. (Explore this further in Chapter 5.)

Views of the parties and possible changes to the two-party system

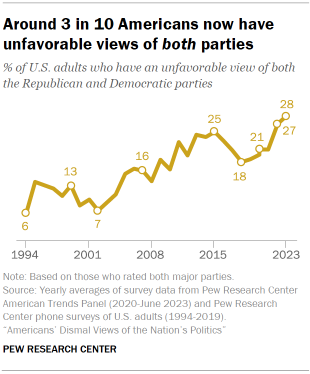
Chart shows Since the mid-1990s, the share of Americans with unfavorable views of both parties has more than quadrupled

Neither party is particularly popular with the public. Only about four-in-ten adults have a favorable view of the Democratic Party (37%), while about as many (36%) have a favorable impression of the Republican Party.

An increasing share of Americans express negative opinions of both parties. Currently, 28% of the public has an unfavorable opinion of both the Republican and Democratic parties.

That is little changed from a year ago, but nonetheless is the highest share expressing dislike of both parties in nearly three decades. In 1994, just 6% of Americans viewed both parties negatively.

Many people are open to the idea of having more political parties: 37% say the phrase “I often wish there were more parties to choose from” describes their views extremely or very well. Nearly half of independents and those who identify with other parties (47%) – including 56% of Democratic-leaning independents – say this. (Views of the two major parties, the party system and support for additional parties are discussed in more detail in Chapter 4 and Chapter 9.)
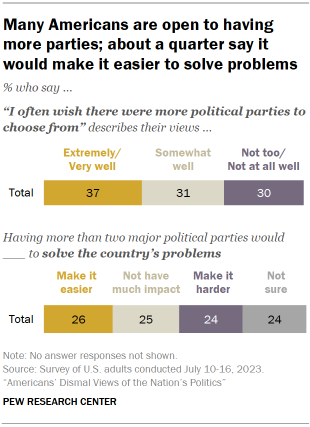
Chart shows Many Americans are open to having more parties; about a quarter say it would make it easier to solve problems

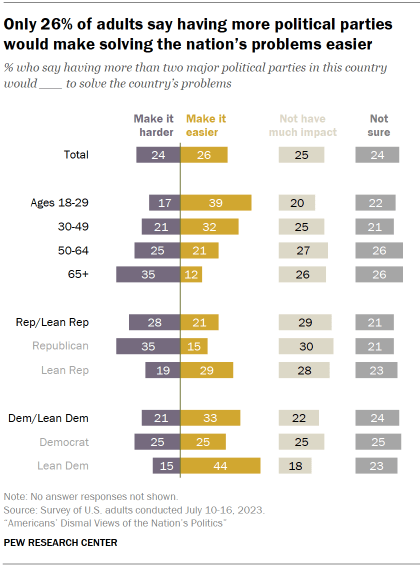
However, there is considerable skepticism that having more parties would make it easier for the country to solve its problems. About a quarter (26%) say it would make it easier to solve problems, while nearly as many (24%) say it would make it harder; a quarter say it would not have much impact.

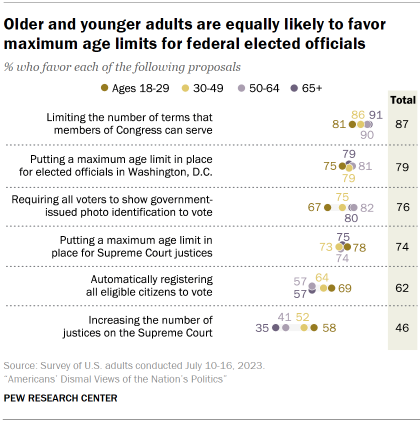
The survey includes a number of proposals to change the way politics is run in this country. Some have attracted majority public support for many years, including ending the Electoral College system, placing term limits on members of Congress, automatically registering all citizens to vote and requiring all voters to show government-issued photo identification to vote. (Opinions about proposals for changing the political system are covered in Chapter 10.)

Large majorities of Americans also support:

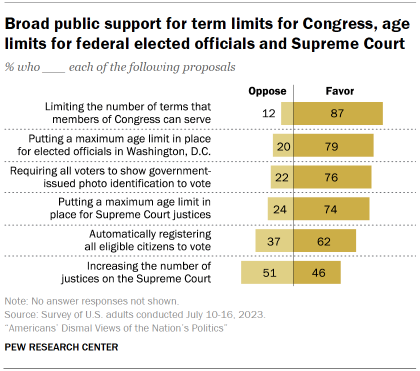
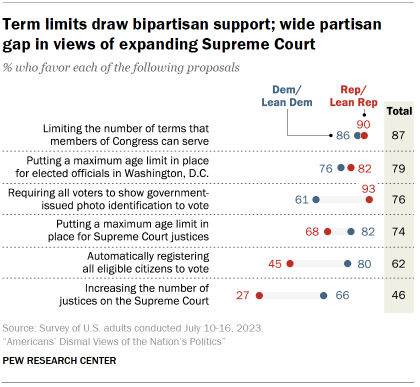
  • Age limits for federal elected officials. Amid widespread concern over the advanced age of many political leaders, including President Joe Biden, former President Donald Trump and some members of Congress, 79% of the public favors putting a maximum age in place for elected officials in Washington, D.C. These views also are widely shared across partisan lines.
  • Age limits for the Supreme Court. Nearly as many Americans (74%) support putting age limits in place for justices of the Supreme Court. Democrats (82% favor) are more supportive of creating age limits for the justices than are Republicans (68%).
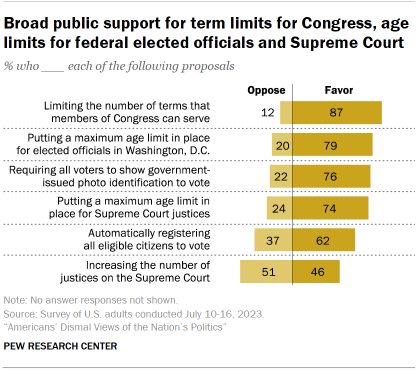
Chart shows broad public support for term limits for Congress, age limits for federal elected officials and Supreme Court

Another proposal that would dramatically affect the Supreme Court – increasing the number of justices – attracts considerably less support from the public.

Slightly more Americans oppose (51%) than favor (46%) increasing the number 0f justices on the court. There is a wide partisan gap in these views: Democrats (66%) are more than twice as likely as Republicans (27%) to favor expanding the court.

Other important findings

Recent presidential campaigns viewed as too long, not informative. Americans are not just unhappy about the current state of politics; they also take a critical view of recent presidential campaigns. Nearly eight-in-ten (78%) say recent nominees have not been good candidates, while large majorities also say the campaigns have not focused on the right issues or been informative, and 72% say they “lasted too long.” (Chapter 8)
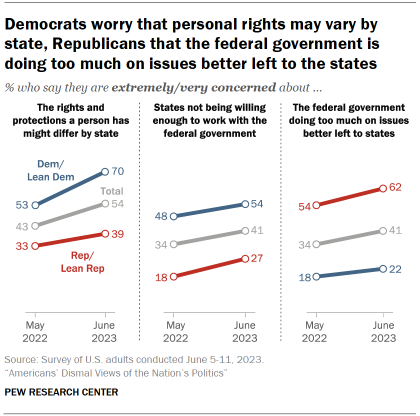
Chart shows Democrats worry that personal rights may vary by state, Republicans that the federal government is doing too much on issues better left to the states

Growing public concerns over different dimensions of federal-state relations. A majority of Americans (54%) are extremely or very concerned that “the rights and protections a person has might be different depending on which state they are in,” up from 43% just a year ago. Increasing shares also express concerns about the federal government doing too much that is better left to the states, as well as state governments not being willing enough to work with the federal government. (Chapter 2)

Elected officials are held in extremely low regard. When asked why local and national elected officeholders run for office, relatively small shares of Americans say they run to serve the public or address issues they care about. By contrast, majorities say all or most politicians are motivated by selfish reasons, including 63% who say all or most ran for office to make a lot of money. (Chapter 7)

Majority says voting can affect the country’s direction. Nearly six-in-ten (57%) say voting by people like them can affect the country’s future direction, though just 20% say it can affect this a lot. Adults younger than 50 are less likely than older people to say voting can have at least some effect on the country’s future direction. (Chapter 5)

Explore chapters of this report

1. Problems and strengths of the political system

2. Trust in government, federal-state relations

3. Political leaders

4. The Republican and Democratic parties

5. Money, power and the influence of ordinary Americans

6. Congress and elected officials

7. Candidate quality and why elected officials run for office

8. The presidency and presidential politics

9. Representation by the two major parties; support for more parties

10. Proposals to change the political system

11. Feelings about politics and polarization

1. The biggest problems and greatest strengths of the U.S. political system

The public sees a number of specific problems with American politics. Partisan fighting, the high cost of political campaigns, and the outsize influence of special interests and lobbyists are each seen as characteristic of the U.S. political system by at least 84% of Americans.

Yet 63% also say that “ordinary Americans care about making the political system work well” is a good description of U.S. politics today. Still, when asked to describe a strength of the political system in their own words, more than half either say “nothing” (22%) or decline to give an answer (34%).

Americans view negative statements as better descriptions of the political system than positive ones

Chart shows widely shared criticisms of politics: Partisan fights, costly campaigns, influence of special interests

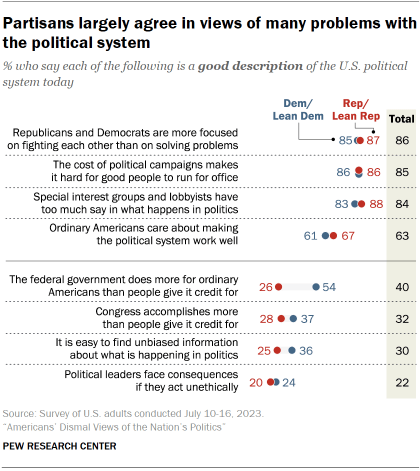
More than eight-in-ten adults say that each of the following is at least a somewhat good description of the U.S. political system today:

  • Republicans and Democrats are more focused on fighting each other than on solving problems (86%);
  • The cost of political campaigns makes it hard for good people to run for office (85%);
  • Special interest groups and lobbyists have too much say in what happens in politics (84%).

About six-in-ten (63%) think ordinary Americans want to make the political system work well. This is the rare positive sentiment that a majority views as a good descriptor of the political system.

Fewer than half of adults hold the view that the government deserves more credit than it gets: Majorities say that “the federal government does more for ordinary Americans than people give it credit for” (59%) and “Congress accomplishes more than people give it credit for” (65%) are both bad descriptions of the political system.

Nearly seven-in-ten adults express frustration with the availability of unbiased information about politics: 68% say the statement “it is easy to find unbiased information about what is happening in politics” is not a good description of the political system.

And just 22% of Americans say that political leaders facing consequences for acting unethically is a good description of the political system. They are more than three times as likely to say that this is a bad description (76% say this).

Many critiques of the political system are bipartisan

Partisans have similar views of many of the descriptions of the political system included in the survey.

Chart shows Partisans largely agree in views of many problems with the political system

Overwhelming majorities in both parties think there is too much partisan fighting, campaigns cost too much, and lobbyists and special interests have too much say in politics. And just 24% of Democrats and Democratic-leaning independents and 20% of Republicans and Republican leaners say that political leaders face consequences if they act unethically.

The widest partisan gap is over a description of the federal government. Democrats are roughly twice as likely as Republicans to say “the federal government does more for ordinary Americans than people give it credit for” (54% vs. 26%).

There is a narrower gap in views of Congress’ accomplishments: 37% of Democrats and 28% of Republicans say it accomplishes more than people give it credit for.

Democrats are also more likely to say, “It is easy to find unbiased information about what is happening in politics” (36% of Democrats and 25% of Republicans say this is a good description of the political system today), while Republicans are slightly more likely than Democrats to view ordinary Americans as wanting to make the political system work well (67% of Republicans and 61% of Democrats say this is a good description).

In their own words: Americans on the political system’s biggest problems

Chart shows roughly a third of Americans say ‘politicians’ are the biggest problem with the political system today

When asked to describe in their own words the biggest problem with the political system in the U.S. today, Americans point to a wide range of factors.

Negative characteristics attributed to politicians and political leaders are a common complaint: 31% of U.S. adults say politicians are the biggest problem with the system, including 15% who point to greed or corruption and 7% who cite dishonesty or a lack of trustworthiness.

The biggest problem, according to one woman in her 50s, is that politicians are “hiding the truth and fulfilling their own agendas.” Similarly, a man in his 30s says, “They don’t work for the people. They are too corrupt and busy filling their pockets.”

Explore more voices: The political system’s biggest problems

What do you see as the biggest problem with the political system in the U.S. today?

“An almost total lack of credibility and trust. Coupled with a media that’s so biased, that they’ve lost all objectivity.” –Man, 70s

“Lying about intentions or not following through with what elected officials said they would do.” –Woman, 20s

“Blind faith in political figures.” –Woman, 50s

“Our elected officials would rather play political games than serve the needs of their constituents.” –Woman, 50s

“Same politicians in office too long.” –Woman, 30s

“Extremism on both sides exploited by the mainstream media for ratings. It is making it impossible for both parties to work together.” –Man, 30s

“It has become too polarized. No one is willing to compromise or be moderate.” –Woman, 40s

“Too much money in politics coming from large corporations and special interest.” –Man, 30s

“The people have no say in important matters, we have NO representation at all. Our lawmakers are isolated and could care less what we want.” –Man, 60s

About two-in-ten adults cite deep divisions between the parties as the biggest problem with the U.S. political system, with respondents describing a lack of cooperation between the parties or among elected leaders in Washington.

“Both of the political parties are so busy trying to stop the other party, they are wasting their opportunities to solve the problems faced by our nation,” in the view of one man in his 70s.

Even as some blame polarization, others (10% of respondents) identify the other party as the system’s biggest problem. Some Republicans say that the biggest problem is “Democrats” while some Democrats simply say “Republicans.”

Smaller but substantial shares of adults name the media and political discourse (9%), the influence of money in politics (7%), government’s perceived failures (6%), specific policy areas and issues (6%) or problems with elections and voting (4%) as the biggest problem with the political system today.

In their own words: Americans on the political system’s biggest strengths

Chart shows those who see strengths in the U.S. political system often cite constitutional principles, democratic values

Far fewer adults name a specific strength of the political system today when asked to describe the system’s biggest strength in their own words. More than half either say that the system lacks a biggest strength (22%) or decline to answer (34%). As one woman in her 60s writes, “I’m not seeing any strengths!”

Among those who do identify strengths of the U.S. political system, the structure of political institutions and the principles that define the constitutional order are named most frequently (by 12% of respondents). Many respondents specifically point to the Constitution itself or refer to the separation of powers or the checks and balances created by the Constitution.

A man in his 20s believes that the “separation of powers and federalism work pretty well,” while one in his 30s writes that the system’s greatest strength is “the checks and balances to make sure that monumental changes aren’t made unilaterally.”

Explore more voices: The political system’s biggest strengths

What do you see as the biggest strength of the U.S. political system today?

“Everyone getting a say; democracy.” –Woman, 40s

“The right to have your opinions heard.” –Man, 60s

“In spite of our differences, we are still a democracy, and I believe there are people within our government who still care and are interested in the betterment of our country.” –Woman, 50s

“The freedom of speech and religion” –Woman, 50s

“If we have fair, honest elections we can vote out the corruption and/or incompetent politicians.” –Man, 70s

“The Constitution.” –Man, 50s

“The checks and balances to control the power of any office. The voice of the people and the options to remove an official from office.” –Man, 60s

“New, younger voices in government.” –Woman, 40s

“If we can’t get more bipartisanship we’ll become weaker. Our biggest strength is our working together.” –Woman, 60s

“The way that every two years the people get to make their voice heard.” –Man, 30s

About one-in-ten (9%) refer to individual freedoms and related democratic values, while a similar share (8%) discuss the right to vote and the existence of free elections. A woman in her 70s echoes many similar comments when she points to “the possibility of change in upcoming elections.”

However, even some of the descriptions of positive characteristics of the system are couched in respondents’ doubts about the way the system is working today. One woman in her 50s adds a qualification to what she views as the system’s biggest strength, saying, “Theoretically every voter has a say.”

Smaller shares of the public point to the positive characteristics of some politicians (4%) or the positive characteristics of the American people (4%) as reasons for optimism.

Are there clear solutions to the nation’s problems?

The public remains roughly evenly split over whether there are clear solutions to the biggest issues facing the country. Half of Americans today say there are clear solutions to most of the big issues facing the country, while about as many (48%) say most big issues don’t have clear solutions.

Chart shows Americans are split over whether there are clear solutions to big national issues

There are relatively modest demographic and political differences in perceptions of whether the solutions to the nations’ problems are clear or not.

Gender

While both men and women are relatively divided on this question, women are 6 percentage points more likely to think the big issues facing the country don’t have clear solutions.

Race and ethnicity

While 43% of Hispanic adults and about half of Black (50%) and White (48%) adults say there aren’t clear solutions for most big issues, that rises to 62% among Asian adults.

Age

Age differences on this question are modest, but those under 30 are slightly more likely than those 30 and older to say most big issues have clear solutions.

Partisanship and political engagement

Both Republicans and Democrats are relatively split on this question, though Republicans are slightly more likely to say there are clear solutions to most big issues.

Those with higher levels of political engagement are more likely to say there are clear solutions to most big issues facing the country.

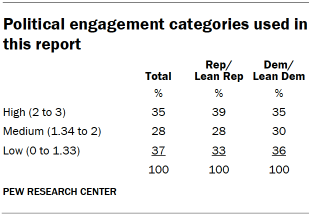
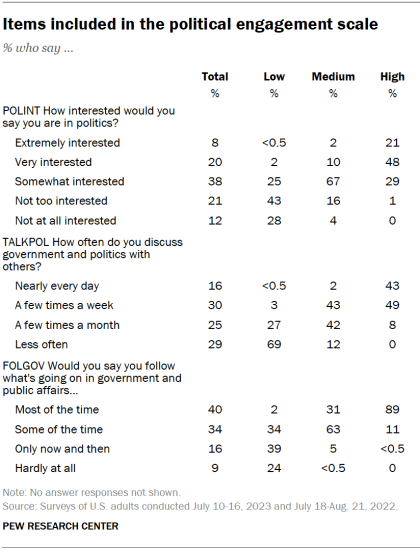
About six-in-ten adults with high levels of political engagement (61%) say there are clear solutions to big issues today, compared with half of those with medium levels of engagement and 41% of those with lower engagement.

2. Views of the U.S. political system, the federal government and federal-state relations

In evaluating the current and future state of politics in the United States, Americans express largely negative views. And trust in the federal government, which has been low for nearly two decades, hovers near record lows.

Only 4% of Americans now say the political system is working extremely or very well, with nearly three-quarters saying it isn’t. A majority (63%) say they have little or no confidence in the future of the U.S. political system.

Views of Congress, the Supreme Court and the political parties also remain deeply – and in some cases, historically – negative.

Meanwhile, there are wide partisan differences in views of several aspects of federal-state relations. Democrats are far more likely than Republicans to say they are very or extremely concerned that a person’s rights and protections might vary depending on which state they are in.

By contrast, a much larger share of Republicans than Democrats express concern that the federal government is doing too much on issues better left to state governments.

Evaluations of the political system

Only 4% of the public says the political system in the U.S. is working extremely or very well today, while 23% say it is working somewhat well. About seven-in-ten (72%) say the system is working not too (45%) or not at all (27%) well.

Looking to the future of the system, about six-in-ten Americans (63%) say they have not too much or no confidence at all. A third say they have some confidence, and just 4% express a lot of confidence.

Chart shows few Americans say the U.S. political system is working very well today, and many lack confidence in its future

Age

Younger adults are somewhat more likely than older adults to say the political system is working well: 35% of adults under age 30 say the system is working at least somewhat well, compared with 29% of those 30 to 49 and 24% of those 50 and older.

But older people are more likely to express confidence when it comes to the future of the U.S. political system. About four-in-ten adults 65 and older (43%) say they have at least some confidence in the future of the political system. That drops to three-in-ten among adults under 30.

Party

Republicans are more likely than Democrats to express negative views of the political system.

Roughly eight-in-ten Republicans and Republican-leaning independents (81%) say the political system is working not too or not at all well, including more than a third (37%) who say it is working not at all well. Among Democrats and Democratic leaners, 64% say the political system is working either not too or not at all well, with 19% saying it is not working well at all.

Older Republicans are particularly likely to say the system is not working well: 88% of Republicans 50 and older say this, compared with 77% of those 30 to 49 and 61% of those under 30. Democrats do not differ by age on this question.

Republicans also express less confidence in the future of the U.S. political system: 68% of Republicans and 56% of Democrats say they have not too much or no confidence at all in its future. While Republicans of all age groups are about equally likely to have confidence in the political system’s future (31% have a lot of or some confidence), older Democrats are more likely to say this than younger Democrats. A majority of Democrats 50 and older (54%) say they have at least some confidence, compared with 37% of those under 50.

Trust in the federal government

Chart shows public trust in the federal government near record low

Just 16% of Americans say they trust the government in Washington to do the right thing just about always or most of the time. While public trust in government has been low for nearly two decades, the current measure is among the lowest in more than 70 years of polling.

Trust in the federal government is down 4 percentage points from last year and was somewhat higher in 2020 and 2021. The current measure is on par with public views in 2019.

For more on trust in the federal government over the last 70 years, please visit our trust interactive.

Trust in government by party

As in the past, trust in government is higher among those whose party holds the presidency. Today, a quarter of Democrats say they trust the government to do what is right at least most of the time, compared with just 8% of Republicans.

Democrats’ trust in government is now substantially higher than it was during the Trump administration but is down 8 points from the spring of 2021. In contrast, Republicans’ trust in government dropped between 2020 and 2021 but has changed little over the last few years.

Chart shows partisan trust in government shifts with control of the White House but remains lower in both parties than it was last century

Republicans’ current level of trust in the federal government is among the lowest since the question was first asked in the 1950s. Prior to Joe Biden’s presidency, GOP trust in government had only hit similar lows during the Obama administration.

Feelings toward the federal government

Chart shows Americans continue to express frustration, more than anger or contentment, with the federal government

As has been the case for more than a decade, a majority of Americans (59%) say they feel frustrated toward the federal government. About two-in-ten (21%) say they feel angry toward the government, while 18% say they are basically content.

These views have changed only modestly in recent years. A slightly higher share express anger today than did so last year and the year before. Anger is now slightly lower than it was in the summer of 2020.

Feelings about the federal government by party

The share of Democrats and Democratic leaners saying they are basically content with the government is similar to the share who said the same a year ago (27% today, 29% then). In 2021, Democrats were 16 percentage points more likely to say they felt content toward the government. Nearly two-thirds of Democrats (64%) express frustration toward the government, a share unchanged in the last year but 12 points higher than in 2021. The share of Democrats who say they are angry remains low – 9% say this today – but is up 5 points since 2021.

About a third of Republicans and Republican leaners (35%) say they feel angry toward the federal government, while 55% say they feel frustrated and just 9% say they feel content. These figures are largely unchanged in recent years.

Chart shows anger and contentment with the federal government shift with presidential administrations

The relationship between the federal and state governments

Majority of Americans concerned rights and protections may be different in different states

Chart shows growing numbers, especially among Democrats, are concerned rights may vary from state to state

A majority of Americans (54%) now say they are extremely or very concerned that the rights and protections a person has might be different depending on which state they are in. About three-in-ten (29%) say they are somewhat concerned about this, while 16% are not too or not at all concerned.

The share reporting they are extremely or very concerned about this has risen 11 points since May of 2022.

Democrats are particularly likely to express concern that rights and protections may vary across states. Seven-in-ten Democrats now say they are extremely or very concerned about this, up from 53% a year ago.

Among Republicans, the share who say they are at least very concerned is up 6 points, from 33% to 39%.

Some concerned the federal government is doing too much that should be left to states

Chart shows about 6 in 10 Republicans are at least very concerned about the federal government doing too much

The share expressing concern about the federal government doing too much on issues better left to state governments has also risen over the past year: 41% now say they are extremely or very concerned about this, compared with 34% in May 2022.

Republicans express higher levels of concern than Democrats that the federal government is doing too much. Roughly six-in-ten Republicans (62%) are extremely or very concerned about this, compared with 22% of Democrats.

The share of Republicans who are at least very concerned is up 8 points in the past year, while the share of Democrats who say this has increased by 4 points.

Some concerned states are not willing enough to work with the federal government

Chart shows roughly 4 in 10 Americans are concerned about states being unwilling to work with the federal government

Overall, 41% of U.S. adults say they are extremely or very concerned about state governments not being willing enough to work with the federal government, up from 34% last year. Roughly a third (36%) say they are somewhat concerned about this, while 22% say they are not too or not at all concerned.

Democrats are more likely than Republicans to say they are concerned about state governments not being willing enough to work with the federal government: A majority of Democrats (54%) are extremely or very concerned about this. Just 27% of Republicans share that concern.

The share in each party who say they are at least very concerned about state governments’ unwillingness to work with the federal government has increased since 2022, by 9 points among Republicans and 6 points among Democrats.

3. How Americans view Congress, the president, state and local political leaders

While trust in the federal government hovers near a historic low, public views of Congress, the Supreme Court and the president also are quite negative.

However, people’s ratings of the job performance of their own congressional representative – in contrast with views of Congress as a whole – are more positive than negative. Their assessments of their state’s governor also are positive, on balance. Yet both Democrats and Republicans are far more positive about both their governor and their member of Congress when that person shares their partisanship.

By more than two-to-one (56% to 26%), Americans say their local elected officials are doing a good job.

Views of the branches of the federal government

Congress

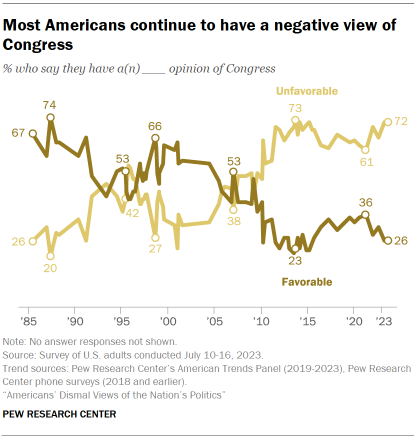
Chart shows most Americans continue to have a negative view of Congress

About seven-in-ten Americans (72%) say they have an unfavorable view of Congress, with 26% saying they have a favorable view.

While public views of Congress have been more negative than positive for over a decade, the share of Americans giving Congress an unfavorable rating is now among the highest in nearly four decades of polling.

Throughout much of the 1980s, ’90s and early 2000s, Congress was viewed more favorably than unfavorably. Views were more evenly split in the late 2000s and began to shift in a negative direction over the next several years.

Views of Congress by party
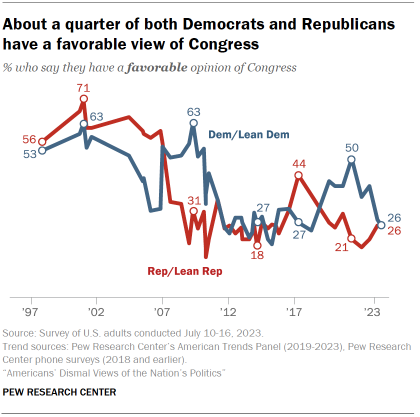
Chart shows about a quarter of both Democrats and Republicans have a favorable view of Congress

There is no partisan gap in ratings of Congress today, with 26% of both Republicans and Democrats expressing a favorable view of Congress.

Partisans’ ratings of Congress often shift as control of the two chambers shifts. For instance, Democratic favorability of Congress was higher in 2021 and 2022, when the party held control of both the House and Senate.

Conversely, Republican favorability of Congress is now slightly higher than it was in 2022, prior to the GOP taking control of the House. But it remains lower than it was in 2017 and 2018 (when Republicans last held control of both chambers).

House and Senate rated similarly by the public, but partisan gaps reflect chamber control

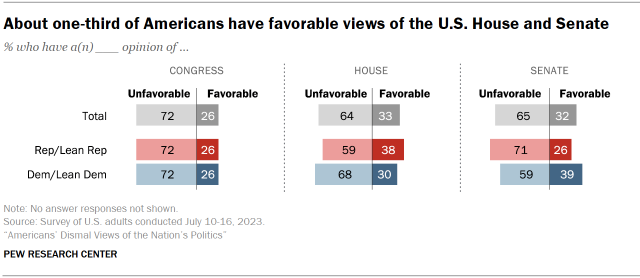
The House of Representatives and the Senate are both viewed somewhat more positively than “Congress”: About a third of Americans view each chamber positively, while 26% say the same of Congress.

This reflects that both Republicans and Democrats feel somewhat more positive about the chamber their party controls than about “Congress.”

For example, while the share of Republicans expressing a positive view of the Senate is identical to the 26% who say this about Congress, 38% of Republicans say they have a favorable view of the House.

Democrats rate both chambers more positively than “Congress.” Still, the pattern is similar, with the Democratic-controlled Senate viewed more positively than the GOP-controlled House (39% vs. 30%).

Chart shows about one-third of Americans have favorable views of the U.S. House and Senate

Supreme Court

Views of the Supreme Court are at their most negative point in more than three decades, with 54% of Americans now saying they have an unfavorable view of the court. The court’s favorable rating has declined 26 percentage points since 2020, primarily driven by a decline in the share of Democrats and Democratic leaners rating the court favorably.

Views of the president

President Joe Biden’s approval rating has hovered below 40% for the last few years, and ratings for his immediate predecessor – Donald Trump – were similarly more negative than positive. Presidents in prior decades tended to have higher approval ratings.

This is, in part, reflective of the rising partisan divide in presidential job approval, which has grown steadily in the past few decades – mostly a result of people in the “out party” becoming less likely to approve of the president.

Through 2022, an average of 82% of Democrats approved of how Biden had handled his job as president, while just 7% of Republicans did. These views are about the reverse of Trump’s approval over his time in office. In contrast, during George W. Bush’s presidency, an average of 23% of Democrats approved of his job performance, and during Bill Clinton’s presidency an average of 27% of Republicans approved of Clinton.

Americans’ ratings of their House member, governor and local officials

Chart shows Americans have more positive views of local elected officials compared with their governor, House member

Overall, Americans rate the performance of their own elected officials more positively than negatively.

A 56% majority of U.S. adults say their local elected officials are doing a good job, while fewer than half as many (26%) say they are doing a bad job. About two-in-ten (19%) say they are not sure.

Roughly half of the public (51%) says their state’s governor is doing a good job, while 37% say the governor is going a bad job. Around one-in-ten (12%) say they aren’t sure about their governor’s job performance.

Americans are less likely to offer an opinion of the member of Congress who represents their district, with about a third (32%) declining to do so. But ratings of these officials also are more positive (41% good job) than negative (27% bad job).

Ratings of House member, by party

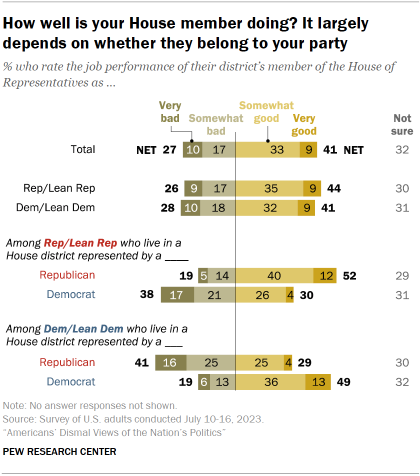
Chart shows how well is your House member doing? It largely depends on whether they belong to your party

Just as Americans are more approving of the president when they share the president’s party, they are also more likely to say their other elected leaders are doing a good job when they are of the same party. This pattern is evident in Americans’ views of members of the House of Representatives and is even more pronounced in views of governors.

Overall, similar shares of Republicans (44%) and Democrats (41%) say their district’s House member is doing a good job.

However, Republicans in House districts represented by a Republican are far more likely to approve of the job performance of their representatives (52% good job) than are Republicans who live in places with Democratic House members (30% good job).

Similarly, about half of Democrats who live in a district represented by a Democrat (49%) say their House member is doing a good job, while just 29% of Democrats who are represented by a Republican say the same.

Ratings of governors, by party

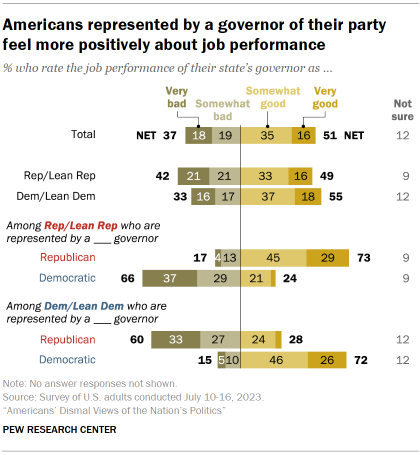
Chart shows Americans represented by a governor of their party feel more positively about job performance

The partisan gap in views of state governors is even wider. Nearly three-quarters of both Democrats and Republicans who are represented by a governor who shares their partisanship say that governor does a good job. By comparison, six-in-ten Democrats and 66% of Republicans who live in states headed up by a governor of the opposing party say their governor does a bad job.

About half of all Republicans and Republican leaners (49%) and 55% of all Democrats and Democratic leaners say their state’s governor is doing a good job. 

However, 73% of Republicans who are represented by a Republican governor say their governor does a good job. In contrast, 24% of Republicans living in states with a Democratic governor say the same.

Similarly, Democrats in states with a Democratic governor are far more positive about the job performance of their state’s governor (72% good job) than Democrats in states with a Republican governor (28%). 

4. The Republican and Democratic parties

The U.S. public’s views of both the Republican and Democratic parties are more unfavorable than favorable, with a record number of Americans (28%) now expressing unfavorable views of both parties.

Yet most Republicans and Democrats characterize their own party in positive terms, saying that it respects democracy and governs honestly and ethically. And most say their own party generally has good ideas.

Party favorability ratings

About six-in-ten Americans (61%) say they have an unfavorable view of the Republican Party, and a nearly identical share (60%) rate the Democratic Party unfavorably.

For close to two decades, views of the Republican Party have been consistently more unfavorable than favorable, with little shift in the last few years. But current evaluations are among the most negative in nearly three decades of Pew Research Center polling – and throughout the mid-1990s and early 2000s, the GOP was seen more favorably than not by the public.

Chart shows Americans’ views of both major parties remain more unfavorable than favorable

The negative turn in evaluations of the Democratic Party is more recent than for the Republican Party, with public views more mixed for much of the last decade and a half – and in positive territory for most of the mid-1990s through 2000s. In recent years, views of the Democratic Party have been more unfavorable than favorable and are now at their most negative point in the last three decades.

For 28% of Americans, both major parties get negative marks

Chart shows around 3 in 10 Americans now have unfavorable views of both parties

Nearly a third of Americans (28%) report holding negative views of both the Republican and Democratic parties. This is little changed since last year, but it is up considerably from a few years ago and is higher than at any other point in our nearly 30 years of polling.

Adults under 50 and political independents are more likely than others to have unfavorable views of both parties

About a third of adults ages 18 to 49 (35%) have unfavorable views of both of the major parties. This drops in older age groups: 24% of those 50 to 64 and an even smaller share (16%) of those 65 and older hold this combination of negative views.

Chart shows younger adults are more likely than older Americans to have unfavorable views of both parties

Nearly half of those who identify as politically independent or with something other than the Democratic or Republican Party (46%) view both parties negatively. Within this group, similar shares of those who lean Democratic (43%) and those who lean Republican (45%) rate both parties unfavorably. (Republican leaners who rate only one party positively overwhelmingly tilt to the GOP, while the reverse is true among Democratic leaners.)

Those who consider themselves Democrats or Republicans are much less likely to rate both parties negatively, with about eight-in-ten partisan identifiers viewing their own party positively. By contrast, independents and others who lean to a party have consistently been less likely to view that party positively.

Most characterize their party positively

Chart shows most say their party – but not the other – respects democratic institutions, governs honestly and respects different types of people

Most Americans characterize the party they identify with or lean toward in positive terms, viewing it as respectful of democracy, governing honestly and tolerant of different kinds of people. Far fewer say these traits characterize the other party.

Large majorities in both partisan coalitions say “respects the country’s democratic institutions and traditions” describes their party very or somewhat well (79% of Republicans and Republican leaners and 82% of Democrats and Democratic leaners say this).

Majorities also say their party is “respectful and tolerant of different types of people,” though Democrats (83%) are more likely than Republicans (72%) to say this characteristic applies to their own party.

About seven-in-ten in both parties say their party “governs in an honest and ethical way” (71% of Democrats, 68% of Republicans).

Sizable minorities see flaws in their party: 48% of Republicans and 35% of Democrats say their party “too often makes excuses for members with hateful views,” and about four-in-ten in both coalitions say their party “supports policies that interfere too much in people’s lives (41% of Republicans, 40% of Democrats). Still, even larger shares (at least two-thirds) say these negative attributes describe the other party.

Quality of the parties’ ideas

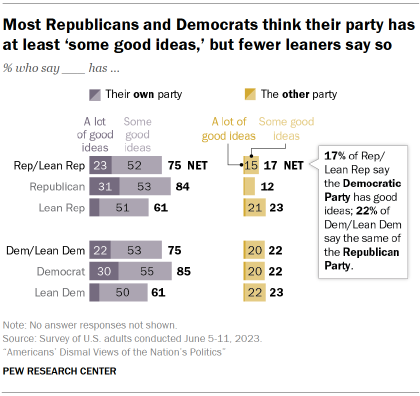
Chart shows Most Republicans and Democrats think their party has at least ‘some good ideas,’ but fewer leaners say so

Clear majorities of Republicans and Democrats say their parties have at least some good ideas, while fewer than a quarter say the other party has some good ideas.

Within each partisan coalition, independents who lean toward the party are much less likely than those who identify with the party to say it has good ideas. About six-in-ten leaners in each party say the party has at least some good ideas, compared with more than eight-in-ten Republican and Democratic identifiers who say this.

Overall, most Americans (74%) say at least one of the two parties has some or a lot of good ideas, while 25% say that neither party does. Independents and others who don’t identify with the major parties are particularly likely to say that neither party has good ideas: 39% say this, including similar shares of Republican-leaning independents (35%) and Democratic-leaning independents (36%). In contrast, just 15% of Republican and 12% of Democratic identifiers say neither party has good ideas.

5. Money, power and the influence of ordinary people in American politics

Americans have long believed that major political donors and special interests have too much influence on politics and that ordinary people have too little influence. Most see voting as the best way for average Americans to impact the direction of the country.

But the belief that there is too much money in politics is widespread. References to the influence of money and concerns about corruption are some of the most frequently cited critiques of the political system, and many Americans see monetary gain as a reason why most elected officials seek office to begin with.

This chapter details that an overwhelming share of Americans hold the view that the amount of money individuals and organizations can spend on political campaigns should be limited – and a majority say they think it legally could be.

Influence in congressional decision-making

Chart shows campaign donors, lobbyists widely viewed as having too much influence on members of Congress; most say ‘people in their districts’ have too little influence

When it comes to the decisions made by members of Congress, large shares of Americans say major donors, lobbyists and special interests have too much influence.

By contrast, just 9% of adults say the people in lawmakers’ districts have too much influence; that compares with 70% who say the people in their districts have too little influence (19% say they have about the right amount).

Americans’ views on which groups have influence on the decisions made by members of Congress are similar across party lines:

Chart shows Democrats and Republicans alike say major donors, lobbyists have too much influence on Congress
  • Around eight-in-ten Republicans and Republican-leaning independents (83%) say people who donate a lot of money to campaigns have too much influence on decisions made by members of Congress. A nearly identical share of Democrats and Democratic leaners (80%) say the same.
  • Majorities in both parties also say lobbyists, special interests and large employers in lawmakers’ districts have too much influence.
  • Relatively small shares in both parties say people in lawmakers’ districts have too much influence. Nearly identical majorities of Republicans (72%) and Democrats (71%) say they have too little influence.

Views on limiting the role of money in politics

Chart shows most favor limits on spending in elections, say it
would be possible to reduce role of money in politics

By a wide margin, the public supports limiting the amount of money spent on political campaigns: 72% say there should be limits on spending by individuals and organizations, while just 11% say they should be able to spend as much as they want.

Comparable majorities in both parties (76% of Democrats, 71% of Republicans) say there should be campaign spending limits.

Nearly six-in-ten Americans (58%) say it is possible to have laws that would effectively reduce the role of money in politics, while 21% say it is not; 20% are not sure.

Democrats are more likely than Republicans to say it is possible to have laws that reduce the influence of money on politics. About two-thirds of Democrats say this is possible (66%), while only 16% say it is not. Roughly half of Republicans (52%) think this is possible, while 29% say it is not.

Views on what kinds of activities can change the country for the better

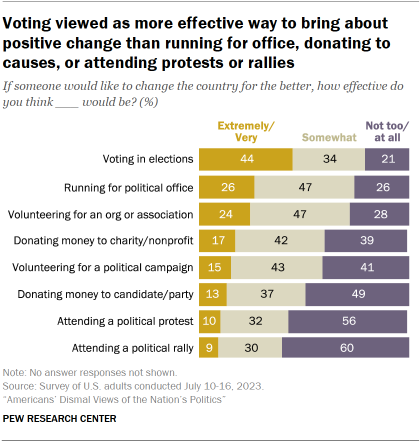
Chart shows Voting viewed as more effective way to bring about positive change than running for office, donating to causes, or attending protests or rallies

Presented with a number of ways that someone might try to change the country for the better, Americans rate voting in elections as the most effective of these.

Just over four-in-ten U.S. adults (44%) say that voting is an extremely or very effective way to change the country for the better, while 34% say it is somewhat effective and 21% say it is not too or not at all effective.

About a quarter describe both running for political office (26%) and volunteering for an organization or association (24%) as at least very effective.

Chart shows Democrats are more likely than Republicans to say voting can produce positive change

Fewer adults say this about other items included in the survey: donating money to a charity or nonprofit (17% say this is extremely or very effective), volunteering for a political campaign (15%), donating money to a political candidate or party (13%), and attending a political protest (10%) or rally (9%).

A majority of adults say that attending a political rally (60%) is not too or not at all effective as a way to change the country for the better. Nearly as many (56%) say the same about attending a political protest.

Republicans’ and Democrats’ views on the effectiveness of each of these items are similar, though slightly larger shares of Democrats than Republicans rate several as extremely or very effective.

Democrats are more likely than Republicans to view voting in elections (50% of Democrats, 39% of Republicans) and volunteering for an organization or association (30% vs. 19%) as extremely or very effective.

How much can voting affect the future direction of the country?

Overall, a 57% majority of Americans say that voting by people like them can affect the future direction of the country a lot (20%) or some (36%).

Chart shows older Americans are more likely to say voting can affect the country’s future

Roughly three-in-ten (31%) say that voting by people like them has “not much” of an effect, and 11% say it has no effect at all.

About half of adults under age 50 (52%) say voting can have at least some effect on the country’s future direction, compared with a majority (61%) of those 50 and older.

And while Democrats are more likely than Republicans to say voting has at least some effect overall, those who identify as the strongest partisans within each party view voting as most effective.

Six-in-ten strong Republicans say that voting can have at least some effect; 53% of those who identify with the Republican Party, but not strongly and 40% of Republican leaners say the same. Among Democrats, 73% of strong Democrats say this, compared with 62% of not strong Democrats and 59% of Democratic leaners.

Age differences on the impact of voting are evident in both partisan coalitions. In both parties, those ages 50 and older are more likely than younger adults to say voting can have at least some effect on the country’s future direction. 

Chart shows in both parties, young adults are less likely than older people to say voting can affect the country’s future

Among Republicans and Republican leaners, 60% of those 65 and older say voting can have at least some effect on the country’s future direction, compared with roughly half of those ages 50 to 64 (52%) and 30 to 49 (47%). Among Republicans under age 30, 44% say voting can have a lot or some effect on the country’s direction.

Age differences are similar among Democrats and Democratic leaners. Democrats 65 and older are 18 percentage points more likely than those under 30 to say voting can have at least some effect on the country’s direction. 

6. Evaluations of members of Congress and the biggest problem with elected officials today

Americans express highly negative views of elected officials – and have grown increasingly pessimistic about their congressional representatives over the past several years. In fact, views of Congress, congressional leadership, the current and former president, and the vice president are all underwater.

When asked about various aspects of the job those in Congress are doing, such as working with members of the opposing parties or caring about the people they represent, Americans are critical on nearly every domain.

Views of members of Congress

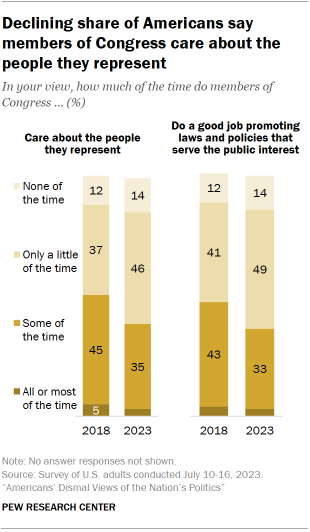
Chart shows declining share of Americans say members of Congress care about the people they represent

Opinions about Congress are largely negative; just 26% of U.S. adults have a favorable view of Congress, while 72% have an unfavorable view.

Serving the public interest and people in their districts

The public also is critical of how members of Congress do their jobs – and in some cases these criticisms have increased in recent years:

  • In 2018, half of adults said members of Congress care about the people they represent all, most or some of the time. Today, 38% say the same. A majority say that members of Congress care about their constituents “only a little” or none of the time.
  • There has been a similar decline in the share of adults who say members of Congress do a good job promoting laws and policies that serve the public interest. Five years ago, 47% said congressional members do this at least some of the time. Today, just 36% say that members of Congress promote the public interest.
Chart shows declines in positive views of members of Congress cross party lines

On both evaluations, positive views have declined among Republicans and Democrats alike. About four-in-ten members of both parties say members of Congress care about the people they represent all or most of time. Roughly half said this in 2018.

There have been similar declines in the shares of Republicans and Democrats who say the members do a good job promoting policies that serve the public interest. 

Across many dimensions, public rates members of Congress poorly

Chart shows public is widely critical of how members of Congress
do their jobs

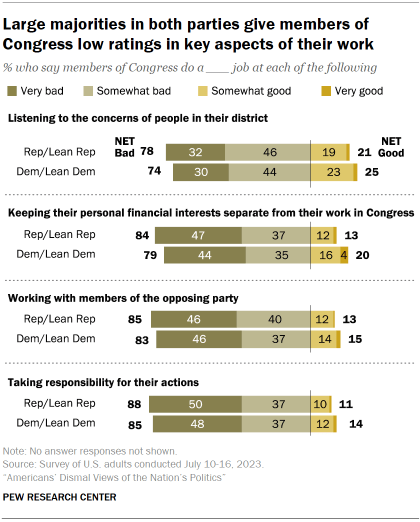
At least three-quarters or more say that members of Congress do a somewhat or very bad job at listening to the concerns of people in their district (76%), keeping their personal financial interests separate from their work in Congress (81%), working with members of the opposing party (84%) and taking responsibility for their actions (86%).

The public is especially negative when it comes to whether members of Congress take responsibility for their actions. Nearly nine-in-ten say congressional members do a bad job taking responsibility – including about half (49%) who say they do a very bad job at this.

Chart shows large majorities in both parties give members of Congress low ratings in key aspects of their work

Views across these items are deeply negative among nearly all demographic groups – including by gender, age, race and education.

Assessments of members of Congress differ little by party. Majorities of Republicans and Democrats alike – including those who lean to each party – say that members of Congress do a poor job keeping their personal financial interests separate from their work in Congress (84% of Republicans, 79% of Democrats) or listening to the concerns of people in their district (78% of Republicans, 74% of Democrats).

Similarly, at least eight-in-ten Republicans and Democrats say that members of Congress do a bad job taking responsibility for their actions or working with members of the opposing party.

Age and views of elected officials

For the most part, views of congressional job performance are broadly negative across demographic groups. Yet adults ages 65 and older offer more positive evaluations in some specific areas.

Chart shows Americans 65 and older more likely to view members
of Congress as caring and supportive of good policies

Nearly half of those 65 and older (48%) say members of Congress care about the people they represent at least some of the time. Far fewer adults under 65 say the same – including just a third of those under 30.

While 45% of Americans 65 and older say members of Congress do a good job promoting policies and laws that serve the public interest, this compares with 36% of those ages 50 to 64, 35% of those 30 to 49 and just 31% of adults under 30.

Older adults were slightly more positive on these assessments of Congress than their younger counterparts, but age differences are either small or nonexistent when it comes to the other items asked about on the survey.

In their own words: Americans’ views of the major problems with today’s elected officials

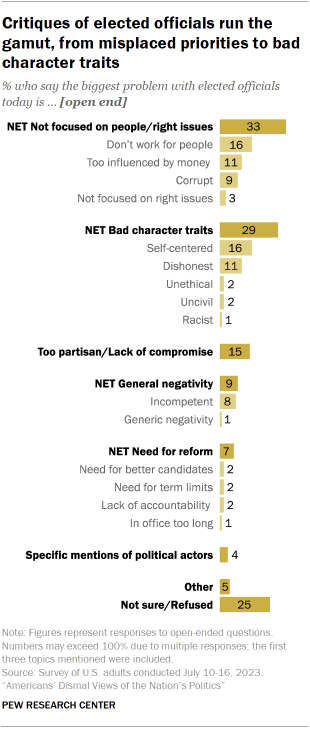
Chart shows critiques of elected officials run the gamut, from misplaced priorities to bad character traits

When asked in an open-ended question about the biggest problem with elected officials today, adults point to a variety of issues – ranging from a lack of focus on the people they represent to mentions of negative character traits, general incompetence and the role of partisanship in officials’ ability to get things done.

One recurring theme is a sense that elected officials today are not in touch with the people they represent or do not advocate for the issues that matter to their constituents.

A third of adults express this view, including 11% who feel elected officials are too influenced by money and 9% who say they are corrupt. “Their end goals are personal and not for the betterment of the voters who elected them,” says a man in his 60s.

Another man in his 20s believes elected officials are “too out of touch with the public. They’re too obsessed with money and power, so they don’t care about the people anymore.”

Roughly three-in-ten adults mention negative personal traits of elected officials, saying that elected officials are dishonest or self-centered. One woman in her 60s says they have “no empathy, and are unable to see both sides of the picture … [they’re] not truthful.”

Explore more voices: Americans’ views of their elected officials

What do you see as the biggest problem with elected officials today? 

“They bend to whomever can donate most to their campaign and don’t follow through on campaign promises.” –Man, 30s 

“Lack of awareness and understanding of today’s political and social landscape. Old politicians with old money don’t understand the issues of today, leading to a huge disconnect with the public’s priorities and theirs.” –Woman, 20s 

“Greed. Greed. Greed. Power leads to greed.” –Woman, 70s 

“No accountability and they all think they are rockstars.” –Man, 30s 

“They are focused on donor money and preventing the ‘other side’ from making advancements instead of governing in a way that helps all constituents.” –Woman, 40s 

“Too much ego and not caring enough to listen to us.” –Woman, 50s 

“Power hungry. Money hungry. Lazy. Liars.” –Man, 40s 

“Many are self-serving, misdirected and too partisan. They have lost common sense, love of country, and have no moral core.” –Woman, 70s 

“They do not serve the people, they serve themselves and special interests, and lie to our faces about their priorities.” –Man, 40s 

The influence of partisanship is another theme mentioned by 15% of adults. Most Americans who cite issues along this theme point to the inability of elected officials to get things done due to polarization or loyalty to one’s party.

The biggest problem with today’s elected officials, according to one woman in her 50s, is “the idea that what we want is for them to fight for whatever they believe in at all costs, rather than compromise and actually accomplish something. I can’t think of another profession where you can get paid for refusing to do anything.”

“They are not willing to speak to anyone across the aisle,” says another man in his 40s. “It is their party or nothing.”

Many of these themes were echoed in a survey conducted in 2015 – reflecting a persistent skepticism among members of the public that elected officials do not hold office for the betterment of the people they represent, but for the benefit of themselves. Eight years ago, sizable shares of adults said that elected officials were out of touch with people or too influenced by money and special interests.

How much do elected officials care about people like me?

Chart shows overwhelming majority of Americans say most elected officials don’t care what ‘people like them’ think

Among U.S. adults overall, 85% say elected officials do not care what people like them think. Just 14% say they do care.

In the early 1990s, about a third of adults said elected officials cared about people like them – a share that declined steadily into the 2010s.

Skepticism that most elected officials care about the public is evident among Americans regardless of gender, race, age, education, partisanship or political engagement. For example, 84% of those who are highly engaged with politics say that elected officials don’t care what people like them think. This compares with 87% of those who are less engaged with politics.

7. Candidate quality and what drives elected officials to run for office

Americans’ negative feelings about politics today and elected officials extend to their views about the quality of the people who run for office and the reasons why they do. For the most part, these feelings don’t differ much across party lines – although dissatisfaction with the choices Americans have in elections is even more widespread among people who don’t identify with either party.

What motivates people to run for office?

Self-interest – whether in the form of making a lot of money, potentially running for a higher-level office later, or gaining fame and attention – is widely seen as the motivating force for all or most elected officials. In contrast, just 15% of Americans think all or most elected officials ran because they wanted to serve the public.

Chart shows over half of Americans say that all or most elected officials ran for office to make a lot of money

Today, 63% say that all or most elected officials in local, state and federal government ran because they wanted to make a lot of money, while about three-in-ten (29%) say some elected officials ran for this reason. Just 8% of Americans say a desire to make a lot of money motivated few or no elected officials. 

Majorities also say all or most officials ran with the intention to run for higher-level office in the future (57%) and to get fame and attention for themselves (54%). No more than one-in-ten say that few or no officials ran for these reasons.

By comparison, 22% say all or most elected officials ran because they wanted to address issues they care about, while about half (48%) say that some elected officials ran for this reason (30% say few or none did).

Just 15% say all or most elected officials ran because they wanted to serve the public, with 43% saying that few or none ran for this reason.

Majorities of both Republicans and Democrats think most politicians run for reasons of self-interest, not public interest

Chart shows Democrats and Republicans both skeptical that all or most elected officials ran for office to serve the public

Majorities in both parties say that all or most people currently in office ran because they wanted to make a lot of money, although Republicans and Republican-leaning independents (68%) are more likely to say this than Democrats and Democratic leaners (56%).

Similarly, a narrow majority of Democrats (55%) say all or most elected officials ran because they wanted to run for a higher-level office in the future, and about half (51%) say they ran to get fame and attention for themselves. About six-in-ten Republicans (59% each) say these things motivate all or most elected officials.

In contrast, far smaller shares of both Republicans (22%) and Democrats (23%) say most or all elected officials ran to address issues they care about, and even fewer think serving the public was a motivator for most elected officials (13% for Republicans, 16% for Democrats).

Quality of recent political candidates

Chart shows in both parties, evaluations of candidate quality have grown more negative

The public expresses generally negative views about the quality of candidates running for political office in the last several years. About a quarter (26%) say the quality of candidates running for office in recent years has been good, while 72% say it has been bad.

Americans’ evaluations of the quality of candidates running for political office have become more negative over the last few years. The share rating the quality of candidates as good is down 8 percentage points since July 2021 and down 21 points from February 2018.

Partisan views about the quality of candidates

Today, similar shares of Republicans and Democrats (27% each) say the quality of candidates has been good in the last several years.

Chart shows Widespread views that the quality of candidates running for office in recent years has been bad

Between 2018 and 2021, Republicans’ views on this measure shifted more negative (from 53% good to 29% good) but are little changed since then.

Democrats’ views shifted little between 2018 and 2021, but are down from 39% in 2021 saying candidate quality has been good to 27% today.

Majorities across the political spectrum now say candidate quality in the last several years has been bad, with no difference in these views by party. However, those who identify as independents but lean toward a party are more negative than people who identify as partisans.

While 79% of Republican leaners say candidate quality has been bad recently, a smaller majority of Republican identifiers (69%) say this. The pattern is nearly identical among Democrats and Democratic leaners.

Views about the quality of political candidates these days vary modestly by age, race and ethnicity

Overall, White Americans are more likely (77%) than Black (62%), Hispanic (65%) or Asian (65%) Americans to say candidate quality has been bad in recent elections.

And those who are 65 and older offer somewhat more positive evaluations of recent candidates (32% rate the quality as good) than those under 65 (25% say this).

Chart shows people who don’t feel well-represented by one of the parties are especially likely to say the quality of recent candidates for office has been bad

Negative evaluations of the quality of candidates running for political office are particularly pronounced among the quarter of Americans who say they don’t feel well-represented by either of the two major parties: About nine-in-ten (89%) say the quality of candidates in recent years has been bad.

Still, the view that recent candidate quality has been bad is fairly widespread even among those who say they are well-represented by one of the two parties, with about seven-in-ten saying this.

The small share of Americans (just 9%) who feel at least somewhat well-represented by both parties are the only group in which a majority – 60% – say candidate quality has been good in recent years.

In elections, is there usually at least one candidate who shares your views?

Chart shows Older Americans more likely than younger adults to say at least one candidate usually shares their views

While Americans’ evaluations of the quality of candidates running for political office in recent years are largely negative, a majority (56%) say they usually feel like there is at least one candidate for office who shares most of their views. Still, 42% say it’s usually the case that none of the candidates represent their views well.

There are substantial age differences on this question. Americans younger than 50 are about equally likely to say at least one candidate usually shares most of their views or that none do (47% vs. 51%). Those 50 and older are more likely to say at least one candidate shares their views (65% vs. 33%).

Partisans – both Republicans and Democrats – are more likely than independents and those who identify with another party to say that they typically have a candidate who shares their views. About seven-in-ten Republican identifiers (71%) and 65% of Democratic identifiers say this. By comparison, 40% of independents and those who identify with another party say this – including 44% of Republican leaners and a similar share (41%) of Democratic leaners.

Chart shows most Americans who don’t feel well-represented by the two major parties say there usually aren’t candidates who share their views

Majorities of those who feel well-represented by one of the two major parties say there is usually at least one candidate who shares most of their views.

Seven-in-ten Americans who feel well-represented by the GOP (but not the Democratic Party) say this, as do 65% of those who feel represented by the Democratic Party only.

About six-in-ten (59%) of those who feel well-represented by both parties say at least one candidate typically shares their views.

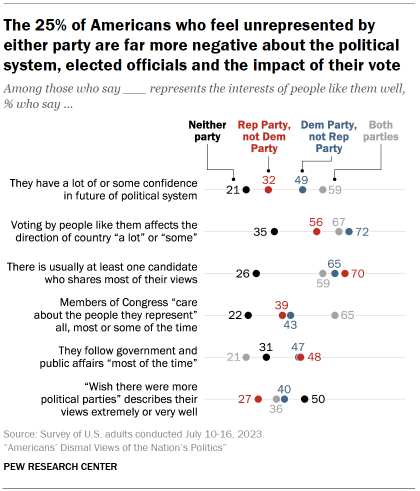
In contrast, just 26% of those who do not feel well-represented by either party say that there is usually at least one candidate who shares most of their views.

What the public sees as most important in political candidates

Chart shows Most Americans say it is important candidates share their views on issues; other factors less important

When asked about important characteristics of political candidates they support, Americans overwhelmingly point to the importance of candidates sharing their views on issues, with other qualities mattering less.

About two-thirds of adults (66%) say it is extremely or very important that political candidates share their views on political issues, while fewer than one-in-ten (8%) say this is not too or not at all important.

Other qualities matter far less: About two-in-ten say it is extremely or very important that candidates have lived in a community like theirs (22%) or share their religious values (18%), while 15% say the same about coming from a similar economic background.

One-in-ten say it is extremely or very important that political candidates share their racial and ethnic background, with just 7% saying the same about sharing their gender.

The importance of these characteristics varies across demographic groups. For instance, a quarter of Black adults say that it is extremely or very important to them that candidates they support share their racial and ethnic background. By comparison, 17% of Hispanic adults, 16% of Asian adults and just 5% of White adults say the same. Still, across demographic groups, shared views on political issues consistently ranks as the most important quality.

8. The presidency and presidential politics

Americans’ dissatisfaction with politics extends to their views of presidential campaigns, both present and past. Only about a third (35%) say they are satisfied with the people who will be running for president next year.

Looking back at recent presidential campaigns, sizable majorities say they were not informative, too long and not focused on the right issues. Nearly eight-in-ten Americans (78%) say recent campaigns did not feature party nominees who were good candidates.

Most Americans say who the president is makes a big difference for such areas as the U.S. standing in the world and the mood of the country. Far fewer say who is president makes a big difference to their personal life.

Large shares of both Republicans and Democrats say the president should focus at least a fair amount on the priorities of people who voted for them. Smaller majorities say they should focus on the interests of people who did not vote for them. Republicans are less likely than Democrats to say the president should focus on the priorities of people who did not vote at all.

Impressions of the people who will be running for president in 2024

Chart shows Americans express little satisfaction with the 2024 presidential field

Most Americans (63%) say they are not too or not at all satisfied when thinking about the people who will be running for president in 2024. In the survey, conducted in mid-July, about a quarter (26%) say they are fairly satisfied. Just 8% are extremely or very satisfied.

While there is widespread dissatisfaction in both party coalitions, Republicans are somewhat more satisfied than Democrats. Among Democrats and Democratic-leaning independents, just 24% are at least fairly satisfied (with only 4% reporting they are extremely or very satisfied). Among Republicans and Republican leaners, about half (48%) are at least fairly satisfied (including 13% who are extremely or very satisfied).

Views about presidential campaigns

Chart shows most say recent presidential campaigns have been too long, focused on wrong issues, had subpar nominees

Americans are critical of recent presidential campaigns in negative ways, with seven-in-ten or more saying they haven’t been informative (71%), have focused on the wrong issues (77%), have lasted too long (72%) and haven’t featured nominees who were good candidates (78%).

Americans are more evenly split over whether campaigns have been interesting or dull, although they are still more negative than positive. About half (52%) say recent presidential campaigns have been dull, while 44% say they have been interesting.

Partisan and engagement differences on recent presidential campaigns

There are relatively modest partisan gaps in views of whether presidential campaigns are interesting, informative, go on too long, focus on the right issues or result in good nominees. But in both partisan coalitions, there are some notable differences between more and less politically engaged people.

Dull or interesting?

People who are less politically engaged are considerably more likely to say recent political campaigns have been dull, rather than interesting. And this holds among both Republicans and Democrats. More than six-in-ten (64%) less politically engaged people say campaigns have been dull, but that falls to about four-in-ten among people who are highly politically engaged.

Chart shows less politically engaged Americans are more likely than highly engaged adults to say campaigns have been dull and less likely to say they have lasted too long
Are too long or not too long?

People with higher levels of political engagement are particularly likely to say presidential elections go on too long. Though majorities of those at all levels of political engagement say this, 80% of high-engagement people hold this view (including 76% of high-engagement Republicans and 85% of high-engagement Democrats), this drops to about six-in-ten (62%) among people with low levels of political engagement.

Have the nominees been good candidates?

Although clear majorities also say recent presidential nominees have not been good candidates, Democrats overall are somewhat more likely than Republicans to say this (82% vs. 73%). The partisan gap is somewhat wider among more engaged Americans: 85% of highly engaged Democrats and 69% of highly engaged Republicans say recent presidential elections have not yielded good candidates.

How much of an impact does who is president have on your life?

Chart shows most Americans say who is president makes a big difference for U.S. standing in the world, mood of the country, national security – but not them personally

Today, 67% of adults say who is president makes a big difference for the United States’ standing in the world, with clear majorities saying the same for the mood of the country (65%) and national security (58%).

Roughly half of Americans (52%) also say who is president makes a big difference for the health of the economy.

By comparison, far fewer Americans say who is president makes a big difference in their personal lives. About a quarter (24%) say this (though half say this makes some difference).

Whose priorities should the president focus on?

Chart shows Americans say a president of either party should focus on the priorities of people who voted for them

Regardless of whether the winner of a close presidential election is a Democrat or Republican, Americans overwhelmingly say the president should focus on the priorities of the people who voted for them. But sizable shares also say the president should focus on the priorities of those who voted for the president’s opponent and the concerns of those who didn’t vote.

About eight-in-ten adults say a president of either party who takes office after a close election should focus at least a fair amount on the priorities of those who voted for them, with nearly identical shares saying this about a Republican president who wins narrowly (82%) and a Democratic president who wins narrowly (83%). Roughly a third say this group should receive a great deal of focus from a president of either party.

Clear majorities of Americans also say a newly elected Republican (70%) or Democratic (73%) president should focus on the priorities of the people who voted for the other candidate. However, the public is less likely to say that the president should focus a great deal on this group’s priorities (22% for a Republican president, 23% for a Democratic president).

Americans are less likely to say a new president should focus on the priorities of the people who didn’t vote. Still, six-in-ten say a president of either party should focus at least a fair amount on this group’s priorities.

Partisan views of presidential winners

Chart shows partisans more likely to say presidents of the same party should focus on the priorities of people who voted for them

Democrats and Republicans alike overwhelmingly say that presidents should focus a great deal or fair amount on the priorities of the people who voted for them following a close election.

Those who identify with or lean to each party are slightly more likely to say this when asked about a presidential winner of their party (86% each). Still, at least eight-in-ten say that a winning president should focus on the priorities of their voters – even when the president they are being asked about is a member of the opposing party.

But when asked about the priorities of people who voted for the losing candidate, both Democrats and Republicans are more likely to think the losing side’s concerns should matter when the losers are in their partisan coalition.

For instance, 80% of Democrats and Democratic leaners say a Republican president should listen at least a fair amount to the people who voted for that president’s Democratic opponent. But a smaller share (69%) of Democrats say a Democratic victor should listen to people who voted for that president’s Republican opponent.

The pattern is nearly the same among Republicans: When asked about a Democratic president, 81% of Republicans say the president should listen to those who voted for the Republican, while 63% say a GOP president should listen to Democratic voters. 

Democrats are more likely than Republicans to say a president should focus on the concerns of people who did not vote – and this is the case when asked about both Democratic and Republican winners. About two-thirds of Democrats, compared with 54% of Republicans, say this in both scenarios.

9. How well the major parties represent Americans, the public’s feelings about more political parties

The Democratic and Republican parties are both viewed unfavorably by majorities of Americans. And while most adults say they feel at least somewhat well-represented by at least one of the two parties, a quarter (25%) say neither party represents the interests of people like them even somewhat well.

Reflecting dissatisfaction with the major parties, even among some loyal partisans, many Americans continue to be open to the possibility of having more political parties. Younger adults and those with loose partisan attachments are particularly likely to express a desire for more parties.

Among all U.S. adults, 37% say “I wish there were more political parties to choose from” describes their views extremely or very well; another 31% say it describes their feelings somewhat well.

Additional parties, however, are not seen as a promising fix for the country’s gridlock. Only about a quarter of Americans (26%) say having more than two major parties would make it easier to solve the country’s problems. A nearly identical share (24%) say it would make this harder.

And just a third think it is likely an independent candidate will win the White House in the next 25 years; 66% view this possibility as very or somewhat unlikely.

How different are the Republican and Democratic parties?

Chart shows younger and less politically engaged Americans are less likely to see big differences between the parties

A narrow majority of Americans (54%) say there is a great deal of difference between what the Republican and Democratic parties stand for. Another 35% say there is a fair amount of difference in their values, while just 10% say there is hardly any difference between the two parties.

The share seeing a great deal of difference between the parties hasn’t changed much in recent years, but Americans remain more likely to see major differences between the parties than they were a few decades ago.

These views continue to vary by age, political engagement and the strength of a person’s ties to a party.

Age

Among adults ages 18 to 29, fewer than half (41%) say there is a great deal of difference in what the parties stand for. Older age groups are more likely to see big differences between the parties, with those 65 and older most likely to say this.

Level of political engagement

Chart shows Strong partisans are most likely to see big differences between the two parties

Two-thirds of the most politically engaged Americans think there is a great deal of difference between the parties. Slightly more than half of those with medium engagement (54%) and 42% of those with low engagement say the same. Political engagement is based on people’s interest in politics, as well as how often they follow government and public affairs and discuss politics.

Strength of partisanship

Nearly three-quarters of strong Republicans (73%) and 72% of strong Democrats say there is a great deal of difference between the parties, compared with smaller shares of those who affiliate with a party, but not strongly, and those who lean to a party.

Views of how well the parties represent people’s interests

Chart shows most partisans feel well-represented by their own party; people who lean toward parties are less likely to say this

Large shares of Americans who identify with the Republican or Democratic Party say they feel well-represented – though relatively few feel very well-represented.

Those who only lean toward a party, by contrast, tend to be more skeptical of how well their party represents them.

  • 71% of all Republicans and Republican-leaning independents say their party represents their interests very or somewhat well. Those who affiliate with the Republican Party are more likely to express this view (82%) than those who lean toward the GOP (55%).
  • There are similar differences between Democrats and Democratic leaners. More than eight-in-ten Democrats (85%) say they feel well-represented, compared with 58% of Democratic-leaning independents.

Most Americans feel represented by at least one of the parties

Chart shows About a quarter of Americans say neither political party represents them well

Among all U.S. adults, roughly a third say they feel well-represented by the Democratic Party, but not the Republican Party; about as many (30%) feel represented by the Republican Party but not the Democratic Party.

A quarter (25%) say neither party represents them well, while 9% feel well-represented by both parties.

About four-in-ten independents and those who identify with other parties (41%) say neither major party represents people like them well. Identical shares of independents who lean toward the GOP and the Democratic Party (38% each) say neither party represents them well.

Demographic differences in people’s views of which party, if any, represents them well

Chart shows 3 in 10 Americans under age 50 say neither major political party represents them well

Americans’ views of how well the Republican and Democratic parties represent the interests of people like them vary across race, ethnicity, age, education and community type. These patterns largely mirror groups’ party identification and voting patterns.

More Republican-oriented demographic groups, such as older people, White adults and rural residents, are more likely to say the Republican Party, rather than Democratic Party, represents them well.

The reverse is true for Democratic-oriented groups, such as Black, Hispanic and Asian adults, as well as people with a postgraduate degree.

While three-in-ten adults under age 50 say neither party represents them well, a smaller share of people 50 and older (20%) say this.

Chart shows Democrats are more likely than Republicans to say they would like to see additional political parties

What if there were more political parties?

Independents and those who identify with other parties are more supportive of the idea of having more parties to choose from.

Nearly half of all independents (47%) say they wish for more parties. However, a larger share of independents who lean toward the Democratic Party say this than among those who lean toward the Republican Party (56% vs. 43%, respectively).

People who identify as Democrats also are more interested than Republican identifiers in having additional parties. Democratic identifiers are 10 percentage points more likely than GOP identifiers to say that wishing for more parties describes their views extremely or very well (35% vs. 25%).

Chart shows In both party coalitions, those under age 50 are more likely than older people to wish for more political parties

Republicans and Democrats (including leaners) ages 18 to 49 are about 20 points more likely than older members of their parties to say they wish there were more political parties to choose from in this country. About half of Democrats under age 50 (51%) say this, as do 42% of their Republican peers. By comparison, 31% of Democrats and 23% of Republicans 50 and older say the same.

Would more parties make solving problems easier or harder?

Despite the interest in having more parties to choose from, only 26% of the public says it would make the country’s problems easier to solve.

Chart shows Only 26% of adults say having more political parties would make solving the nation’s problems easier

A similar share of Americans say having more major parties would make solving problems harder (24%). Another quarter say more parties wouldn’t have an impact on the nation’s ability to solve its problems, while 24% are unsure what impact it would have.

Younger adults are more likely than older Americans to say that more major parties would make it easier to address the country’s problems. About four-in-ten adults ages 18 to 29 say this, compared with 12% of those 65 and older.

Partisan leaners also are more likely than partisans to say that more political parties would make it easier to address the country’s problems. More than four-in-ten Democratic leaners (44%) and about three-in-ten Republican leaners (29%) say it would make solving problems easier. This compares with a quarter of those who identify as Democrats and 15% of Republican identifiers.

How likely is it that an independent candidate will become president?

Chart shows majority of the public says it is unlikely an independent candidate will win the presidency in the next 25 years

Few Americans think a candidate independent of the Republican and Democratic parties will win a presidential election in the next 25 years. About two-thirds of adults (66%) say it is very (36%) or somewhat unlikely (30%) this will happen. 

There are no partisan differences in these expectations, and independents are only slightly more likely than partisan identifiers to say this is likely.

Two-thirds in both partisan coalitions say this is unlikely, as do 62% of independents and those who identify with other parties (including 66% of Republican-leaning independents and 64% of Democratic-leaning independents).

Americans who feel unrepresented by the parties have highly negative views of the political system

Chart shows the 25% of Americans who feel unrepresented by either party are far more negative about the political system, elected officials and the impact of their vote

Compared with those who say they feel represented by the Republican or Democratic parties, the quarter of Americans who say neither party represents them well stand out for their negative views of much of the U.S. political system.

  • Those who feel unrepresented by the parties are less optimistic about the future of the political system. Just 21% of Americans who feel unrepresented by both parties say they have a lot of or some confidence in the future of the system. This compares with 32% of those who feel represented well by the Republican Party, 49% of those who feel represented by the Democratic Party and 59% of those who say both parties represent them well.
  • Adults who feel unrepresented doubt voting “by people like them” can impact the direction of the country. At least half of those who feel represented by the GOP (56%) or the Democrats (72%) say that their votes can affect the direction of the country at least some. By contrast, a far smaller share (35%) of those who feel unrepresented say this.
  • Americans who say they are unrepresented by the parties also say political candidates do not share their views. About a quarter of those who say neither party represents them well (26%) say there is usually at least one candidate who shares their views. But clear majorities of those who feel represented by at least one of the two major parties say there is usually a candidate with their views.
Chart shows Americans who feel unrepresented by the parties have more negative views of Congress, the Supreme Court and many political leaders
  • Negative evaluations of members of Congress are higher among those who feel neither party represents them. About four-in-ten of those who are represented well by one party but not the other (39% of those represented by the GOP and 43% of those represented by the Democrats) say members of Congress care about the people they represent at least some of the time. The share saying this falls to 22% among those who say neither party represents them well.
  • Americans who feel unrepresented by the parties pay less attention to government and public affairs. About three-in-ten Americans who feel unrepresented by a major party (31%) say they follow government most of the time, compared with about half of those who say one of the two parties but not the other represents them well. (The 9% of Americans who feel well-represented by both parties are the least likely to be politically attentive.)
  • The desire for more political parties is higher among those who feel unrepresented by both parties. Half of those unrepresented by the parties say they “wish there were more political parties,” compared with four-in-ten or fewer in the other groups.

The Americans who say neither the Republican Party nor the Democratic Party represent people like them well give consistently lower job ratings to their district’s House representative, state governor and local elected officials:

  • 28% in this group say their U.S. representative is doing a good job. Nearly half of those who feel well-represented by at least one of the two major parties view their representative’s performance positively.
  • 40% who feel unrepresented say their governor does a good job. At least half of those in other groups approve of their governor’s performance.
  • While about six-in-ten of those who feel well-represented by at least one party view their local elected officials’ job performance positively, a far smaller share (41%) of those who don’t feel well-represented say this.

10. How Americans view proposals to change the political system

Reflecting the public’s unhappiness with the U.S. political system, there is broad support for a number of significant structural changes to politics:

Chart shows broad public support for term limits for Congress, age limits for federal elected officials and Supreme Court

Term limits for members of Congress. An overwhelming majority of adults (87%) favor limiting the number of terms that members of Congress are allowed to serve. This includes a majority (56%) who strongly favor this proposal; just 12% are opposed.

Maximum age limits for elected officials in Washington, D.C., and Supreme Court justices. Nearly eight-in-ten adults (79%) favor maximum age limits for elected officials in Washington, while 74% favor a maximum age limit for Supreme Court justices.

Requiring voters to show government-issued identification. By more than three-to-one (76% to 22%), Americans support requiring all voters to show government-issued photo identification in order to vote. These views are little changed from 2021.

A narrower majority (62%) favors automatically registering all eligible citizens to vote.

A proposal to increase the number of justices on the Supreme Court, by contrast, draws slightly more opposition (51%) than support (46%).

Overwhelming majorities in both parties favor term limits for members of Congress

Chart shows Term limits draw bipartisan support; wide partisan gap in views of expanding Supreme Court

Term limits for members of Congress are widely popular with both Republicans and Republican-leaning independents (90%) and Democrats and Democratic leaners (86%).

Establishing age limits for elected officials in Washington, D.C., also draws broad bipartisan support.

There are wider partisan differences in views of putting a maximum age limit for Supreme Court justices. Still, 82% of Democrats and 68% of Republicans support age limits for the justices.

As in past surveys, Republicans and Democrats hold different views of proposals to change how voting works in this country.

Nearly all Republicans support requiring all voters to show government-issued identification (93% favor this), compared with a narrower majority (61%) of Democrats. Meanwhile, Democrats (80%) are much more likely than Republicans (45%) to favor automatically registering all eligible citizens to vote.

Increasing the number of justices on the Supreme Court is supported by about two-thirds of Democrats (66% favor). But only about a quarter of Republicans (27%) favor expanding the size of the court, while more than twice as many (72%) are opposed.

Young adults more likely than older people to support adding Supreme Court justices

Chart shows older and younger adults are equally likely to favor maximum age limits for federal elected officials

There are fairly modest age differences in views of most of these proposals. However, adults under age 50 are more likely than those 50 and older to favor automatically registering all eligible citizens to vote (66% vs. 57%).

And a majority of adults under 30 (58%) favor increasing the number of justices on the Supreme Court. Support for this proposal decreases with age: About a third (35%) of those 65 and older favor this. 

These age differences are more pronounced among Republicans than Democrats. About four-in-ten Republicans ages 18 to 29 (44%) favor expanding the court, but that drops steadily with age; just 13% of Republicans 65 and older support this. In contrast, Democrats in all age groups are nearly equally likely to favor increasing the number of justices on the court.

Views of the Electoral College

Nearly two-thirds of Americans (65%) favor changing the current system for presidential elections so that the candidate who receives the most votes wins, while a third prefer to keep the current system so that the candidate who wins the Electoral College vote wins the election.

Chart shows Majority of Americans favor replacing Electoral College with popular vote for presidential elections

Support for changing the current system has ticked up slightly since last summer.

Democrats remain much more likely to favor a popular vote system for presidential elections than Republicans: 82% of Democrats and Democratic leaners say they would prefer to change the current system, compared with 47% of Republicans and Republican leaners.

Among all political independents and others who don’t identify with a party, about two-thirds (66%) favor changing the current system so the candidate who receives the most votes wins, while 31% prefer to keep the current Electoral College system. However, Democratic-leaning independents are much more supportive of changing the Electoral College system than Republican-leaning independents.

Should the size of the U.S. House of Representatives change?

Chart shows Fewer than a third of Americans favor increasing the number of House members

About three-in-ten adults (29%) say the size of the House of Representatives should be increased beyond its current 435 members, while a narrow majority (53%) say the size of the House should stay the same. Another 15% prefer to decrease the size of the House.

Democrats are more likely than Republicans to say that the number of members in the House should increase, though larger shares in both parties favor keeping the House at its current size.

About a third of Democrats and Democratic leaners (35%) favor increasing the size of the House, compared with 23% of Republicans and Republican leaners.

Republican-leaning independents (30%) are more likely than GOP partisans to favor increasing the size of the House (19%). The views of Democratic-leaning independents on this question are nearly identical to those of Democratic identifiers.

Senate seats and population size

Chart shows roughly two-thirds of Americans oppose changing the Constitution to give larger states more senators

When it comes to the Senate, 66% of adults say that the method of determining representation in the upper chamber should not be changed, and all states should continue to have two senators regardless of population size. Roughly half as many (32%) say that the Constitution should be amended so that states with larger populations have more senators than smaller states.

Eight-in-ten Republicans favor maintaining the Senate’s present structure.

Among Democrats, a narrower majority (54%) favor the current allocation, while 45% say the Constitution should be amended.

The views of independents are similar to the overall public’s views, with 65% preferring to keep the current system as-is. However, Democratic-leaning independents’ views are nearly identical to Democratic partisans’ views, while Republican-leaning independents’ views are nearly identical to Republicans’ views.

Younger adults more supportive of structural changes

Chart shows younger Americans more likely than older people to favor changes in the size of the House and Senate

Younger adults are more likely than older adults to favor a popular vote for president, an expansion of the House of Representatives and a change to the way representation in the Senate is apportioned.

While majorities of adults across age groups support changing the presidential election system so the candidate who wins the popular vote wins the election, this view is more common among those under 50 (69%) than among those ages 50 and older (61%).

Age differences are larger when it comes to changes to the structure of Congress, with support for changes decreasing with age. Adults under 30 are much more likely than those 65 and older to say both that the number of House members should be increased (44% vs. 17%) and that the Constitution should be amended so that more populous states have more senators than smaller states (45% vs. 18%).

11. Americans’ feelings about politics, polarization and the tone of political discourse

In many ways, Americans’ emotions toward politics today are as negative as their evaluations of the country’s political system.

Chart shows asked to describe U.S. politics these days, about 8 in 10 Americans respond with a negative word or phrase

Majorities say they always or often feel exhausted (65%) and angry (55%) when thinking about politics these days, while relatively few report feeling hopeful (10%) or excited (4%) with this much frequency.

Despite the public’s weariness with politics, most Americans still believe voting can make a difference. Nearly six-in-ten (57%) say voting can have at least some effect on the country’s future, though just 20% say it can affect it a lot.

And more people say voting can bring about positive change than say that about volunteering for an organization or political group, donating to charity or a political campaign, or running for office.

Politics in a single word or phrase: An outpouring of negative sentiments

Chart shows ‘Divisive,’ ‘corrupt,’ ‘messy’ among the words used most frequently to describe U.S. politics today

When asked to describe politics in the United States these days in a single word or phrase, an overwhelming majority of Americans (79%) express a negative sentiment. Just 2% offer a positive word or phrase, while 10% say something neutral.

The word “divisive” (and variations such as “dividing”) appears most frequently among the responses, with 8% saying this. An additional 2% use the related term “polarized.” Second-most frequent is “corrupt” (chosen by 6% of respondents), consistent with the views many Americans express elsewhere in the survey that politicians are looking out only for their own interests.

Other common words include those that suggest that politics today just doesn’t work, with “messy,” “chaos,” “broken” and “dysfunctional” each among the top 15 words. And many respondents are even more negative in their views: “terrible,” “disgusting,” “disgrace” and the phrase “dumpster fire” each are cited by at least 1% of survey respondents.

Negative emotions prevail when Americans think about politics

Nearly two-thirds of adults (65%) say they always or often feel exhausted when they think about politics these days. Another 25% sometimes feel exhausted, while 9% rarely or never feel this way.

Chart shows majorities of Americans are always or often exhausted and angry when thinking about politics

A majority (55%) also always or often feels angry when thinking about politics; just 11% say they rarely or never feel this way.

A much smaller share of the public reports frequently feeling positive emotions when thinking about politics: One-in-ten always or often feel hopeful, and just 4% feel excited about this frequently.

A majority of adults (56%) say they rarely or never feel hopeful, and 78% rarely or never feel excited when thinking about politics these days.

The most politically engaged are the most exhausted and angry

Those who have the highest levels of engagement with politics are also the most likely to report exhaustion and anger when they think about politics these days.

Among highly politically engaged adults, 72% report feeling exhausted by politics always or often. The shares who say this decline as political engagement decreases: 68% of adults with a medium level of engagement and 56% of those with a low level of engagement feel exhausted always or often.

Chart shows exhaustion and anger over politics are highest among the most politically engaged adults

A similar pattern holds for anger: 69% of highly engaged adults say they always or often feel angry when thinking about politics, compared with 55% of those with a medium level of engagement and 43% of those with a low level of engagement.

Republicans and Republican-leaning independents are slightly more likely than Democrats and Democratic leaners to say they always or often feel angry when thinking about politics these days. But in both parties highly engaged adults are more likely to feel negative than those who are less engaged.

For example, highly politically engaged Republicans are 24 percentage points more likely than Republicans with a low level of engagement to always or often feel angry about politics (72% vs. 48%). And highly engaged Democrats are 23 points more likely to say this than Democrats with a low level of political engagement (65% vs. 42%).

Americans say the tone of political debate in the country has worsened

Chart shows overwhelming majorities say political debate in the U.S. has become less respectful, fact-based in past few years

The public feels that the tone and nature of political debate has become less respectful and fact-based over the last several years.

An overwhelming 84% majority of adults say political debate has become less respectful over the last several years, while only 4% say it has become more respectful. About one-in-ten (12%) say it hasn’t changed.

Similarly, 78% say political debate has become less fact-based over the last several years, while only 5% say it has become more fact-based. Just 16% say it has not changed much.

Large majorities of adults in all political and demographic groups say that the tone and nature of political debate has become less respectful and fact-based in recent years.

Public evaluations today are nearly identical to views four years ago.

Which political topics get too much – and too little – attention?

Chart shows majorities in both parties say disagreements between Republicans and Democrats get too much attention

Large majorities of Americans say several political topics receive too little attention:

  • 78% say there is too little attention to important issues facing the country;
  • 66% say the same about the policies that local elected officials are working on;
  • 64% say policies that federal officials are working on get too little attention.

By contrast, a majority of Americans (57%) say disagreements between Republicans and Democrats receive too much attention.

With a little more than a year before the 2024 presidential election, 39% say the campaign has gotten too much attention, while nearly as many say it has gotten the right amount of attention. About one-in-five (22%) say next year’s election has received too little attention.  

Republicans and Democrats hold very similar views about whether too much or too little attention is paid to each of these topics.

For example, 81% of Republicans and 75% of Democrats (including those who lean to each party) say that too little attention is paid to important issues facing the country. And more than six-in-ten in both parties say too little attention is being paid to the policies elected officials in both their local area and in Washington, D.C., are working on.

Similar majorities in both parties say that too much attention is given to disagreements between the parties (59% of Republicans and 55% of Democrats say this).

Majority of Americans find it stressful to talk politics with people they disagree with

Around six-in-ten U.S. adults (61%) say having political conversations with people they disagree with is generally “stressful and frustrating,” while about a third (36%) say these types of conversations are generally “interesting and informative.”

While these views are largely unchanged from two years ago, the share of Americans who say they find talking politics with people they disagree with to be stressful is now higher than it was a few years ago. In May 2019, half said these types of political conversations were stressful, while a similar share (48%) said they were interesting and informative.

Chart shows Americans increasingly say political conversations with people they disagree with are ‘stressful and frustrating’

As has been the case since 2021, there is no partisan difference in the shares viewing political conversations with people they disagree with as stressful. In prior years, Democrats were somewhat more likely than Republicans to view these conversations as stressful and frustrating.

Chart shows majorities in most demographic and political groups say it’s more stressful than interesting to talk politics with those they disagree with

Across most demographic and political groups, majorities say these conversations are more stressful and frustrating than interesting and informative.

Gender

Similar-sized majorities of men (60%) and women (62%) say talking politics with people they disagree with is stressful, while men are slightly more likely than women to find these conversations interesting (38% vs. 34%).

Race and ethnicity

Two-thirds of White adults find these types of political conversations stressful, as do 59% of Asian adults and 54% of Hispanic adults. Black adults are more evenly divided: 47% say these conversations are stressful and frustrating, while 50% say they are interesting and informative.

Age

While majorities in all age groups say conversations with those they disagree with are generally stressful, adults 50 and older are somewhat more likely to say this than younger adults (64% vs. 59%).

Education

Differences by education are similarly modest. Roughly two-thirds (66%) of those with at least a bachelor’s degree say they find talking politics with people they disagree with stressful, while about six-in-ten (59%) of those with less education say the same.

Partisanship

While similar shares of Democrats and Republicans say political conversations with those who disagree with them are stressful and frustrating, partisans are more likely than leaners – political independents who lean toward a certain party – to say the same.

In both parties, more than six-in-ten partisans say they find political conversations with those they disagree with as stressful, while around a third say they are interesting. By contrast, around four-in-ten leaners say these types of conversations are interesting, and more than half say they are stressful.

Acknowledgments

This report is a collaborative effort based on the input and analysis of the following individuals:

Research team

Carroll Doherty, Director, Political Research
Jocelyn Kiley, Associate Director, Political Research
Baxter Oliphant, Senior Researcher
Hannah Hartig, Senior Researcher
Gabe Borelli, Research Associate
Andrew Daniller, Research Associate
Ted Van Green, Research Analyst
Andy Cerda, Research Assistant
Shanay Gracia, Research Assistant

Amina Dunn, Former Research Analyst
Katy Lin, Former Research Intern

Communications and editorial

Nida Asheer, Senior Communications Manager
Talia Price, Communications Associate
Caleb Keller, Communications Assistant
Jayme Link, Communications Assistant
David Kent, Senior Copy Editor

Rachel Lim, Former Communications Intern

Graphic design and web publishing

Alissa Scheller, Information Graphics Designer
Reem Nadeem, Associate Digital Producer

Methodology

Andrew Mercer, Senior Research Methodologist
Dorene Asare-Marfo, Panel Manager
Dana Popky, Associate Panel Manager
Arnold Lau, Research Methodologist

Pew Research Center is also grateful to Jennifer Wolak, a professor in the Department of Political Science at Michigan State University, for discussing her work on attitudes about government with the research team.

Methodology

The American Trends Panel survey methodology

Overview

The American Trends Panel (ATP), created by Pew Research Center, is a nationally representative panel of randomly selected U.S. adults. Panelists participate via self-administered web surveys. Panelists who do not have internet access at home are provided with a tablet and wireless internet connection. Interviews are conducted in both English and Spanish. The panel is being managed by Ipsos.

Table shows American Trends Panel recruitment surveys

Data in this report is drawn from ATP Wave 130, conducted from July 10 to July 16, 2023, and includes an oversample of Hispanic, non-Hispanic Black, Asian, and 18- to 29-year-old adults in order to provide more precise estimates of the opinions and experiences of these smaller demographic subgroups. These oversampled groups are weighted back to reflect their correct proportions in the population. A total of 8,480 panelists responded out of 10,069 who were sampled, for a response rate of 84%. The cumulative response rate accounting for nonresponse to the recruitment surveys and attrition is 3%. The break-off rate among panelists who logged on to the survey and completed at least one item is 2%. The margin of sampling error for the full sample of 8,480 respondents is plus or minus 1.5 percentage points.

Panel recruitment

The ATP was created in 2014, with the first cohort of panelists invited to join the panel at the end of a large, national, landline and cellphone random-digit-dial survey that was conducted in both English and Spanish. Two additional recruitments were conducted using the same method in 2015 and 2017, respectively. Across these three surveys, a total of 19,718 adults were invited to join the ATP, of whom 9,942 (50%) agreed to participate.

In August 2018, the ATP switched from telephone to address-based recruitment. Invitations were sent to a stratified, random sample of households selected from the U.S. Postal Service’s Delivery Sequence File. Sampled households receive mailings asking a randomly selected adult to complete a survey online. A question at the end of the survey asks if the respondent is willing to join the ATP. In 2020 and 2021 another stage was added to the recruitment. Households that did not respond to the online survey were sent a paper version of the questionnaire, $5 and a postage-paid return envelope. A subset of the adults who returned the paper version of the survey were invited to join the ATP. This subset of adults received a follow-up mailing with a $10 pre-incentive and invitation to join the ATP.

Across the six address-based recruitments, a total of 23,862 adults were invited to join the ATP, of whom 20,917 agreed to join the panel and completed an initial profile survey. In each household, one adult was selected and asked to go online to complete a survey, at the end of which they were invited to join the panel. Of the 30,859 individuals who have ever joined the ATP, 12,950 remained active panelists and continued to receive survey invitations at the time this survey was conducted.

The U.S. Postal Service’s Delivery Sequence File has been estimated to cover as much as 98% of the population, although some studies suggest that the coverage could be in the low 90% range.1 The American Trends Panel never uses breakout routers or chains that direct respondents to additional surveys.

Sample design

The overall target population for this survey was noninstitutionalized persons ages 18 and older living in the U.S., including Alaska and Hawaii. It featured a stratified random sample from the ATP in which Hispanic, non-Hispanic Black, Asian, and 18- to 29-year-old adults were selected with certainty. The remaining panelists were sampled at rates designed to ensure that the share of respondents in each stratum is proportional to its share of the U.S. adult population to the greatest extent possible. Respondent weights are adjusted to account for differential probabilities of selection as described in the Weighting section below.

Questionnaire development and testing

The questionnaire was developed by Pew Research Center in consultation with Ipsos. The web program was rigorously tested on both PC and mobile devices by the Ipsos project management team and Pew Research Center researchers. The Ipsos project management team also populated test data that was analyzed in SPSS to ensure the logic and randomizations were working as intended before launching the survey.

Incentives

All respondents were offered a post-paid incentive for their participation. Respondents could choose to receive the post-paid incentive in the form of a check or a gift code to Amazon.com or could choose to decline the incentive. Incentive amounts ranged from $5 to $20 depending on whether the respondent belongs to a part of the population that is harder or easier to reach. Differential incentive amounts were designed to increase panel survey participation among groups that traditionally have low survey response propensities.

Data collection protocol

The data collection field period for this survey was July 10 to July 16, 2023. Postcard notifications were mailed to all ATP panelists with a known residential address on July 10. 

Invitations were sent out in two separate launches: soft launch and full launch. Sixty panelists were included in the soft launch, which began with an initial invitation sent on July 10. The ATP panelists chosen for the initial soft launch were known responders who had completed previous ATP surveys within one day of receiving their invitation. All remaining English- and Spanish-speaking sampled panelists were included in the full launch and were sent an invitation on July 11.

All panelists with an email address received an email invitation and up to two email reminders if they did not respond to the survey. All ATP panelists who consented to SMS messages received an SMS invitation and up to two SMS reminders.

Table shows Invitation and reminder dates, ATP Wave 130

Data quality checks

To ensure high-quality data, the Center’s researchers performed data quality checks to identify any respondents showing clear patterns of satisficing. This includes checking for very high rates of leaving questions blank, as well as always selecting the first or last answer presented. As a result of this checking, seven ATP respondents were removed from the survey dataset prior to weighting and analysis.

Weighting

Table shows American Trends Panel weighting dimensions

The ATP data is weighted in a multistep process that accounts for multiple stages of sampling and nonresponse that occur at different points in the survey process. First, each panelist begins with a base weight that reflects their probability of selection for their initial recruitment survey. These weights are then rescaled and adjusted to account for changes in the design of ATP recruitment surveys from year to year. Finally, the weights are calibrated to align with the population benchmarks in the accompanying table to correct for nonresponse to recruitment surveys and panel attrition. If only a subsample of panelists was invited to participate in the wave, this weight is adjusted to account for any differential probabilities of selection.

Among the panelists who completed the survey, this weight is then calibrated again to align with the population benchmarks identified in the accompanying table and trimmed at the 1st and 99th percentiles to reduce the loss in precision stemming from variance in the weights. Sampling errors and tests of statistical significance take into account the effect of weighting.

The following table shows the unweighted sample sizes and the error attributable to sampling that would be expected at the 95% level of confidence for different groups in the survey.

Table shows sample sizes and margins of error, ATP Wave 130

Sample sizes and sampling errors for other subgroups are available upon request. In addition to sampling error, one should bear in mind that question wording and practical difficulties in conducting surveys can introduce error or bias into the findings of opinion polls.

Additional wave methodology

This report also features questions fielded in an earlier survey, ATP Wave 129. Further information for those questions can be found here.

Dispositions and response rates

Table shows final dispositions, ATP Wave 130
Table shows Cumulative response rate as of ATP Wave 130

Appendix

Political engagement scale

Table shows Political engagement categories used in this report

This report uses an additive scale of three questions to measure political engagement. The scale combines how often respondents follow government and current affairs, how interested they are in politics and how often they talk about politics with others.

Each question in the scale is recoded so that the least engaged response option equals zero and the most engaged option is 1. No answer responses are set to the midpoint of 0.5. The scale has a range of zero to 3. High engagement individuals score between 2 and 3 on the scale; medium engagement score between 1.34 and 2 and low engagement score under 1.34.

Table shows items included in the political engagement scale

© Pew Research Center, 2023