Pew Research Center

FOR RELEASE JULY 12, 2023

Republican Gains in 2022 Midterms Driven Mostly by Turnout Advantage

An examination of the 2022 elections, based on validated voters

BY Hannah Hartig, Andrew Daniller, Scott Keeter and Ted Van Green

FOR MEDIA OR OTHER INQUIRIES:

Communications Department
202.419.4372
www.pewresearch.org

RECOMMENDED CITATION

Pew Research Center, July 2023, "Republican Gains in 2022 Midterms Driven Mostly by Turnout Advantage"

About Pew Research Center

Pew Research Center is a nonpartisan, nonadvocacy fact tank that informs the public about the issues, attitudes and trends shaping the world. It does not take policy positions. The Center conducts public opinion polling, demographic research, computational social science research and other data-driven research. It studies politics and policy; news habits and media; the internet and technology; religion; race and ethnicity; international affairs; social, demographic and economic trends; science; research methodology and data science; and immigration and migration. Pew Research Center is a subsidiary of The Pew Charitable Trusts, its primary funder.

© Pew Research Center 2026

Table of contents

  • About Pew Research Center
  • Republican Gains in 2022 Midterms Driven Mostly by Turnout Advantage
  • 1. Voter turnout, 2018-2022
  • 2. Voting patterns in the 2022 elections
  • 3. Demographic profiles of Republican and Democratic voters
  • Acknowledgments
  • Methodology

Republican Gains in 2022 Midterms Driven Mostly by Turnout Advantage

An examination of the 2022 elections, based on validated voters

How we did this

We conducted this study to better understand which voters cast ballots in the 2022 midterm elections and how they voted. We also wanted to compare how turnout and vote choices differed from previous elections in 2020, 2018 and 2016. Measuring turnout among different groups in the electorate is challenging; it is particularly difficult to assess changes in turnout from election to election.

Panel data provides us a unique opportunity to study elections. By surveying the same people over time, we can more clearly see how differences in who stays home – and who turns out to vote –impacts each election. We can also measure how adults’ partisan voting preferences change (or do not change) between elections

For this study, we surveyed U.S. adults online on our nationally representative American Trends Panel (ATP). We verified their turnout in the four general elections using commercial voter files that aggregate publicly available official state turnout records. Panelists who said they voted and for whom a voting record was located are considered validated voters; all others are presumed not to have voted.

Additionally, we revised our statistical approach for the 2020 survey. That produced new results that slightly changed the numbers we reported about the 2020 election but changed no substantive findings in our report.

Here are the questions used for this report, along with responses, and its methodology.

Terminology

American Trends Panel: Pew Research Center’s online probability survey panel, which consists of more than 12,000 adults who take two to three surveys each month. Some panelists have been participating in surveys since 2014.

Defectors/Defection: People who either switch their vote to a different party’s candidate from one election to the next, or those who in a given election do not support the candidate of the party they usually support. Also referred to as “vote switching.”

Drop off/Drop-off voters: People who vote in a given election but not in a subsequent election. The term commonly refers to people who vote in a presidential election but not in the next midterm. It can also apply to any set of elections.

Midterm elections: General elections held in all states and the District of Columbia in the even-numbered years between presidential elections. All U.S. House seats are up for election every two years, as are a third of U.S. Senate seats (senators serve six-year terms).

Mobilize: Efforts by candidates, political campaigns and other organizations to encourage or facilitate eligible citizens to turn out to vote.

Nonvoter: Citizens who didn’t have a record of voting in any voter file or told us they didn’t vote.

Panel survey: A type of survey that relies on a group of people who have agreed to participate in multiple surveys over a time period. Panel surveys make it possible to observe how individuals change over time because the answers they give to questions in a current survey can be compared with their answers from a previous survey.

Party affiliation/Party identification: Psychological attachment to a particular political party, either thinking of oneself as a member of the party or expressing greater closeness to one party than another. Our study categorizes adults as Democrats or Republicans using their self-reported party identification in a survey.

Split-ticket voting/Straight-ticket voting: Voters typically cast ballots for more than one office in a general election. People who vote only for candidates of the same party are “straight-ticket” voters, while those who vote for candidates of different parties are “split-ticket” voters.

Turnout: Refers to “turning out” to vote, or simply “voting.” Also used to refer to the share of eligible adults who voted in a given election (e.g., “The turnout in 2020 among the voting eligible population in the U.S. was 67%”).

Validated voters/Verified voter: Citizens who told us in a post-election survey that they voted in the 2022 general elections and have a record for voting in a commercial voter file. (The two terms are interchangeable).

Voter file: A list of adults that includes information such as whether a person is registered to vote, which elections they have voted in, whether they voted in person or by mail, and additional data. Voter files do not say who a voter cast a ballot for. Federal law requires states to maintain electronic voter files, and businesses assemble these files to create a nationwide list of adults along with their voter information.
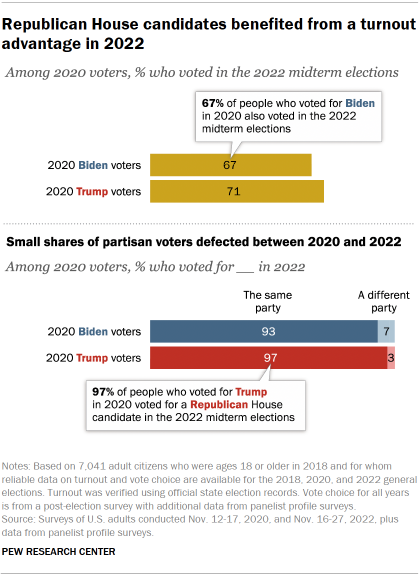
Chart shows Republican House candidates benefited from a turnout advantage in 2022

In midterm elections that yielded mixed results for both parties, Republicans won the popular vote for the U.S. House of Representatives largely on the strength of higher turnout.

A new Pew Research Center analysis of verified voters and nonvoters in 2022, 2020, 2018 and 2016 finds that partisan differences in turnout – rather than vote switching between parties – account for most of the Republican gains in voting for the House last year.

Overall, 68% of those who voted in the 2020 presidential election turned out to vote in the 2022 midterms. Former President Donald Trump’s voters turned out at a higher rate in 2022 (71%) than did President Joe Biden’s voters (67%).

For additional analysis of voter turnout in the 2022 election, refer to Chapter 1 of this report.

Large majority of voters stuck with 2020, 2018 party preference in their 2022 vote choices

As in previous elections, party loyalty remained strong in last fall’s midterms.

Relatively small shares of voters defected from their partisan affiliation or 2020 presidential vote. Among those who voted for both president in 2020 and for a House representative in 2022, just 6% crossed party lines between elections or voted for third-party candidates in either election.

Similarly, the vast majority of those who voted in both 2018 and 2022 had consistent party preferences across the two elections: 95% of those who voted for a Republican candidate in 2018, and 92% of those who voted for a Democrat, voted for a House candidate of the same party four years later.

Democratic 2018 voters were slightly more likely than Republican 2018 voters to defect in 2022, with the net consequences of the party balance flipping 1 or 2 percentage points to the GOP.

That is a potentially impactful shift in an environment of very close elections, but the greater driver of the GOP’s performance in 2022 was differential turnout: higher turnout among those supporting Republican candidates than those supporting Democratic candidates.
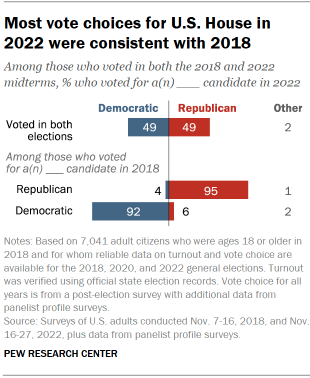
Chart shows most vote choices for U.S. House in 2022 were consistent with 2018

Given sharp political divisions in the United States, small changes in voter turnout from election to election have big consequences. Political polarization has meant that most people who vote in midterm elections are committed politically, making it unlikely they would defect from their partisan affiliation.

Shifts in turnout, as opposed to defections, were responsible for most of the changes in vote margins from the 2018 midterms within most subgroups in the population. For example, the Democratic advantage among women dropped from 18 points in 2018 (58% Democratic, 40% Republican) to just 3 points in 2022 (51% and 48%, respectively).

But when looking only at women who voted in both elections, there is no net advantage for either party from defections: 6% of those who voted Democratic in 2018 flipped to vote for a Republican candidate in 2022, and a nearly identical share of women who voted Republican in 2018 voted for a Democratic candidate in 2022 (5%).
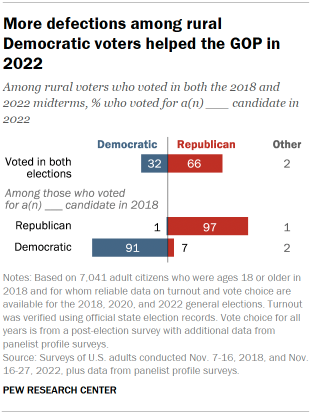
Chart shows more defections among rural Democratic voters helped the GOP in 2022

Virtually all of the decline in the Democratic advantage among women is explained by the fact that the 2022 turnout rate for women who voted Republican in 2018 was 8 points higher than the rate for women who voted Democratic that year (84% vs. 76%).

There were a few important exceptions to this general rule.

For example, more rural voters changed their vote from a Democratic to a Republican candidate between 2018 and 2022 than the reverse. The Republican margin among this group nearly doubled between 2018 and 2022 (from 21 points to 40 points). Among rural voters, Republican candidates in 2022 held on to 97% of those who voted Republican in 2018, while Democratic candidates held on to a smaller share (91%).

And among White voters with no college degree, Republicans benefited from slightly higher rates of defection from Democratic candidates among those who voted in both elections

Chapter 2 of this report features detailed breakdowns of voting patterns across the electorate.

‘Drop-off’ voters contributed to Republican House gains

Collectively, Republican candidates for the House received roughly 51% of the total vote last fall compared with 48% for Democratic candidates. This helped the Republican Party gain a narrow majority in the House. Democrats retained control of the Senate. While Republicans exceeded expectations in a few states – notably New York and Florida – pre-election predictions of a “red wave” failed to materialize.

However, the broad outcome of the elections in much of the country was shaped largely by the underlying political makeup of the 2022 voters and how they differed from the voters of 2020 and 2018.

Midterm voters tend to be older, more educated and more affluent than those who vote just in presidential election years, a pattern apparent in both 2018 and 2022. The two elections also had something else in common: The president’s party suffered more “drop-off” voters than did the opposing party.

People who voted in 2018 who did not turn out in 2022 (“drop-off” voters), had favored Democrats in 2018 by about two-to-one (64% to 33%). Likewise, about a third of 2020 voters (32%) did not turn out in 2022. This group voted 53% to 43% for Joe Biden. The absence of these 2020 Biden voters resulted in a worse performance for Democratic candidates in 2022.

The drop-off voters mattered but so, too, did voters who turned out in 2022 but not in earlier elections – and these voters also helped Republican candidates. Those voting in 2022 included 21% who had not voted in 2018. This group supported Republican candidates in 2022 by a margin of 58% to 40%.

National polling data, especially when based on interviews conducted over time with the same individuals, can shed light on these dynamics. But there are limitations with national data, given that midterms are state and local elections. Partisan defections and split-ticket voting were critically important to the success of individual candidates for U.S. Senate and governor. These defections tended to benefit Democratic candidates more often than Republican candidates, even when national turnout trends mostly benefited Republican candidates.

This study is based on surveys of members of the Center’s American Trends Panel following the last four general elections (2016-2022). Voter turnout in each election was verified by a comparison with official records.

Some of the analysis focuses on a subset of 7,041 panelists interviewed post-election in 2022 for whom reliable measures of voter turnout and candidate choice were also available for the 2018 and 2020 elections. This allowed us to analyze how individuals’ voting preferences changed over time, separating the political consequences of changes in party preferences from changes in who turned out in each election. (All analysis that considers individual-level changes in turnout or vote preference excludes the 2016 dataset, due to diminishing sample sizes among those who were in the panel across multiple elections.)

Other key findings from the study

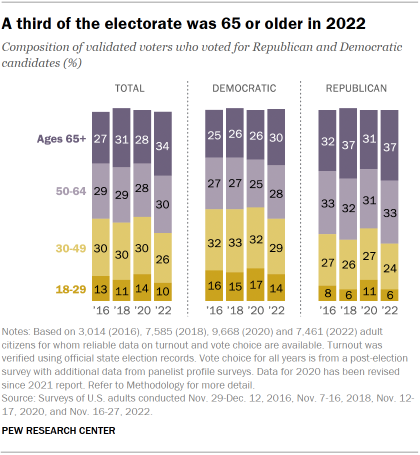
  • Voters under 30 continued to strongly support the Democratic Party, voting 68% to 31% for Democratic candidates. But this margin was somewhat narrower than in 2018. Republicans benefitted more from significant drop off in voter turnout among younger age groups between 2018 and 2022, since young voters tend to support Democrats. Voters under 30 accounted for 10% of the electorate in 2022 – similar to their share of all voters in 2018 (11%), but down from 2020 (14%). To learn more about voter demographics, such as age, race & ethnicity, religion and community type, refer to Chapter 3 of this report.
  • Ideological polarization by party was nearly complete in 2022: Only 1% of self-described conservative Republicans voted for Democratic House candidates and less than 1% of liberal Democrats voted Republican.
  • Voting in person on Election Day increased sharply in 2022 compared with 2020. More voters reported casting ballots in person on Election Day in both parties, but the share remained much higher among Republican voters (51%) than among Democratic voters (34%).
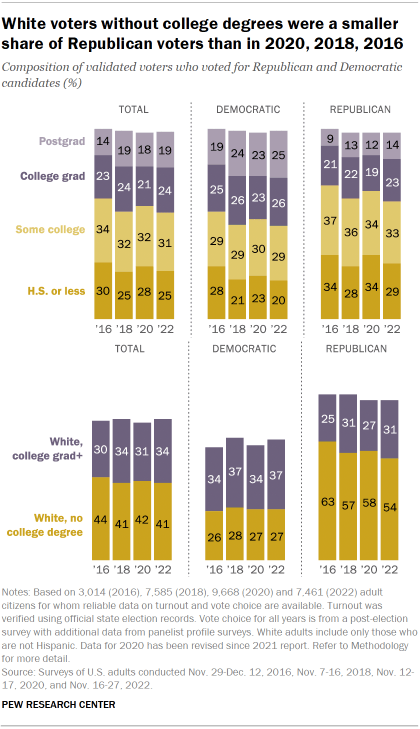
  • White voters without college degrees made up a majority (54%) of Republican voters in 2022, compared with 27% of Democratic voters. Yet these voters made up a somewhat greater share of GOP voters in 2020 (58%) and 2018 (57%).
  • Voters ages 50 and older were a larger share of the total in 2022 (64%) than in any of the past three elections. 70% of Republican voters were 50 or older, as were 57% of Democratic voters.
  • Hispanic voters continued to support Democrats, but by a much smaller margin than in 2018: Hispanic voters favored Democratic candidates by a 21-point margin in 2022, compared with a 47-point margin in 2018. This change was driven by asymmetric changes in voter turnout among Hispanic adults, rather than changing preferences among individual Hispanic voters.
  • Black voters continued to support Democrats by overwhelming margins: 93% voted for Democrats in the midterms while 5% supported Republicans. This is similar to levels of support in 2020, 2018 and 2016. Black voters made up 9% of the electorate in both 2022 and 2018 and 11% of the electorate in 2020.
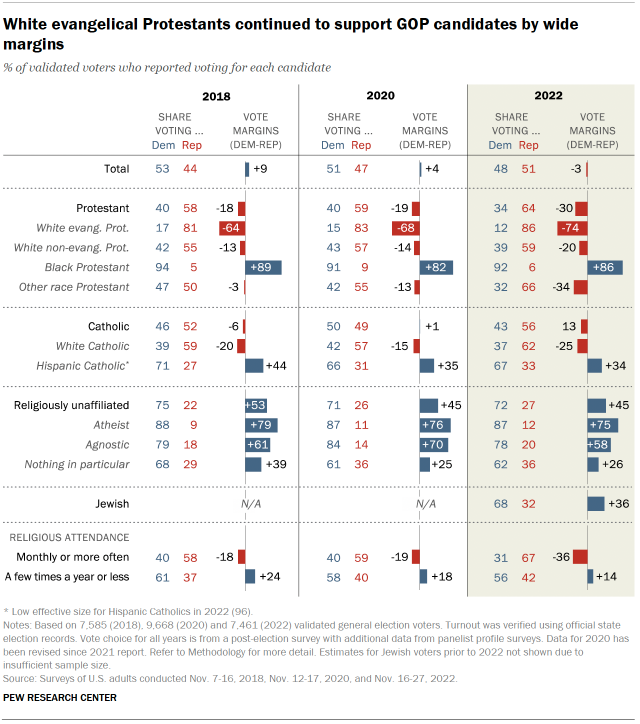
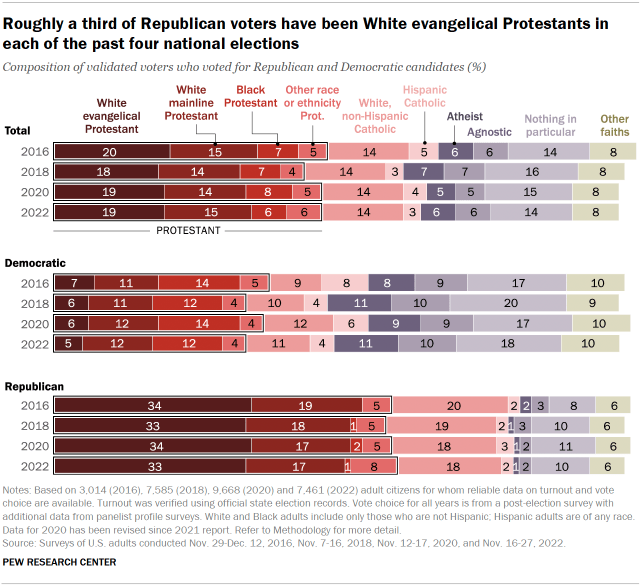
  • The Republican advantage among White evangelical Protestants was somewhat larger in 2022 than in the past three elections. 86% supported Republican candidates in 2022 and only 12% voted Democratic.
1. Voter turnout, 2018-2022

Terminology

American Trends Panel: Pew Research Center’s online probability survey panel, which consists of more than 12,000 adults who take two to three surveys each month. Some panelists have been participating in surveys since 2014.

Defectors/Defection: People who either switch their vote to a different party’s candidate from one election to the next, or those who in a given election do not support the candidate of the party they usually support. Also referred to as “vote switching.”

Drop off/Drop-off voters: People who vote in a given election but not in a subsequent election. The term commonly refers to people who vote in a presidential election but not in the next midterm. It can also apply to any set of elections.

Midterm elections: General elections held in all states and the District of Columbia in the even-numbered years between presidential elections. All U.S. House seats are up for election every two years, as are a third of U.S. Senate seats (senators serve six-year terms).

Mobilize: Efforts by candidates, political campaigns and other organizations to encourage or facilitate eligible citizens to turn out to vote.

Nonvoter: Citizens who didn’t have a record of voting in any voter file or told us they didn’t vote.

Panel survey: A type of survey that relies on a group of people who have agreed to participate in multiple surveys over a time period. Panel surveys make it possible to observe how individuals change over time because the answers they give to questions in a current survey can be compared with their answers from a previous survey.

Party affiliation/Party identification: Psychological attachment to a particular political party, either thinking of oneself as a member of the party or expressing greater closeness to one party than another. Our study categorizes adults as Democrats or Republicans using their self-reported party identification in a survey.

Split-ticket voting/Straight-ticket voting: Voters typically cast ballots for more than one office in a general election. People who vote only for candidates of the same party are “straight-ticket” voters, while those who vote for candidates of different parties are “split-ticket” voters.

Turnout: Refers to “turning out” to vote, or simply “voting.” Also used to refer to the share of eligible adults who voted in a given election (e.g., “The turnout in 2020 among the voting eligible population in the U.S. was 67%”).

Validated voters/Verified voter: Citizens who told us in a post-election survey that they voted in the 2022 general elections and have a record for voting in a commercial voter file. (The two terms are interchangeable).

Voter file: A list of adults that includes information such as whether a person is registered to vote, which elections they have voted in, whether they voted in person or by mail, and additional data. Voter files do not say who a voter cast a ballot for. Federal law requires states to maintain electronic voter files, and businesses assemble these files to create a nationwide list of adults along with their voter information.

The elections of 2018, 2020 and 2022 were three of the highest-turnout U.S. elections of their respective types in decades. About two-thirds (66%) of the voting-eligible population turned out for the 2020 presidential election – the highest rate for any national election since 1900. The 2018 election (49% turnout) had the highest rate for a midterm since 1914. Even the 2022 election’s turnout, with a slightly lower rate of 46%, exceeded that of all midterm elections since 1970.

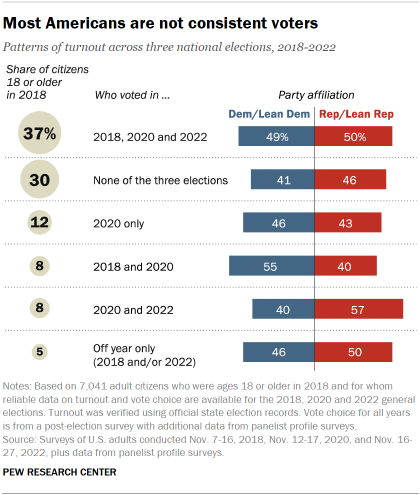
Chart shows most Americans are not consistent voters

While sizable shares of the public vote either consistently or not at all, many people vote intermittently. Given how closely divided the U.S. is politically, these intermittent voters often determine the outcome of elections and how the balance of support for the two major political parties swings between elections.

Overall, 70% of U.S. adult citizens who were eligible to participate in all three elections between 2018 and 2022 voted in at least one of them, with about half that share (37%) voting in all three.

Adults who voted in at least one election during the period divide evenly between Democrats and independents who lean toward the Democratic Party or Republicans and Republican-leaning independents in their current party affiliation (48% each). The subset who voted in all three elections are similarly divided (49% Democrats, 50% Republicans). Citizens who did not vote in any of the three tilt Republican by 46% to 41%.

Democrats outnumbered Republicans among the 8% of adult citizens who voted in 2018 and 2020 but not 2022 (55% Democratic, 40% Republican). A similar-sized group (8%) voted in 2020 and 2022 but not 2018, and this group’s composition tilts Republican (57%, vs. 40% Democratic). The 12% who voted in 2020 and opted out of both the 2018 and 2022 midterms were roughly evenly divided among Democrats (46%) and Republicans (43%).

Given the sizable number of intermittent voters and chronic nonvoters, as well as the fact that this group, collectively, is fairly evenly divided in partisan affiliation, both parties have plenty of potential supporters on the sidelines in any given election.

Political preferences differ a lot by race and ethnicity … and so does voter turnout

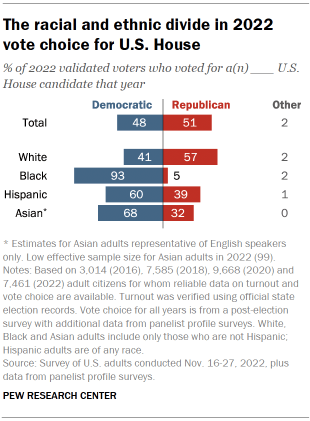
Chart shows the racial and ethnic divide in 2022 vote choice for U.S. House

Race and ethnicity are fundamental dividing lines in American politics, with political preferences and electoral participation varying greatly by race and ethnicity.

In the current partisan alignment, Black, Hispanic and Asian voters are all majority Democratic groups, to different degrees, though Republican candidates have gained some ground in the past four years among Hispanic voters.

Black voters remain Democratic stalwarts, voting 93% to 5% for the party’s candidates for U.S. House in 2022. Hispanic and Asian voters clearly favored Democratic candidates as well, but by narrower margins: 60% to 39% for Hispanic voters, and 68% to 32% for Asian voters.

Chart shows White adults voted more consistently than those of other racial or ethnic backgrounds from 2018 through 2022

But White Americans are much more consistent voters than Black, Hispanic or Asian Americans. Compared with the national average of 37% who voted in 2018, 2020 and 2022, 43% of White citizens who were age eligible to vote in all three elections did so; just 24% did not vote in any of these.

Black, Hispanic and Asian adults lagged far behind, with 27% of Black, 19% of Hispanic and 21% of Asian age-eligible citizens voting in all three elections. Hispanic citizens were most likely to have not voted in any of the most recent three general elections (47%, compared with 36% for Black and 31% for Asian citizens ages 22 and older in 2022).

Differences by education

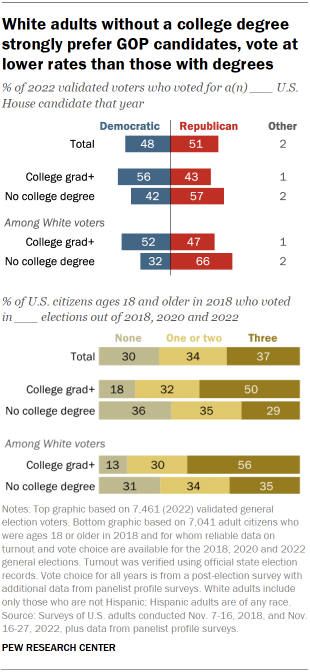
Over the past few election cycles, Republicans have gained ground among White adults who do not have a college degree, who make up 41% of eligible voters. This group is about average in its consistency of voter turnout, with 35% of those ages 22 and over in 2022 voting in 2018, 2020 and 2022, and 31% voting in none of these three elections. White voters without a college degree favored Republican House candidates 66% to 32% in 2022.

By contrast, White adults with college degrees vote at very high rates: 56% of those eligible turned out in all three elections and just 13% participated in none of them. College-educated White adults make up 24% of the eligible electorate but about a third of voters in 2022 (34%). White voters with college degrees had tilted Republican for several decades, but in the past four elections have favored Democratic candidates (52% to 47% in 2022).

Chart shows White adults without a college degree
strongly prefer GOP candidates, vote at
lower rates than those with degrees

The education gap in White voters’ preferences in 2022 was not apparent among either Black or Hispanic voters (the sample size of Asian voters without a college degree was too small to produce a reliable estimate). College-educated Black and Hispanic adults also voted at higher rates than Black and Hispanic adults without a college degree in each of the three elections.

A small education gap appeared in 2020 presidential preference among Hispanic voters: College-educated Hispanic voters preferred Biden by a margin of 69% to 29%, while Hispanic voters without a college degree preferred Biden by a somewhat narrower margin (58% to 39%). But no significant education gap in candidate preference was observed for Black or Hispanic voters in 2018 or 2022, nor for Black voters in 2020.

The upshot of racial differences in candidate preference and turnout patterns is that Republican candidates benefited from both the relatively large size of the White adult population without a college degree and their somewhat higher turnout rates compared with Black, Hispanic and Asian adults.

Growth in support for Democratic candidates among White voters with a college degree, along with the high turnout levels among this group, offset some of the growth in support for the Republican Party among White voters without a college degree. But college-educated White adults remain a smaller share of all eligible voters than White adults without a college degree.

Voters and nonvoters

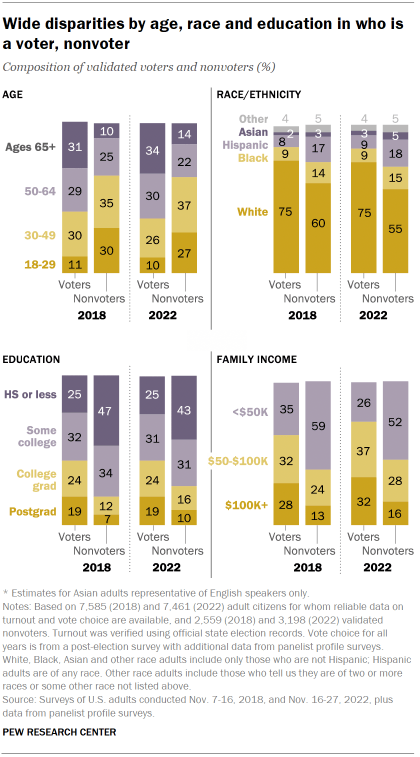
Chart shows wide disparities by age, race and education in who is a voter, nonvoter

The two most recent midterms – 2022 and 2018 – both featured unusually high turnout compared with nearly every other recent midterm election year. But the differences between those who turned out to vote in 2022 versus 2018 – and between those who did not vote – accounted for much of the difference in outcomes between the two elections.

The stark demographic differences between voters and nonvoters in 2022 are similar to those seen in previous U.S. elections.

Voters were much older, on average, than nonvoters. Adults under 50 made up 36% of voters, but 64% of nonvoters. This is very similar to the pattern seen in 2018 – although those under 50 made up a somewhat larger share of voters in 2018 (40%).

Turnout also differed by race and ethnicity.

Three-quarters of voters (75%) were White, non-Hispanic adults. But this group accounted for a smaller share (55%) of nonvoters. Hispanic adults and Black, non-Hispanic adults each made up 9% of voters, but slightly larger shares of nonvoters (18% and 15%, respectively). Asian Americans made up 3% of voters, and a slightly higher share (5%) of nonvoters. These differences are nearly identical to the patterns seen in 2018.

There are also large educational and income differences between voters and nonvoters. Adults with a college degree made up 43% of voters in 2022, but only 25% of nonvoters. Those without a college degree made up 56% of voters, but 74% of nonvoters.

Voting methods in the 2022 election

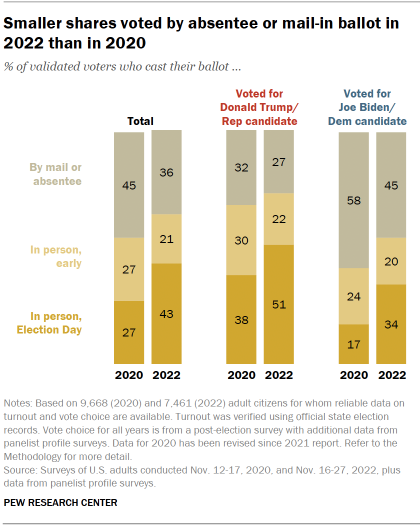
Chart shows smaller shares voted by absentee or mail-in ballot in 2022 than in 2020

As concerns over the COVID-19 pandemic declined, fewer voters reported having voted absentee or by mail in 2022 than in 2020.

In 2022, 43% of voters said they cast their ballot in person on Election Day. A somewhat smaller share (36%) said they cast an absentee or mail-in ballot, and 21% said they voted in person before Election Day.

In the 2020 election, held during the first year of the coronavirus pandemic, 45% of voters said they cast their ballots by absentee or mail-in ballot, while identical shares (27%) said they voted in person either on Election Day or beforehand.

As was the case in 2020, voters who supported Republican candidates were more likely to report having voted in person on Election Day than by other methods. About half (51%) of those who supported Republicans said they voted this way, while smaller shares said they voted by mail or absentee ballot (27%) or voted in person before Election Day (22%). In 2020, 38% said they voted in person on Election Day, while somewhat smaller shares said they voted by mail or absentee (32%) or voted in person before Election Day (30%).

Chart shows large divides in candidate support by vote method

Voters who supported Democratic candidates were more likely to say they cast absentee or mail-in ballots (45%). About one-third (34%) said they voted in person on Election Day and two-in-ten said they voted in person before Election Day. In 2020, a 58% majority said they voted by mail or absentee ballot, while just 17% said they voted in person on Election Day.

Reflecting these patterns, Republicans won a majority of votes among those who said they voted in person on Election Day, 60% to 38%. Democrats won – by an identical margin – voters who said they voted by mail or absentee ballot. Those who said they voted in person before Election Day were divided: 53% supported Republican candidates, while 46% voted for Democratic candidates.

2. Voting patterns in the 2022 elections

Terminology

American Trends Panel: Pew Research Center’s online probability survey panel, which consists of more than 12,000 adults who take two to three surveys each month. Some panelists have been participating in surveys since 2014.

Defectors/Defection: People who either switch their vote to a different party’s candidate from one election to the next, or those who in a given election do not support the candidate of the party they usually support. Also referred to as “vote switching.”

Drop off/Drop-off voters: People who vote in a given election but not in a subsequent election. The term commonly refers to people who vote in a presidential election but not in the next midterm. It can also apply to any set of elections.

Midterm elections: General elections held in all states and the District of Columbia in the even-numbered years between presidential elections. All U.S. House seats are up for election every two years, as are a third of U.S. Senate seats (senators serve six-year terms).

Mobilize: Efforts by candidates, political campaigns and other organizations to encourage or facilitate eligible citizens to turn out to vote.

Nonvoter: Citizens who didn’t have a record of voting in any voter file or told us they didn’t vote.

Panel survey: A type of survey that relies on a group of people who have agreed to participate in multiple surveys over a time period. Panel surveys make it possible to observe how individuals change over time because the answers they give to questions in a current survey can be compared with their answers from a previous survey.

Party affiliation/Party identification: Psychological attachment to a particular political party, either thinking of oneself as a member of the party or expressing greater closeness to one party than another. Our study categorizes adults as Democrats or Republicans using their self-reported party identification in a survey.

Split-ticket voting/Straight-ticket voting: Voters typically cast ballots for more than one office in a general election. People who vote only for candidates of the same party are “straight-ticket” voters, while those who vote for candidates of different parties are “split-ticket” voters.

Turnout: Refers to “turning out” to vote, or simply “voting.” Also used to refer to the share of eligible adults who voted in a given election (e.g., “The turnout in 2020 among the voting eligible population in the U.S. was 67%”).

Validated voters/Verified voter: Citizens who told us in a post-election survey that they voted in the 2022 general elections and have a record for voting in a commercial voter file. (The two terms are interchangeable).

Voter file: A list of adults that includes information such as whether a person is registered to vote, which elections they have voted in, whether they voted in person or by mail, and additional data. Voter files do not say who a voter cast a ballot for. Federal law requires states to maintain electronic voter files, and businesses assemble these files to create a nationwide list of adults along with their voter information.

In the 2022 midterm elections, there were familiar patterns in voting preferences among subgroups. Younger voters, Black voters and those living in urban areas continued to support Democratic candidates while older, White and rural voters backed Republicans.

But the GOP improved its performance in 2022 across most voting subgroups relative to 2018 – due almost entirely to differential partisan turnout. Voters who were more favorable to Republican candidates turned out at higher rates compared with those who typically support Democrats. Shifting preferences among individual voters – though likely consequential in some races – was a much smaller factor in the 2022 midterms compared with turnout.

Gender, race and the 2022 vote

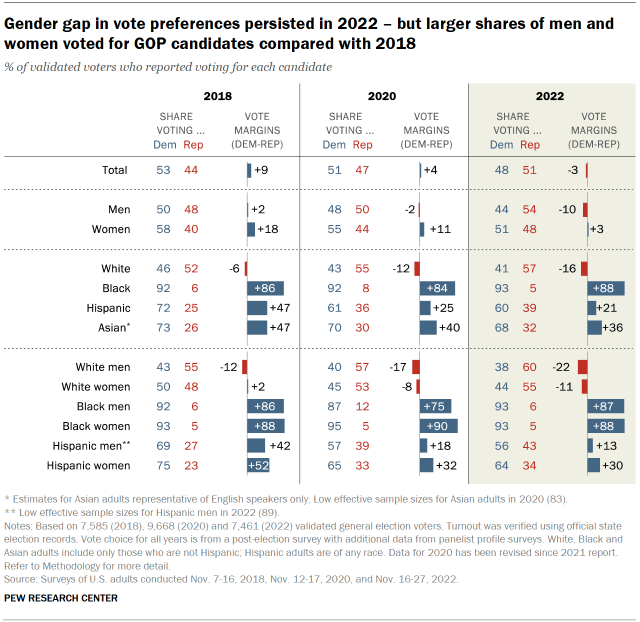
Overall, the gender gap in 2022 vote preferences was roughly similar to the gaps in 2020 and 2018. And even as men continued to be more likely than women to favor GOP candidates, Republicans improved their performance among both groups compared with 2018.

In 2018, men were roughly evenly divided between Democratic and Republican candidates. In the 2022 midterms, 54% of men cast ballots for GOP candidates, while 44% preferred Democrats. Republicans also gained support from a higher share of women compared with previous elections: 48% of women voters cast ballots for GOP candidates in 2022 while 51% favored Democrats. In 2018, 40% voted for Republicans while 58% supported Democrats. These shifts in margins largely reflect differential turnout, rather than shifting preferences.

As in previous elections, White voters continued to favor GOP candidates. In the 2022 midterms, 57% of White voters cast ballots for GOP candidates compared with 41% who supported Democrats. This 16 percentage point difference is about as wide as it was in 2020 (12 points) and wider than in 2018 (6 points). These changes also are largely attributable to turnout differences.

The gender gap among White voters in 2022 was similar to the gap in 2018. Republicans fared better among both White men and White women in 2022 compared with four years prior.

Black voters continued to support Democrats by overwhelming margins: 93% voted for Democrats in the midterms while 5% supported Republicans. This is similar to levels of support in 2020, 2018 and 2016. As in previous elections, in 2022, Black men and Black women supported Democrats at comparable levels.

While Hispanic voters continued to favor Democrats over Republicans, a higher share of Hispanic voters supported GOP candidates in the 2022 election compared with in 2018. In November, 60% of Hispanic voters cast ballots for Democrats compared with 39% who supported Republicans. This 21-point margin is smaller than in 2018, when 72% of Hispanic voters favored Democrats and 25% supported Republicans.

Chart shows Gender gap in vote preferences persisted in 2022 – but larger shares of men and women voted for GOP candidates compared with 2018

Among Hispanic voters who cast ballots in the 2018 election, 37% did not vote in the 2022 midterms. Those who did not vote had tilted heavily Democratic in 2018 – reflecting asymmetric changes in voter turnout among Hispanic adults.

Asian voters – who have favored Democratic candidates over Republicans in the last several elections – continued to do so in 2022. In November, 68% voted for Democrats while 32% voted for Republicans. In 2018, similar shares cast ballots for each party’s candidates (73% for Democrats vs. 26% for Republicans).

Education and voting preferences

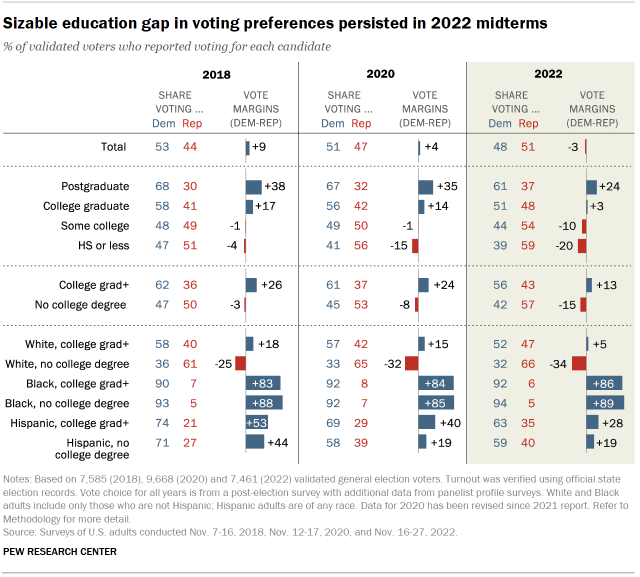
In 2022, voters with a college degree or more education favored Democratic candidates while those with no college degree preferred Republicans – continuing a long-standing trend in polarization among American voters by education.

Chart shows Sizable education gap in voting preferences persisted in 2022 midterms

In November, voters with a college degree or more formal education cast ballots for Democratic candidates by a double-digit margin (56% voted for Democrats, 43% supported Republicans). And among voters with no college degree, preferences were nearly the reverse (57% supported GOP candidates vs. 42% for Democratic candidates). But compared with their performance in 2020, 2018 and 2016, Democrats performed worse in 2022 among those with a college degree. At the same time, a higher share of voters without college degrees also supported GOP candidates in 2022.

Much of the lagging Democratic performance compared with previous elections is attributable to differential partisan turnout rather than changing candidate preferences among voters.

For example, among the 18% of college-educated 2018 voters who did not turn out to vote in 2022, 62% supported a Democratic candidate for House four years ago while 34% supported a Republican candidate. Among 2018 voters with no college degree, 25% did not turn out in 2022. Among those in this group, 64% had supported Democrats, while 32% had backed Republicans in 2018.

Among White voters with no college degree, Republicans benefited from slightly higher rates of defection from Democratic candidates among those who voted in both elections. The GOP also made gains due to a larger share of those who sat out in 2018 election turning out to vote for Republican candidates in 2022.

In contrast, the GOP’s better performance among White, college-educated adults compared with four years prior was nearly all attributable to differential turnout, rather than to defections.

Though Hispanic voters with and without a college degree broke for Democrats over Republican candidates, Democratic performance among both groups was not as strong as it was in 2018.

Among Hispanic voters with a college degree, 35% cast a ballot for a GOP candidate in the House; this compares with 21% who did so in 2018.

Hispanic voters without college degrees also supported GOP candidates by a wider margin in 2022 compared with 2018: 40% reported voting for Republican candidates in 2022, compared with 27% in 2018.

Among both sets of voters, a higher share of those who voted for Democratic candidates in 2018 did not turn out in 2022 compared with those who supported Republicans in 2018.

Age and the 2022 election

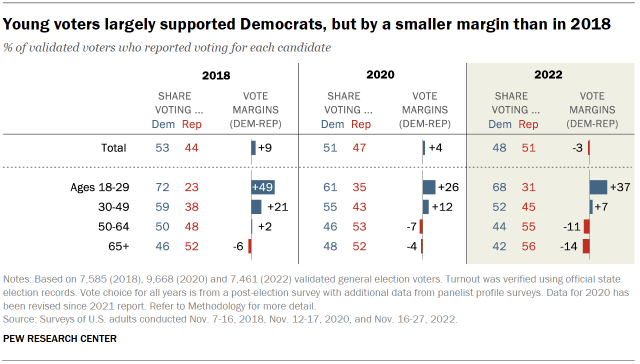
Age continues to be strongly associated with voting preferences in U.S. elections. Nearly seven-in-ten voters under 30 (68%) supported Democratic candidates in 2022 – much higher than the shares of voters ages 30 to 49 (52%), 50 to 64 (44%) and 65 and older (42%) who did so. Compared with 2018, GOP candidates performed better among voters who turned out across age groups.

Chart shows Young voters largely supported Democrats, but by a smaller margin than in 2018

In 2022, younger voters made up a smaller share of the electorate than they did in 2018. In 2022, 36% of voters were under 50, compared with 40% of voters in 2018. Decreased turnout among these more reliably Democratic voters contributed to the GOP’s better performance in November.

Older voters turned out more reliably in both elections – and continued to be largely loyal to Republican candidates. For example, among adults ages 69 and older in 2022 (i.e., those who were 65 or older in 2018), 35% reported voting for Republicans in both 2018 and 2022. This compares with 28% who voted for Democrats in both elections. Another 18% of this group did not vote in either election.

Party, ideology and the 2022 election

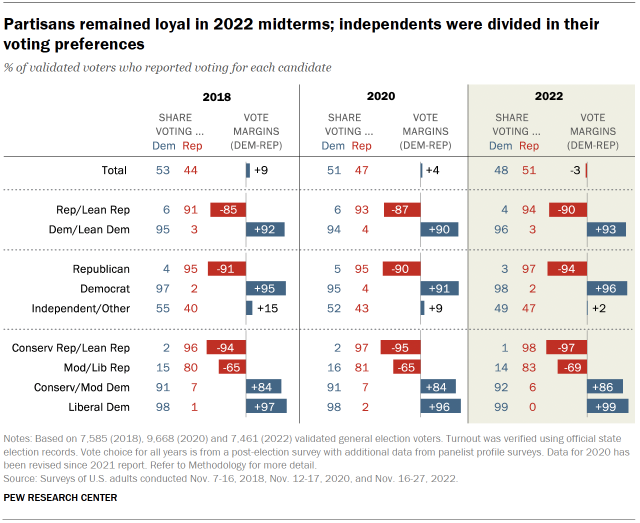
Republican and Democratic candidates achieved similar levels of party loyalty in the 2022 midterms, with 96% of Democrats and Democratic-leaning voters supporting a Democratic candidate in November and 94% of Republicans and Republican-leaning voters supporting Republicans.

Chart shows Partisans remained loyal in 2022 midterms; independents were divided in their voting preferences

Voters who do not identify with either party were divided in their preferences: 49% reported voting for a Democratic candidate in the 2022 midterms, while 47% supported Republicans. In 2018, voters in this group were more likely to favor Democratic candidates (55%) than Republicans (40%).

There was a strong relationship between political ideology and voting preferences: Overwhelming shares of conservative Republicans (98%) and liberal Democrats (99%) reported voting for their party’s candidate in 2022. Slightly smaller shares of conservative and moderate Democrats (92%) and moderate and liberal Republicans (83%) said they did so – a dynamic that is consistent with previous elections.

Urban, suburban, rural voting in 2022

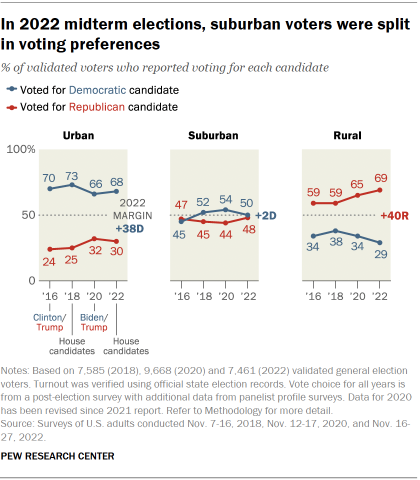
Chart shows In 2022 midterm elections, suburban voters were split in voting preferences

The urban-rural divide in voting preferences continues to be a major factor in American elections. Rural voters continue to be reliable GOP supporters, and urban voters continue to favor Democrats. In 2022, this split was as wide as it’s been in recent elections: 69% of rural voters cast ballots for Republicans, with just 29% supporting Democrats. The reverse pattern appears among urban voters: 68% supported Democrats, while 30% supported Republicans.

Among urban voters, lower turnout among voters who were favorable to Democrats in 2018 resulted in a slightly better performance for the GOP compared with four years prior: 31% of urban voters who cast ballots for Democrats in 2018 did not turn out in 2022, while 22% of urban voters who turned out for Republicans in 2018 sat out the 2022 midterms.

In rural areas, several factors boosted GOP candidates’ margins in 2022. Those who sat out in 2018 but voted in 2022 (9% of rural citizens overall) broke for Republican candidates: 77% supported Republican candidates in 2022 compared with 22% who supported Democrats.

Additionally, while few rural voters switched allegiances between the two elections, this was more prevalent among those who supported Democrats in 2018 (5% of whom switched their support to a GOP candidate in 2022) than among those who had supported Republicans four years earlier (just 1% of whom voted for Democrats in 2022). Rural voters who supported Democrats in 2018 stayed home at higher rates in 2022 compared with those cast ballots for GOP candidates (29% vs. 14%).

Suburban voters who turned out in 2022 were divided: 50% supported Democratic candidates for the House in November while 48% supported Republicans. In 2018, 52% of suburban voters favored Democrats, while 45% broke for Republicans. Both parties managed to hold on to suburban voters who had voted in 2018: 5% of those who supported a Democrat in 2018 switched to back a GOP candidate in 2022, while 4% of those who supported a Republican in 2018 switched to a Democratic candidate four years later.

However, suburban 2018 Democratic voters were somewhat less likely to turn out in 2022 (22% stayed home) than 2018 suburban GOP voters (16% stayed home).

Religion and the 2022 election

Voters in 2022 sorted along religious lines in familiar ways compared with previous elections. Protestant voters continued to prefer the GOP by nearly two-to-one: 64% supported Republican candidates in November compared with 34% who supported Democrats. Among Protestants overall, GOP candidates improved their performance compared with 2018 by mobilizing some who did not turn out in 2018.

White evangelical Protestant voters – long a reliably Republican segment of the electorate – overwhelmingly supported GOP candidates over Democrats in the 2022 midterms (86% vs. 12%).

Among Catholic voters, White Catholics favored Republican candidates by 25 points, whereas Hispanic Catholics favored Democratic candidates by an even greater margin (34 points).

Jewish voters preferred Democratic candidates by a more than two-to-one margin in the 2022 midterms (68% to 32%).

Voters who do not affiliate with any religion (that is, those who describe themselves religiously as atheists, agnostics, or “nothing in particular”) continued to back Democratic candidates by significant margins. In November, 72% of this group reported voting for a Democratic candidate in the midterms, while 27% supported Republicans. In 2018, 75% voted for Democrats while 22% cast ballots for Republicans.

The gap in voting preferences by religious attendance was as wide as it’s been in any of the last several elections: 56% of those who said they attend religious services a few times a year or less reported voting for Democratic candidates in the 2022 midterms; 42% supported Republican candidates.

But GOP candidates were the favorite among those who attend services monthly or more by more than two-to-one (67%, vs. 31% who voted for Democratic candidates).

Chart shows White evangelical Protestants continued to support GOP candidates by wide margins

3. Demographic profiles of Republican and Democratic voters

Terminology

American Trends Panel: Pew Research Center’s online probability survey panel, which consists of more than 12,000 adults who take two to three surveys each month. Some panelists have been participating in surveys since 2014.

Defectors/Defection: People who either switch their vote to a different party’s candidate from one election to the next, or those who in a given election do not support the candidate of the party they usually support. Also referred to as “vote switching.”

Drop off/Drop-off voters: People who vote in a given election but not in a subsequent election. The term commonly refers to people who vote in a presidential election but not in the next midterm. It can also apply to any set of elections.

Midterm elections: General elections held in all states and the District of Columbia in the even-numbered years between presidential elections. All U.S. House seats are up for election every two years, as are a third of U.S. Senate seats (senators serve six-year terms).

Mobilize: Efforts by candidates, political campaigns and other organizations to encourage or facilitate eligible citizens to turn out to vote.

Nonvoter: Citizens who didn’t have a record of voting in any voter file or told us they didn’t vote.

Panel survey: A type of survey that relies on a group of people who have agreed to participate in multiple surveys over a time period. Panel surveys make it possible to observe how individuals change over time because the answers they give to questions in a current survey can be compared with their answers from a previous survey.

Party affiliation/Party identification: Psychological attachment to a particular political party, either thinking of oneself as a member of the party or expressing greater closeness to one party than another. Our study categorizes adults as Democrats or Republicans using their self-reported party identification in a survey.

Split-ticket voting/Straight-ticket voting: Voters typically cast ballots for more than one office in a general election. People who vote only for candidates of the same party are “straight-ticket” voters, while those who vote for candidates of different parties are “split-ticket” voters.

Turnout: Refers to “turning out” to vote, or simply “voting.” Also used to refer to the share of eligible adults who voted in a given election (e.g., “The turnout in 2020 among the voting eligible population in the U.S. was 67%”).

Validated voters/Verified voter: Citizens who told us in a post-election survey that they voted in the 2022 general elections and have a record for voting in a commercial voter file. (The two terms are interchangeable).

Voter file: A list of adults that includes information such as whether a person is registered to vote, which elections they have voted in, whether they voted in person or by mail, and additional data. Voter files do not say who a voter cast a ballot for. Federal law requires states to maintain electronic voter files, and businesses assemble these files to create a nationwide list of adults along with their voter information.

Many of the prominent demographic differences that have defined the two parties’ voting coalitions in recent years persisted in the 2022 elections. Democratic voters were once again, on average, younger, more racially and ethnically diverse, and more likely to possess college degrees than Republican voters. Those who voted for a Democratic candidate for the U.S. House were also less likely to live in a rural area and more likely to be religiously unaffiliated than Republican voters.

Racial and ethnic composition of 2022 voters

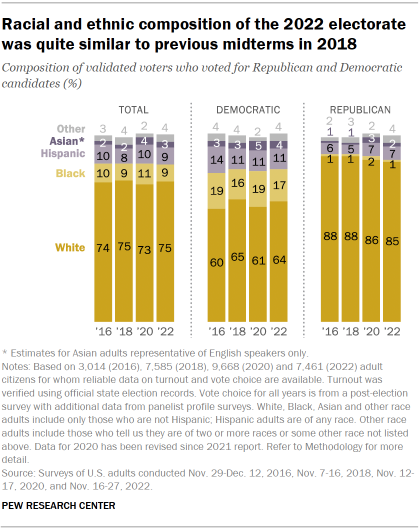
Chart shows Racial and ethnic composition of the 2022 electorate was quite similar to previous midterms in 2018

More than eight-in-ten Republican voters in 2022 (85%) were White, non-Hispanic, down slightly (from 88%) compared with the 2018 midterms. Nearly identical shares of Democratic voters in 2022 (64%) and 2018 (65%) were White.

Black, non-Hispanic voters represented 17% of Democratic voters in 2022, while Hispanic and Asian voters accounted for 11% and 4%, respectively, of the Democratic Party’s support at the polls. Hispanic voters made up 7% of Republican voters, while 2% of GOP voters were Asian and 1% were Black.

Rural, suburban and urban composition of 2022 voters

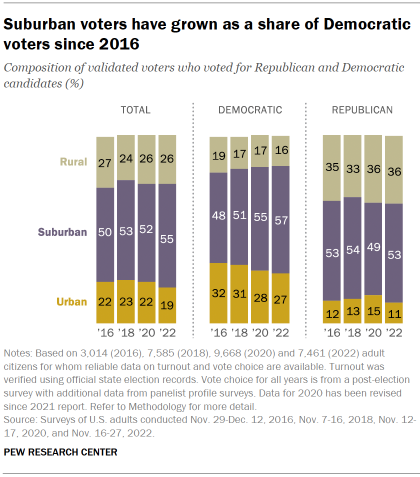
Even as the Democratic voting coalition has remained more urban and the Republican coalition more rural overall, the share of suburban voters among Democratic voters has been rising since 2016.

Chart shows Suburban voters have grown as a share of Democratic voters since 2016

In Donald Trump’s 2016 presidential victory, suburban voters made up nearly half of Democratic voters (48%). By the 2022 midterm elections, they comprised 57% of the Democratic voting coalition. Among the electorate as a whole, the share of suburban voters was 55% in 2022, up 5 percentage points from 2016.

The share of Democratic voters who describe their communities as urban declined by 5 points since 2016 (from 32% to 27%).

Among Republican voters, shifts have been much more modest in recent years. Roughly half of Republican voters in 2022 (53%) reported living in suburban communities, while 36% reported living in rural communities and 11% in urban areas. These shares were nearly identical to the shares of Republican voters living in suburban (53%), rural (35%) and urban (12%) communities in 2016.

Educational composition of 2022 voters

Chart shows White voters without college degrees were a smaller
share of Republican voters than in 2020, 2018, 2016

A somewhat larger share of the electorate has held college degrees in each of the past two midterm elections (43% each) than in the past two presidential elections (39% in 2020, 37% in 2016).

As was the case in the 2018 midterms, voters with and without college degrees each accounted for roughly half of the Democratic Party’s voters in 2022 (51% held college degrees while 49% did not).

By contrast, a majority of Republican voters in 2022 had no college degree (63%); a smaller share had a college degree or more (37%). This is similar to the shares of Republican voters with and without a college degree in 2018.

White voters without college degrees made up a majority (54%) of Republican voters in 2022, compared with 27% of Democratic voters. Yet the share of Republican voters who are members of this group was down 4 points compared with the 2020 presidential election.

Age composition of 2022 voters

The electorate was somewhat older in 2022, on average, than in other recent elections, with 64% of validated voters ages 50 and older. And while the Democratic voting coalition was once again younger than the Republican coalition, both parties relied slightly more on the ballots of older voters than they have in other recent elections.

Chart shows a third of the electorate was 65 or older in 2022

A majority of Democratic voters (57%) were ages 50 and older in the 2022 midterms, compared with 51% of Joe Biden’s voters in 2020 and 53% of voters who supported a Democratic House candidate in 2018. Just 14% of Democratic voters were under the age of 30 in 2022 — similar to the 15% of Democratic voters who were in this age group in 2018, but less than their share of Democratic voters in 2020 (17%).

Seven-in-ten Republican voters were 50 and older in the most recent election, compared with 62% of Republican voters in 2020 and 68% in 2018.

Religious composition of 2022 voters

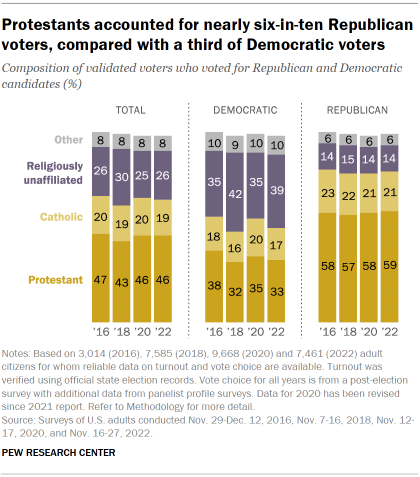
Chart shows Protestants accounted for nearly six-in-ten Republican voters, compared with a third of Democratic voters

Protestants once again accounted for a majority of Republican voters (59%), with their share of the party’s voters essentially unchanged across the past four elections. Protestants constituted a third of Democratic voters in 2022; a larger share of Democratic voters (39%) described themselves as religiously unaffiliated (including atheists, agnostics and those who describe themselves as “nothing in particular”).

White evangelical Protestant voters made up about a third of the Republican voting coalition in 2022, while accounting for just 5% of Democratic voters. And while Black Protestants continue to represent a more substantial share of Democratic voters than Republican voters (12% vs. 1%), the share of Republican voters who are Protestant and have a racial or ethnic background other than Black or White grew slightly in 2022 (to 8%, up from 5% in the previous three election cycles).

Chart shows roughly a third of Republican voters have been White evangelical Protestants in each of the past four national elections

Acknowledgments

This report was made possible by The Pew Charitable Trusts. Pew Research Center is a subsidiary of The Pew Charitable Trusts, its primary funder.

This report is a collaborative effort based on the input and analysis of the following individuals:

Research team

Hannah Hartig, Senior Researcher
Andrew Daniller, Research Associate
Scott Keeter, Senior Survey Advisor
Ted Van Green, Research Analyst
Carroll Doherty, Director, Political Research
Jocelyn Kiley, Associate Director, Political Research
Andrew Mercer, Senior Research Methodologist
Arnold Lau, Research Methodologist
Amina Dunn, Research Analyst
Andy Cerda, Research Assistant

Communications and editorial

Rachel Drian, Associate Director, Communications
Nida Asheer, Senior Communications Manager
Talia Price, Communications Associate
Rebecca Leppert, Copy Editor

Graphic design and web publishing

Peter Bell, Design Director
Alissa Scheller, Senior Information Graphics Designer
Reem Nadeem, Digital Producer

Methodology

Courtney Kennedy, Vice President, Methods and Innovation
Dorene Asare-Marfo, Panel Manager

Several others provided helpful comments and input on this study, including Michael Dimock, Mark Hugo Lopez and Gregory Smith.

Methodology

Pew Research Center conducted this study to understand how Americans voted in 2022 and how their turnout and vote choices differed from 2016, 2018 and 2020. For this analysis, we surveyed U.S. adults online and verified their turnout in the four general elections using commercial voter files that aggregate publicly available official state turnout records. Panelists who said they voted and for whom a record of voting was located are considered validated voters; all others are presumed not to have voted.

The analysis in this report relies on two slightly different sets of data drawn from the same pool of panelists.

Comparisons of 2022, 2020, 2018 and 2016

Much of this report describes the 2022 vote broken down by various groups in the population, taken from the 2022 post-election survey (described below), with similar reporting from post-election surveys conducted after the 2016 presidential, 2018 congressional and 2020 presidential elections. Estimates for 2016 and 2018 in this part of the report are identical to those published in Pew Research Center’s earlier reports and rely solely on the relevant post-election surveys at the time.

Results from 2020 reported here and in the online detailed tables may be slightly different than those in the 2020 version of the report because we revised our statistical approach for the 2020 survey. We did this to give us more confidence in the precision of our estimates for some of the groups of voters we discuss in this report. The new weighting made no difference in any substantive conclusions from the 2020 report. More detail about the revision of the 2020 estimates can be found at the end of this Methodology chapter.

Analysis of individual-level change over time

The other part of this report (Chapter 1) examines change and continuity in turnout and vote choice among individual panelists. For this analysis we attempted to measure voter turnout and vote choice for the 2016, 2018, 2020 and 2022 elections for all panelists who took the 2022 and 2020 post-election surveys, including respondents who were not members of the panel at the time of the earlier surveys.

The post-election surveys used in this report were conducted Nov. 29-Dec. 12, 2016; Nov. 7-16, 2018; Nov. 12-17, 2020; and Nov. 16-27, 2022. Everyone who took part is a member of the Center’s ATP. The surveys are weighted to be representative of the U.S. adult population by gender, race, ethnicity, partisan affiliation, education, and many other characteristics, as described below.

The American Trends Panel survey methodology

The American Trends Panel (ATP), created by Pew Research Center, is a nationally representative panel of randomly selected U.S. adults. Panelists participate via self-administered web surveys. Panelists who do not have internet access at home are provided with a tablet and wireless internet connection. Interviews are conducted in both English and Spanish. The panel is being managed by Ipsos.

This report is based on interviews from four separate waves of the panel, ATP Waves 23, 39, 78 and 117, conducted Nov. 29-Dec. 12, 2016; Nov. 7-16, 2018; Nov. 12-17, 2020; and Nov. 16-27, 2022, respectively. Panelists participate via self-administered web surveys. Panelists who do not have internet access are provided with a tablet and wireless internet connection. Interviews are conducted in both English and Spanish. At the time of the Nov. 29-Dec. 12, 2016, survey, the panel was managed by Abt Associates, and it is currently being managed by Ipsos, which oversaw data collection for the 2018 and 2020 surveys.

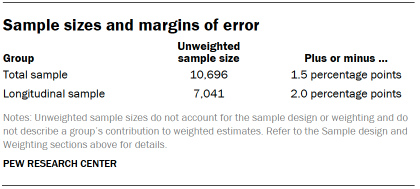
This report focuses on the 2022 election, relying on data from the panel wave conducted Nov. 16-27, 2022, supplemented with data from the other three post-election waves along with panelist profile data (collected in annual surveys of all members of the panel) and additional surveys. A total of 11,377 panelists responded out of 12,402 who were sampled, for a response rate of 92%. The cumulative response rate accounting for nonresponse to the recruitment surveys and attrition is 4%. The break-off rate among panelists who logged on to the survey and completed at least one item is 1%. The margin of sampling error for the full sample of 11,377 respondents is plus or minus 1.5 percentage points.

Panel recruitment

The ATP was created in 2014, with the first cohort of panelists invited to join the panel at the end of a large, national, landline and cellphone random-digit-dial survey that was conducted in both English and Spanish. Two additional recruitments were conducted using the same method in 2015 and 2017, respectively. Across these three surveys, a total of 19,718 adults were invited to join the ATP, of whom 9,942 (50%) agreed to participate.

Table shows American Trends Panel recruitment surveys

In August 2018, the ATP switched from telephone to address-based recruitment. Invitations were sent to a stratified, random sample of households selected from the U.S. Postal Service’s Delivery Sequence File. Sampled households receive mailings asking a randomly selected adult to complete a survey online. A question at the end of the survey asks if the respondent is willing to join the ATP. In 2020 and 2021 another stage was added to the recruitment. Households that did not respond to the online survey were sent a paper version of the questionnaire, $5 and a postage-paid return envelope. A subset of the adults who returned the paper version of the survey were invited to join the ATP. This subset of adults received a follow-up mailing with a $10 pre-incentive and invitation to join the ATP.

Across the five address-based recruitments, a total of 23,176 adults were invited to join the ATP, of whom 20,341 agreed to join the panel and completed an initial profile survey. In each household, one adult was selected and asked to go online to complete a survey, at the end of which they were invited to join the panel. Of the 30,283 individuals who have ever joined the ATP, 12,402 remained active panelists and continued to receive survey invitations at the time this survey was conducted.

The U.S. Postal Service’s Delivery Sequence File has been estimated to cover as much as 98% of the population, although some studies suggest that the coverage could be in the low 90% range.1 The American Trends Panel never uses breakout routers or chains that direct respondents to additional surveys.

Vote choice measures for panelists who did not participate in the 2016, 2018 or 2020 surveys

In addition to the comparisons of how different groups in the population voted over time, the current report focuses on how individual panelists’ turnout and vote choice changed over time. A large number of people who participated in the 2022 post-election survey had not been on the panel or did not respond to the 2016, 2018 or 2020 post-election surveys at the time they were conducted. For these panelists, their vote choices for 2016, 2018 or 2020 were measured after the fact.

For panelists who did not take the 2016 post-election survey, 2016 vote choice was measured on either of three annual profile surveys, depending on when they joined the panel. These were conducted May 30-Oct. 23, 2017; Aug. 20-Oct. 28, 2018; and Aug. 3-16, 2020. In all cases, the vote choice question asked whether panelists voted for Hillary Clinton, Donald Trump or someone else. People who joined the panel in 2021 or 2022 were not asked about turnout and participation in the 2016 election. 

For panelists who did not take the 2018 post-election survey, 2018 vote choice was measured in the 2020 annual profile survey, conducted Aug. 3-16, 2020. The vote choice question for the U.S. House of Representatives asked whether panelists voted for the Democratic Party’s candidate, the Republican Party’s candidate, or another candidate. As with the 2016 findings, these were used to supplement the 2018 post-election survey for the analysis of individual-level change.

For panelists who joined the ATP in 2021 or 2022, 2020 vote choice was measured on the NPORS surveys conducted May 28-Aug. 25, 2021, and May 23-Sept. 6, 2022. The vote choice question asked panelists who said that they voted in 2020 whether they voted for Joe Biden, Donald Trump, or another candidate. For panelists who were in the panel in November 2020 but who did not take the post-election survey, vote choice was measured in surveys conducted June 14-27, 2021, and Oct. 10-16, 2022.

Panelists who did not take any survey in which 2020 vote choice was measured (N=68), panelists who refused to answer the vote choice question (N=153) and panelists who declined to provide their names and thus could not be matched to a voter record (N=92) were removed from the analysis of the 2022 vote, leaving 11,064 panelists for analysis. In addition, panelists who did not take the 2020 post-election survey (N=3,580) were removed from the analysis of individual-level change over time, leaving 7,484 panelists for that portion of the report.

An effort was made to match the panelists to three commercial voter files: one that serves conservative and Republican organizations and campaigns; one that serves progressive and Democratic organizations and campaigns; and one that is nonpartisan. People for whom a registration record could not be found are included in the files but likely underrepresent nonvoters. Because of a law passed in 2018, Utah residents can opt to keep their voter registration and vote history data private. Consequently, Utah residents in the ATP are considered to be voters if they reported having voted when asked in the post-election survey.

Out of the 11,064 panelists in this analysis, 10,696 were voting eligible, and 10,157 (95%) were matched to at least one of these files. A turnout record for 2022 (or self-report for Utah) was located for 7,626 panelists. Panelists who provided names but could not be matched or for whom no 2022 turnout record could be located were considered to be validated nonvoters (3,099 panelists). When also including those who said they did not vote on the survey, the total number of validated nonvoters is 3,198.

The 2020 survey

The 2020 survey was conducted Nov. 12-17, 2020, among 11,818 panelists. Noncitizens and those who refused the citizenship question (N=450), validated voters who refused to answer the vote choice question (N=84) and panelists who declined to provide their names and thus could not be matched to a voter record (N=139) were removed, leaving 11,145 panelists for analysis.

The 2020 survey was also matched to three commercial voter files, and Utah residents were also considered to be voters if they self-reported having voted.

Overall, 97% of voting eligible panelists were matched to at least one of these files and a turnout record for 2020 (or self-report for Utah) was located for 9,668 panelists. Panelists who could not be matched or for whom no 2020 turnout record could be located were considered to be validated nonvoters (1,477 panelists).

Here are additional details about the administration of this survey.

The 2018 survey

The 2018 post-election survey was conducted Nov. 7-16, 2018, among 10,640 panelists. Noncitizens, those who refused to answer the vote choice question and panelists who declined to provide their names and thus could not be matched to a voter record were removed, leaving 10,144 panelists for analysis. An effort was made to match the panelists to two commercial voter files. Overall, 94% of panelists were matched to at least one file and a turnout record for 2018 was located for 7,585 panelists. Panelists who could not be matched or for whom no 2018 turnout record could be located were considered to be validated nonvoters (2,559 panelists).

The 2016 survey

The 2016 survey was conducted Nov. 29-Dec. 12, 2016, among 4,183 respondents. Noncitizens, those who refused to answer the vote choice question and panelists who declined to provide their names and thus for whom a match to a voter record could not be attempted were removed from the analysis, leaving 3,770 panelists for analysis. An effort was made to match the panelists to five commercially available databases that contain information about voter registration and turnout for nearly every U.S. adult. In total, 91% of panelists were located in at least one of the files. Panelists who were verified as having voted in at least one of the commercial voter databases were considered to be validated voters (3,014 individuals) and are included in the tabulations. Panelists for whom no turnout record was located were considered to be nonvoters (756 individuals).

The validation process is discussed in detail in a more general report about commercial voter files published in February 2018, “Commercial Voter Files and the Study of U.S. Politics.”

The 2016 vote choices reported here are based on panelists who said that they voted and were verified as having done so. Those who refused to state their vote choice or who reported voting for a candidate other than Hillary Clinton, Donald Trump, Gary Johnson or Jill Stein were excluded from the analysis.

The resulting sample of verified voters mirrored the election results very closely. After the validation was done and the sample was limited to those for whom a turnout record could be located, 48% reported voting for Clinton and 45% for Trump. By comparison, the official national vote tally was 48% for Clinton and 46% for Trump.

Weighting for the 2022 post-election survey and for the longitudinal analysis

Table shows Weighting dimensions

The ATP data is weighted in a multistep process that accounts for multiple stages of sampling and nonresponse that occur at different points in the survey process.

First, each panelist begins with a base weight that reflects their probability of selection for their initial recruitment survey. These weights are then rescaled and adjusted to account for changes in the design of ATP recruitment surveys from year to year.

Finally, the weights are calibrated to align with the population benchmarks in the accompanying table to correct for nonresponse to recruitment surveys and panel attrition. If only a subsample of panelists was invited to participate in the wave, this weight is adjusted to account for any differential probabilities of selection.

Among the panelists who completed the survey, this weight is then calibrated again to align with the population benchmarks identified in the accompanying table and trimmed at the 1st percentile to reduce the loss in precision stemming from variance in the weights. Sampling errors and tests of statistical significance take into account the effect of weighting.

Two separate weights are used in this report, one for the analysis of the 2022 vote and one for the longitudinal analysis of the 2016, 2018, 2020 and 2022 votes. Only the longitudinal weight is aligned to 2018 voter turnout and generic congressional ballot estimates.

A final adjustment was applied to the trimmed weights to ensure that turnout and the popular vote margin for 2018, 2020 and 2022 exactly matched the weighting benchmark.

The following table shows the unweighted sample sizes and the error attributable to sampling that would be expected at the 95% level of confidence for different groups in the survey.

Table shows Sample sizes and margins of error

In addition to sampling error, one should bear in mind that question wording and practical difficulties in conducting surveys can introduce error or bias into the findings of opinion polls.

Revision of the 2020 data

Additionally, we revised our statistical approach for the 2020 survey. That produced new results that slightly changed the numbers we reported about the 2020 election but changed no substantive findings in our report. There was nothing inaccurate about the 2020 results, but we chose to use a slightly different survey weighting approach that increases the precision of our estimates for some of the groups of voters we discussed in the report, especially those that are difficult to reach and interview.

Although the revised numbers for 2020 appear in the current report and in the accompanying online data tables, the report on the 2020 election has not been changed, and the data tables provided with that report are still available.