Pew Research Center

FOR RELEASE JUNE 16, 2022

Politics on Twitter: One-Third of Tweets From U.S. Adults Are Political

Those ages 50 and older produce 78% of all political tweets from U.S. adults

BY Samuel Bestvater, Sono Shah, Gonzalo Rivero and Aaron Smith

FOR MEDIA OR OTHER INQUIRIES:

Communications Department
202.419.4372
www.pewresearch.org

RECOMMENDED CITATION

Pew Research Center, June 2022, "Politics on Twitter: One-Third of Tweets From U.S. Adults Are Political"

About Pew Research Center

Pew Research Center is a nonpartisan, nonadvocacy fact tank that informs the public about the issues, attitudes and trends shaping the world. It does not take policy positions. The Center conducts public opinion polling, demographic research, computational social science research and other data-driven research. It studies politics and policy; news habits and media; the internet and technology; religion; race and ethnicity; international affairs; social, demographic and economic trends; science; research methodology and data science; and immigration and migration. Pew Research Center is a subsidiary of The Pew Charitable Trusts, its primary funder.

© Pew Research Center 2026

Table of contents

  • About Pew Research Center
  • Politics on Twitter: One-Third of Tweets From U.S. Adults Are Political
  • 1. Survey findings on Twitter users’ political attitudes and experiences
  • 2. The political content in users’ tweets and the accounts they follow
  • Acknowledgments
  • Methodology

Politics on Twitter: One-Third of Tweets From U.S. Adults Are Political

Those ages 50 and older produce 78% of all political tweets from U.S. adults

How we did this

Pew Research Center conducted this study to gain insight into Twitter users’ political engagement, attitudes and behaviors on the platform. For this analysis, we surveyed 2,548 U.S. adult Twitter users in May 2021 about their experiences on the site, as well as how they engage with politics outside of Twitter. Everyone who took part in this survey is a member of the Center’s American Trends Panel (ATP) – an online survey panel that is recruited through national, random sampling of residential addresses – and indicated that they use Twitter. 

In addition to the survey findings, researchers from the Center also examined the actual Twitter profiles of a subset of survey participants who agreed to share their handles for research purposes. First, researchers collected all of the publicly visible tweets posted between May 2020 and May 2021 by these users. Researchers then used a machine learning classifier to identify which of those tweets mentioned politics or political concepts. Second, they collected a random sample of 2,859 accounts followed by at least one of these users – as well as all of the accounts followed by 20 or more respondents – and manually categorized them into different substantive categories based on their profile information. For more information on the different methods used in this analysis, see the report methodology.

Here are the questions used for the report, along with responses, and its methodology.

Roughly one-quarter of American adults use Twitter. And when they share their views on the site, quite often they are doing so about politics and political issues. A new Pew Research Center analysis of English-language tweets posted between May 1, 2020, and May 31, 2021, by a representative sample of U.S. adult Twitter users finds that fully one-third (33%) of those tweets are political in nature.

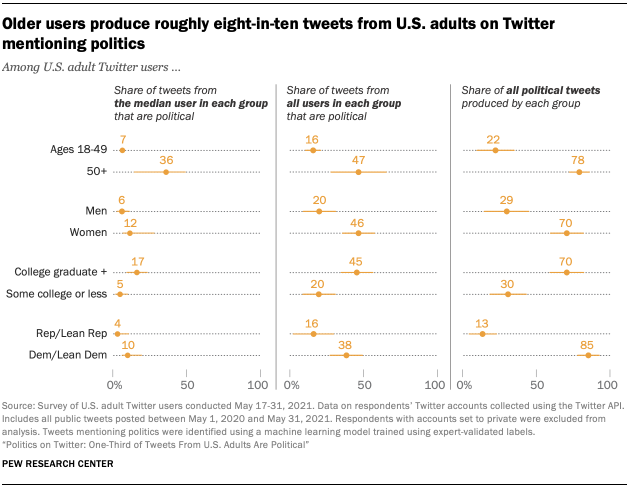
Echoing the Center’s findings in its prior studies of tweeting behavior, whether political or otherwise, the vast majority of these political tweets are produced by a minority of users. And certain demographic groups are especially active contributors to the overall volume of political content on Twitter. Most notably, Americans ages 50 and older make up 24% of the U.S. adult Twitter population but produce nearly 80% of all political tweets. And 36% of the tweets produced by the typical (median) U.S. adult Twitter user age 50 or older contain political content, roughly five times the share (7%) for the tweets from the typical 18- to 49-year-old.
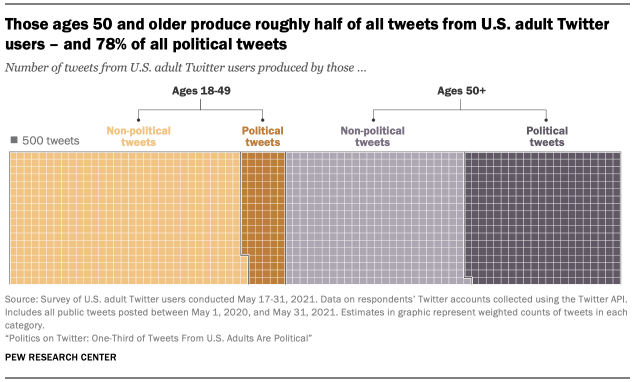
Chart showing those ages 50 and older produce roughly half of all tweets from U.S. adult Twitter users – and 78% of all political tweets

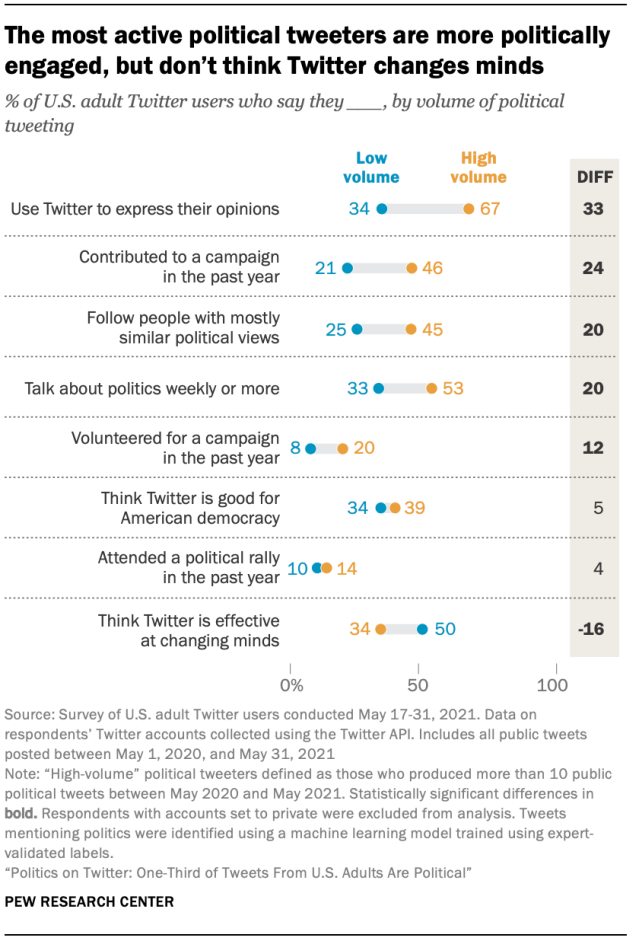
More broadly, Americans who tweet the most about politics differ in several ways from those for whom politics is a less central topic of discussion. These “high-volume” political tweeters are significantly more likely than other users to say that they use Twitter to express their own opinions (67% vs. 34%); that they talk about politics with others at least once a week (53% vs. 33%); that they contributed to a political campaign in the last year (46% vs. 21%); or that they participate in politics because they enjoy it, as opposed to viewing it as a civic duty (27% vs. 14%).

At the same time, a larger share of these politically vocal users say the people they follow on Twitter have similar political views to their own (45% vs. 25%). And despite – or perhaps because of – their regular forays into the world of political tweeting, those who tweet the most about politics are actually less likely than other users to say that Twitter is an effective way to get people to change their minds about political or social issues. Just 34% of the most active political tweeters feel this way, compared with half of those who tweet less about politics. 

This analysis builds on the Center’s previous research on political content on Twitter, which identified relevant content using relatively strict, keyword-based approaches. For instance, our 2019 examination of politics on Twitter focused on discussions of politics at the national level and categorized tweets as political in nature only if they “mention[ed] or express[ed] support or opposition toward national politicians or elected officials, political parties, ideological groups or political institutions, or specific political behaviors like voting.” This definition excluded mentions of state or local politics and politicians, as well as discussions of policy issues and current events that carry a political valence but do not explicitly reference national political figures or groups.

This new analysis identifies political content with more nuance and subtlety. Researchers at the Center trained a supervised machine learning classifier on an expert-validated collection of tweets that human coders had read and categorized according to whether or not they referenced political officials and activists, social issues, or news and current events. This classifier was then able to learn the textual patterns and terms that lead human readers to recognize a tweet as “about politics” and identify such patterns in tweets that humans had not previously coded. With a broader definition of political content and a more flexible classifier, this analysis more comprehensively reflects the range and diversity of political discussion as it occurs on platforms like Twitter. Not surprisingly given these definitional differences, the current analysis identifies a larger share of tweets as political in nature.

Among the other major findings of this examination of the political characteristics, attitudes and online behaviors of U.S. adults on Twitter:
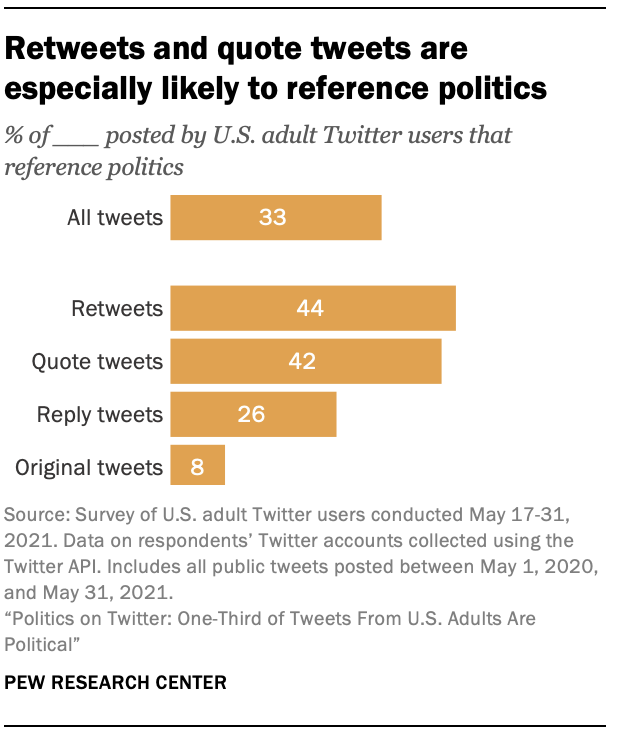
Chart showing Retweets and quote tweets are especially likely to reference politics

Retweets and quote tweets are more likely to contain political content than original tweets. This analysis of one year of tweets from a representative sample of U.S. adult Twitter users finds that certain types of tweets are more likely than others to contain political content. Roughly four-in-ten retweets (44%) and quote tweets (42%) from these users were found to pertain to politics. But that share falls to 26% for replies – and to just 8% for original tweets.

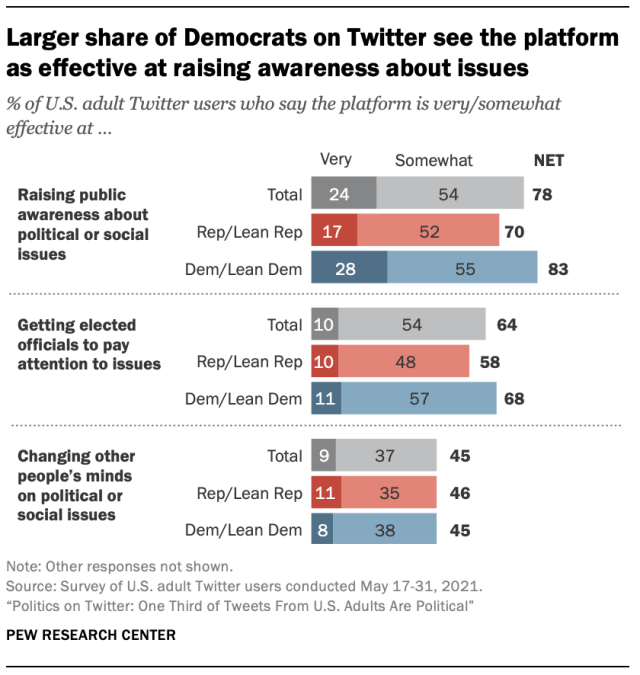
Democrats and Republicans who use Twitter have different political experiences on the site. A larger share of Democrats than Republicans (including political independents who “lean” toward either party) say they have tweeted about political or social issues in the 30 days preceding the survey (30% vs. 17%). And a larger share of Democrats say that Twitter is very effective at raising public awareness about political or social issues (28% vs. 17%). 

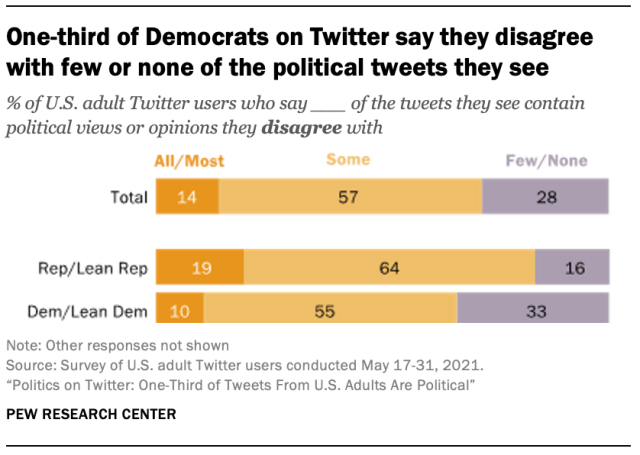
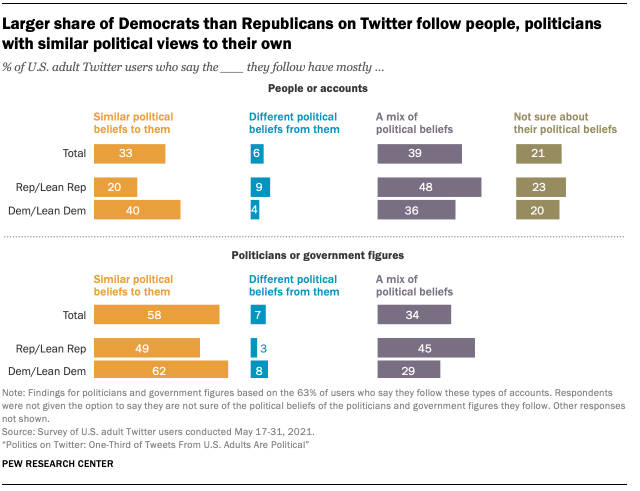
Americans from each party also report seeing different types of political content on the site. Democrats who use Twitter are twice as likely as Republicans to say they mostly follow accounts with similar political beliefs to their own (40% vs. 20%) or that they disagree with few or none of the tweets they see (33% vs. 16%).

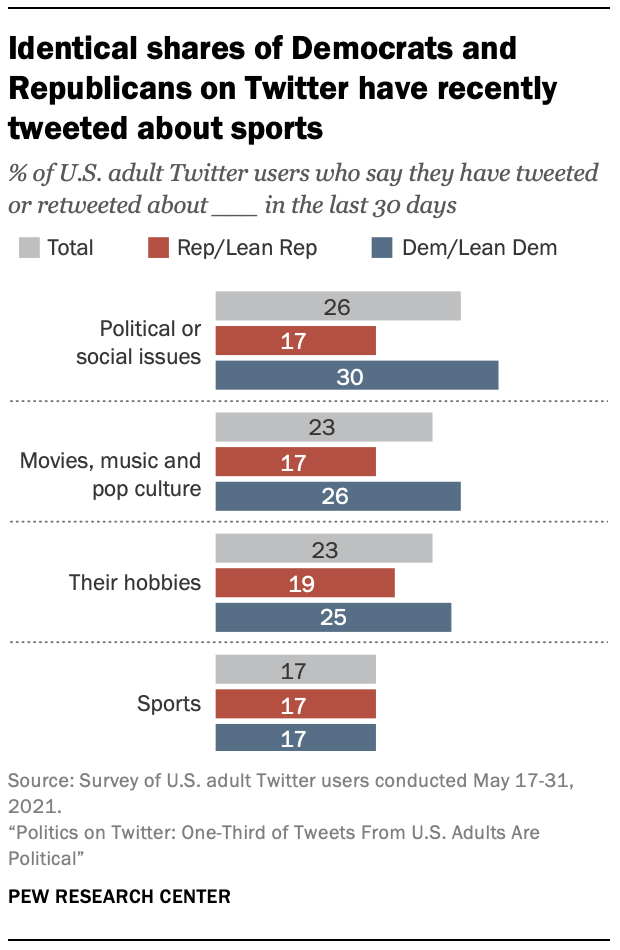
But some Twitter behaviors cross party lines. Notably, an identical share of Democrats and Republicans on Twitter (17%) say they tweeted about sports in the 30 days preceding the survey.
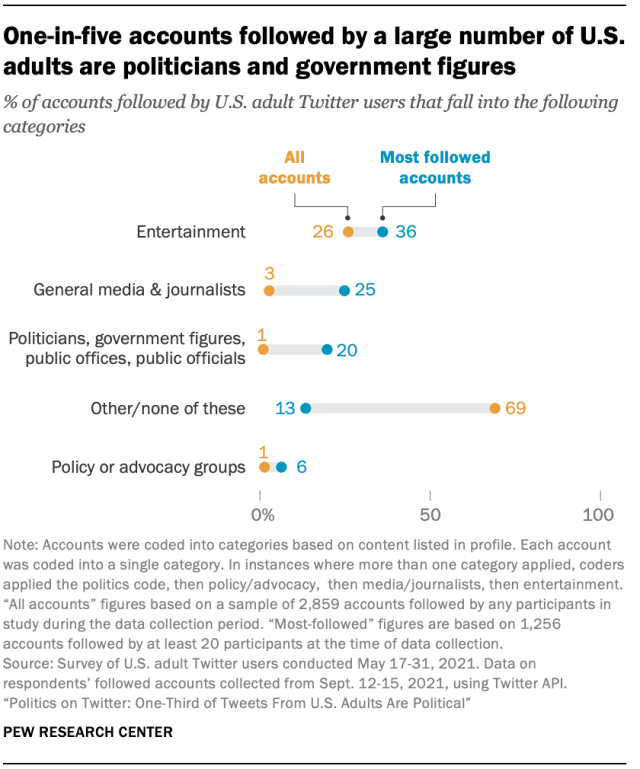
Chapter showing one-in-five accounts followed by a large number of U.S. adults are politicians and government figures

Political figures make up 20% of the accounts followed by a large number of U.S. adults. Politicians, government figures, public offices, and public officials make up just 1% of all the accounts followed by this representative sample of U.S. adult Twitter users. But these entities are far more prevalent among the most-followed accounts: Fully 20% of the accounts followed by at least 20 individual respondents fall into this category. Media organizations and journalists, as well as policy or advocacy organizations, are also notably more prevalent in the accounts that are widely followed by U.S. adults on Twitter.

“Twitter-only” political engagement is relatively rare. The Center’s survey asked about a variety of political behaviors that users might take, both on Twitter (such as tweeting about a political or social issue) and off (such as voting or contributing money to a campaign). The vast majority of Twitter users engaged in at least one of these activities in the preceding year. By far the largest share – 58% – engaged both on Twitter and elsewhere, and another 34% took part only in non-Twitter efforts. Just 3% of U.S. adult Twitter users say they took some sort of political or civic action on Twitter in the last year but did not do so outside the platform.

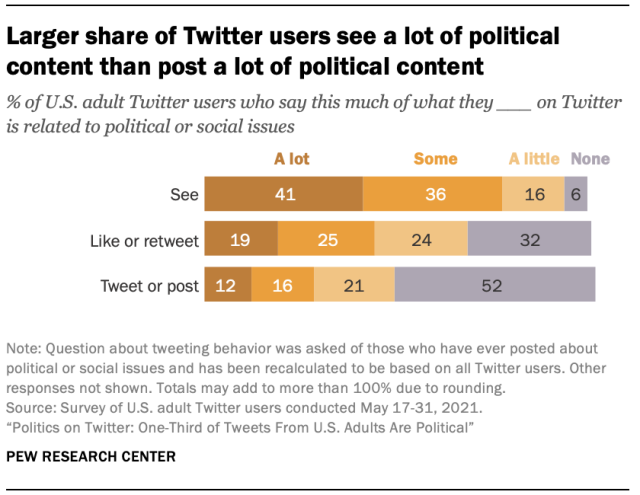
Users say political content makes up a larger share of what they see than of what they post. Some 41% of U.S. adult Twitter users say that a lot of what they see on Twitter is related to political or social issues. But just 12% say a lot of what they themselves post is related to these topics.
1. Survey findings on Twitter users’ political attitudes and experiences

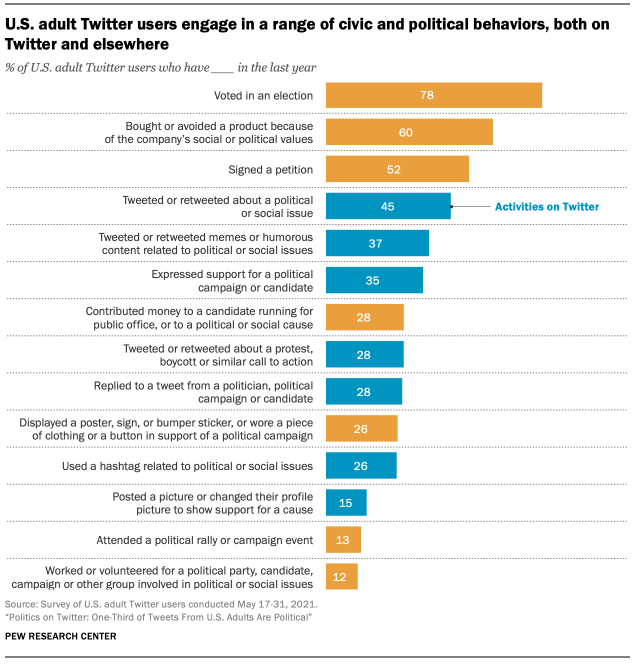
Twitter users report taking part in a variety of political and civic activities, both on Twitter and elsewhere. Of the 14 civic and political behaviors measured on the survey, a majority of Twitter users report that they voted in an election in the preceding year (78%), or that they bought – or avoided buying – a product because of the company’s social or political values (60%). Smaller shares attended a campaign event or rally (13%) or worked or volunteered for a political campaign or party (12%) over the same time frame. This survey was fielded in May 2021, so the preceding year included both the 2020 presidential election and the first year of the coronavirus pandemic.

When it comes to Twitter-specific activities, just under half of U.S. adult Twitter users (45%) report that they have tweeted about social or political issues in the last year. And around a third of users have used the platform in the last year to post humorous content or memes that touch on political issues (37%) or to express support for a political campaign or candidate (35%). 

All told, 61% of U.S. adults on Twitter took part in at least one of the seven different Twitter-specific political activities included in the survey. But just 3% say they engaged in one or more Twitter-specific actions but none of the other activities included in the survey; 58% say they engaged in actions both on Twitter and elsewhere. Meanwhile, 34% of users say they took part in civic or political activities somewhere other than Twitter, but not on the site itself.

Chart showing U.S. adult Twitter users engage in a range of civic and political behaviors, both on Twitter and elsewhere

Democrats on Twitter are more likely than Republicans to have recently tweeted about politics, pop culture, and hobbies – but not sports

Chart showing Identical shares of Democrats and Republicans on Twitter have recently tweeted about sports

When asked about the different types of content they might post about on the site, around one-quarter of U.S. adult Twitter users say they have tweeted or retweeted about political or social issues (26%); music, movies or pop culture (23%); or their hobbies (23%) in the past 30 days, with another 17% saying they have posted about sports during that same time frame. Half of these users say they have ever posted about pop culture or their hobbies, while 47% have ever posted about politics and 40% say they have ever posted about sports.

A significantly larger share of Democrats than Republicans say they have tweeted or retweeted about politics in the last 30 days (30% vs. 17%), with an especially large share of liberal Democrats (37%) saying they have done so. Democrats are also more likely than Republicans to say they have recently tweeted about pop culture or about their hobbies. But identical shares of Democrats and Republicans (17%) indicate they have tweeted about sports in the last 30 days.

Users say political content makes up a larger share of what they see than of what they post 

Some 41% of Twitter users report that a lot of what they see on Twitter is related to political or social issues. Another 36% say that some of what they see on the site relates to politics, and just 6% say that none of their feed is political in nature.

It is less common for these users to report engaging with political content in other ways. For instance, fewer than half of users say that a lot (19%) or some (25%) of what they like or retweet is related to politics, and 32% say none of their likes or retweets are political. 

Chart showing Larger share of Twitter users see a lot of political content than post a lot of political content

And an even smaller share of users say politics makes up a sizable share of what they themselves post on Twitter. Of the 53% of users who say they have ever tweeted about political issues, 23% say that a lot of what they tweet about is related to politics. That works out to just 12% of all U.S. adult Twitter users who say that they post a lot of content that they would categorize as political.  

Twitter users see the platform as more effective at raising awareness than at changing minds

Chart showing Larger share of Democrats on Twitter see the platform as effective at raising awareness about issues

As is true of public attitudes toward social media more broadly, Twitter users generally see the platform as an effective way to raise public awareness about political or social issues. Some 24% of Twitter users say the platform is a very effective way of doing this, and another 54% find it somewhat effective. Roughly one-third of liberal Democrats (32%) and 18- to-29-year-olds who use Twitter (33%) see the platform as very effective at raising public awareness about political and social issues.

Twitter users are somewhat less confident about whether the platform is effective at getting elected officials – as opposed to the public at large – to pay attention to issues. Around two-thirds of users think it is at least somewhat effective at this, but just 10% think it is very effective A larger share of Twitter users who are Black say the platform is very effective at raising awareness among public officials (20%) relative to White (8%) or Hispanic (10%) users.

And an even smaller share of users say Twitter is effective at encouraging other people to actually change their minds about political or social issues. Some 22% of users think it is very ineffective at this, roughly double the share who think it is very effective (9%). As with raising awareness among public officials, Black users see Twitter as a relatively effective way of changing minds. A majority of Black users (64%) find it at least somewhat effective in this regard, compared with 40% of White users and 46% of Hispanics.

U.S. adults on Twitter follow accounts and encounter posts that contain a mix of political beliefs

One-third of Democrats on Twitter say they disagree with few or none of the political tweets they see

When asked how many of the tweets they see contain political views or opinions they disagree with, a majority of Twitter users (57%) say they disagree with some of them. Around one quarter (28%) say they disagree with very few or none of them, while the remaining 14% disagree with almost all or most of the political views they see on the site.

Republican Twitter users are around twice as likely as Democrats to say they disagree with all or most of the political views they see on the site (19% vs. 10%). Conversely, Democrats are roughly twice as likely as Republicans to say they disagree with few or none of the political tweets they encounter (33% vs. 16%).When asked a similar question about the political leanings of the accounts they follow, the largest share of U.S. adults on Twitter say they follow mostly accounts with a mix of political beliefs (39%) or whose political beliefs they aren’t sure of (21%). By contrast, among those users who say they follow at least some politicians or government figures, a majority (58%) indicate that these figures tend to have political views that are similar to their own.1

As was true of the tweets they encounter, Democrats who use Twitter are more likely than Republicans to say the accounts they follow – whether accounts in general, or political and government figures specifically – have similar political beliefs to their own.

Chart showing larger share of Democrats than Republicans on Twitter follow people, politicians with similar political views to their own

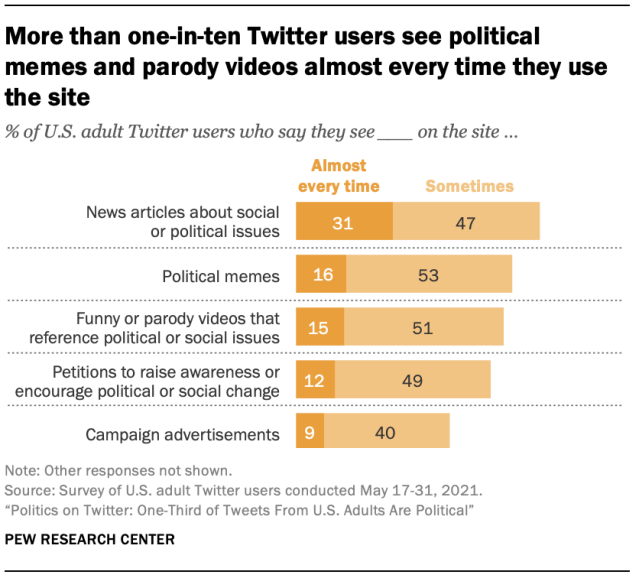
Roughly one-third of U.S. adult Twitter users see news articles about political or social issues almost every time they use the site

Chart showing More than one-in-ten Twitter users see political memes and parody videos almost every time they use the site

Twitter users say they see a variety of different types of political content there. Most prominently, 31% say they see news articles about political or social issues almost every time they use the site. And about half that share says they encounter political memes (16%) or humorous videos that reference political or social issues (15%) with similar frequency. And a majority of users say they see each of these types of content at least sometimes.

2. The political content in users’ tweets and the accounts they follow

In addition to surveying users about their experiences on Twitter, researchers from the Center also examined the actual on-site behaviors of a subset of users from this representative panel of U.S. adults who provided their Twitter handles for research purposes. This analysis involved two separate data collections and analyses.

First, researchers collected every public tweet posted by these users between May 1, 2020, and May 31, 2021. In total, this collection resulted in a total of 959,254 tweets (of any kind) from 942 users. Researchers then used a custom-trained machine learning classifier to estimate which of those nearly 1 million tweets were related to political content, such as officials and activists, social issues, or news and current events. 

Second, researchers collected profile information for all of the accounts followed by our panel and then manually categorized a sample of all the accounts followed by these users (2,859 accounts in total) as well as every account followed by 20 or more users (1,256 in total) into different account types.

One-third of posts from U.S. adults are estimated to be about politics

This analysis finds that a sizable share of the content posted by U.S. adult Twitter users is broadly political in nature. Of the nearly 1 million tweets examined in this analysis, 33% are estimated to include some form of political content. It also finds that political posting is fairly widespread across the Twitter population, as 65% of U.S. adults on Twitter posted or retweeted at least once about politics over the year under observation. 

At the same time, political posting is an infrequent practice for most users. The typical (median) U.S. adult Twitter user posted just three posts containing political content over the course of the year – or approximately one political tweet every four months.

This seeming contradiction – that a majority of American Twitter users have tweeted about politics, and political content makes up one-third of all tweets from this group, but most users only tweet about politics occasionally – is explained by the fact that most Americans on Twitter tweet rarely, if ever, about any topic. 

Conversely, a relatively small share of users tweet quite frequently. And as is the case of tweeting behavior more broadly, a minority of U.S. adult Twitter users produce the vast majority of political tweets. The Center’s analysis finds that a quarter of U.S. adults on Twitter produce 99% of all political tweets from this group.

Certain groups make an outsize contribution to the political discussion on Twitter

In the same way that a relatively small share of users produce a majority of political tweets from U.S. adults, certain demographic groups produce a larger share of political content on Twitter than others. Groups such as college graduates, Democrats and Democratic leaners, those ages 50 and older, and women each produce 70% or more of all tweets from U.S. adults mentioning politics or political issues.

In several cases, these groups that produce a majority of political tweets make up a large share of the U.S. adult Twitter population. For instance, the population of U.S. adults on Twitter contains a larger share of Democrats than Republicans. As a result, Democrats produce a larger share of political tweets than Republicans – even though political content makes up a comparable share of the tweets posted by a typical Democrat and a typical Republican.

In other cases, these groups simply produce a large number of tweets about any topic, whether those tweets are political or not. For instance, previous research from the Center has found that two-thirds of the most active tweeters among U.S. adults are women.

But neither of these is the case for those ages 50 and older, who contribute 78% of all political tweets from U.S. adults. These older users make up around one-quarter of all U.S. adult Twitter users, and produce roughly half (55%) of all tweets. But at the level of the average user, older adults are much more likely to tweet about politics than their younger counterparts. Political content makes up 36% of all tweets from the typical (median) U.S. adult Twitter user age 50 and older. That is roughly five times the share for the median 18- to 49-year-old, whose tweets are composed of just 7% political content.

Chart showing Older users produce roughly eight-in-ten tweets from U.S. adults on Twitter mentioning politics

Characteristics of the most active political tweeters

The most active political tweeters – defined in this analysis as those who posted more than 10 political tweets during the yearlong study period2 – are largely similar to other Twitter users in many of their basic demographic characteristics, such as educational attainment or party affiliation. However, there are prominent differences related to age: highly active political tweeters contain a larger share of users ages 50 and older (34%) compared with those who tweet less about politics (23%).

Chart showing The most active political tweeters are more politically engaged, but don’t think Twitter changes minds

These highly active political tweeters are more likely than other U.S. adults on Twitter to participate in a variety of political and civic activities at higher rates, both on Twitter and offline. Compared with those who 

tweet less about politics, a larger share say they have contributed financially to a political campaign or cause (46% vs. 21%) or have volunteered for a campaign or cause (20% vs. 8%). Additionally, larger shares say they primarily use Twitter to express their opinions, discuss politics with others at least weekly, or get news on Twitter.

At the same time, higher- and lower-volume political tweeters do not differ when it comes to some views about Twitter as a vehicle for political engagement. Similar shares of each group say Twitter is mostly a good thing for American democracy, or that the platform is at least somewhat effective at raising public awareness of political and social issues. And those who tweet about politics the most are actually less likely to think that Twitter is at least somewhat effective at changing people’s minds about political or social issues: 34% say this, compared with half (50%) of those who tweet less about politics.

Politicians and government figures are rare among all accounts followed by U.S. adults on Twitter, but much more common among the most-followed accounts

Twitter users follow a vast array of accounts: The 899 users in this sample collectively followed 502,475 accounts at the time of analysis.3 Very few of these accounts belong to people or entities directly related to politics or news media. Just 1% of these accounts belong to politicians, government figures or public offices, an identical share belong to policy or advocacy organizations, and another 3% belong to media outlets or journalists. Of the four categories researchers coded for this analysis, the largest share of accounts (26%) belong to the entertainment category. 

But the bulk of these accounts (69%) belong to none of the categories coded by the Center. These accounts encompass a wide range of personal and professional affiliations and often defy easy categorization. But they generally are followed by a relatively small number of other accounts, and few are verified by Twitter.

However, political figures make up a much larger share of the accounts followed by large numbers of U.S. adult Twitter users. Among accounts followed by at least 20 Twitter users in our sample, 20% are governmental or political in nature accounts and another 25% are media outlets or journalists. These popular accounts also contain a larger share of policy or advocacy groups (6%) than the broader sample of accounts. As is true of accounts as a whole, entertainment is the most common category – accounting 36% of this group. But just 13% of accounts in this group do not fall into one of these four categories.

Acknowledgments

This report is a collaborative effort based on the input and analysis of the following individuals. 

Primary Researchers           

Sam Bestvater, Computational Social Scientist
Sono Shah, Computational Social Scientist
Gonzalo Rivero, Associate Director, Data Labs                                
Aaron Smith, Director, Data Labs

Research Team         

Ashley Amaya, Senior Survey Methodologist
Nick Bertoni, Senior Panel Manager
Brian Broderick, Data Science Engineer
Athena Chapekis, Data Science Assistant
Arnold Lau, Research Methodologist
Colleen McClain, Research Associate
Andrew Mercer, Senior Research Methodologist
Meltem Odabaş, Computational Social Scientist
Emma Remy, Data Science Analyst
Regina Widjaya, Computational Social Scientist

Editorial and Graphic Design          

Alissa Scheller, Information Graphics Designer
Travis Mitchell, Copy Editor, Digital Producer

Communications and Web Publishing

Andrew Grant, Communications Associate
Travis Mitchell, Copy Editor, Digital Producer
Rachel Weisel, Associate Director, Communications

Methodology

The American Trends Panel survey methodology

Overview

The American Trends Panel (ATP), created by Pew Research Center, is a nationally representative panel of randomly selected U.S. adults. Panelists participate via self-administered web surveys. Panelists who do not have internet access at home are provided with a tablet and wireless internet connection. Interviews are conducted in both English and Spanish. The panel is being managed by Ipsos.

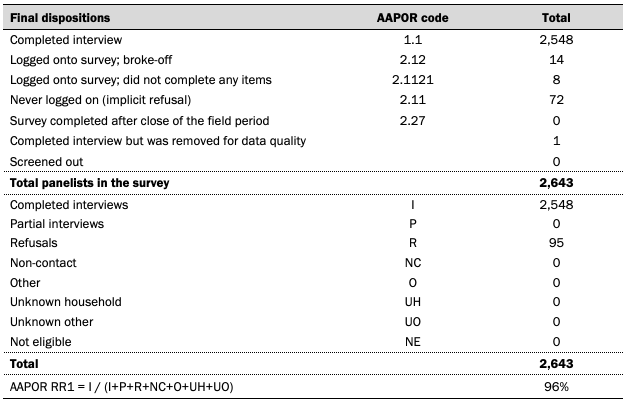
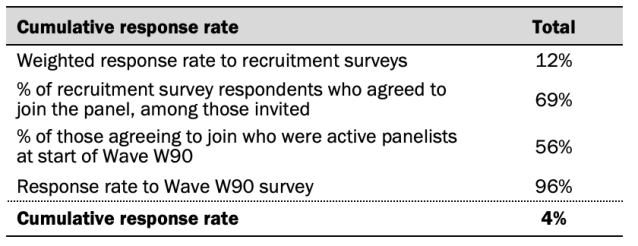
Data in this report is drawn from ATP panel Wave 85 conducted May 17 to May 31, 2021. The sample is comprised of panelists who indicated on the survey that they use Twitter. A total of 2,548 panelists responded out of 2,643 who were sampled, for a response rate of 96%. The cumulative response rate accounting for nonresponse to the recruitment surveys and attrition is 4%. The break-off rate among panelists who logged on to the survey and completed at least one item is less than 1%. The margin of sampling error for the full sample of 2,548 respondents is plus or minus 3.4 percentage points. 

Panel recruitment

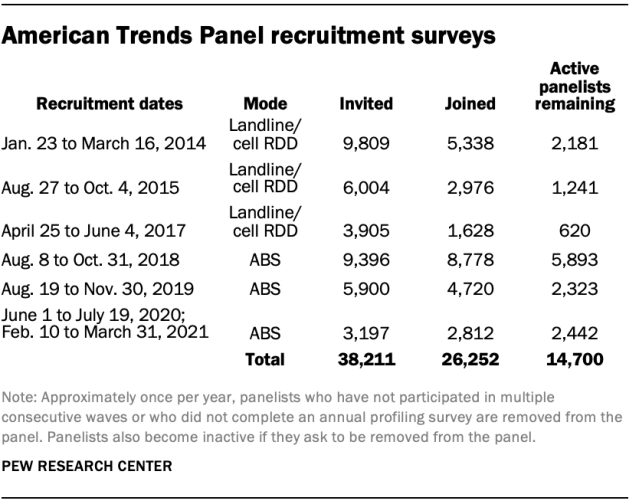
Chart showing American Trends Panel recruitment surveys

The ATP was created in 2014, with the first cohort of panelists invited to join the panel at the end of a large, national, landline and cellphone random-digit-dial survey that was conducted in both English and Spanish. Two additional recruitments were conducted using the same method in 2015 and 2017, respectively. Across these three surveys, a total of 19,718 adults were invited to join the ATP, of whom 9,942 (50%) agreed to participate.

In August 2018, the ATP switched from telephone to address-based recruitment. Invitations were sent to a random, address-based sample of households selected from the U.S. Postal Service’s Delivery Sequence File. Two additional recruitments were conducted using the same method in 2019 and 2020, respectively. Across these three address-based recruitments, a total of 18,493 adults were invited to join the ATP, of whom 16,310 (88%) agreed to join the panel and completed an initial profile survey. In each household, the adult with the next birthday was asked to go online to complete a survey, at the end of which they were invited to join the panel. Of the 26,252 individuals who have ever joined the ATP, 14,700 remained active panelists and continued to receive survey invitations at the time this survey was conducted.

The U.S. Postal Service’s Delivery Sequence File has been estimated to cover as much as 98% of the population, although some studies suggest that the coverage could be in the low 90% range.4 The American Trends Panel never uses breakout routers or chains that direct respondents to additional surveys.

Sample design

The overall target population for this survey was Twitter users ages 18 and older, living in the U.S., including Alaska and Hawaii. The sample consisted of 2,643 panelists who indicated that they use Twitter on the Wave 85 survey conducted on the ATP in March 2021.

Questionnaire development and testing

The questionnaire was developed by Pew Research Center in consultation with Ipsos. The web program was rigorously tested on both PC and mobile devices by the Ipsos project management team and Pew Research Center researchers. The Ipsos project management team also populated test data which was analyzed in SPSS to ensure the logic and randomizations were working as intended before launching the survey. 

Incentives

All respondents were offered a post-paid incentive for their participation. Respondents could choose to receive the post-paid incentive in the form of a check or a gift code to Amazon.com or could choose to decline the incentive. Incentive amounts ranged from $5 to $20 depending on whether the respondent belongs to a part of the population that is harder or easier to reach. Differential incentive amounts were designed to increase panel survey participation among groups that traditionally have low survey response propensities.

Data collection protocol

The data collection field period for this survey was May 17 to May 31, 2021. Postcard notifications were mailed to all ATP panelists with a known residential address on May 17, 2021.  

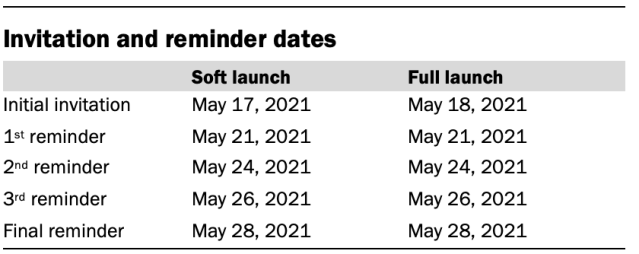
Invitations were sent out in two separate launches: Soft launch and full launch. Sixty panelists were included in the soft launch, which began with an initial invitation sent on May 17, 2021. The ATP panelists chosen for the initial soft launch were known responders who had completed previous ATP surveys within one day of receiving their invitation. All remaining English- and Spanish-speaking panelists were included in the full launch and were sent an invitation on May 18, 2021.

All panelists with an email address received an email invitation and up to four email reminders if they did not respond to the survey. All ATP panelists that consented to SMS messages received an SMS invitation and up to four SMS reminders. 

Chart showing Invitation and reminder dates

Data quality checks

To ensure high-quality data, the Center’s researchers performed data quality checks to identify any respondents showing clear patterns of satisficing. This includes checking for very high rates of leaving questions blank, as well as always selecting the first or last answer presented. As a result of this checking, one ATP respondent was removed from the survey dataset prior to weighting and analysis. 

Weighting

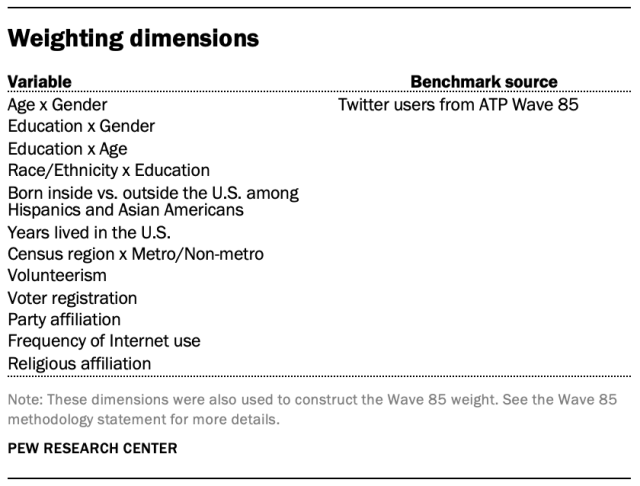
Chart showing weighting dimensions

The ATP data was weighted in a multistep process that accounts for multiple stages of sampling and nonresponse that occur at different points in the survey process. First, each panelist begins with a base weight that reflects their probability of selection for their initial recruitment survey (and the probability of being invited to participate in the panel in cases where only a subsample of respondents were invited). The base weights for panelists recruited in different years are scaled to be proportionate to the effective sample size for all active panelists in their cohort. To correct for nonresponse to the initial recruitment surveys and gradual panel attrition, the base weights for all active panelists are calibrated to align with the population benchmarks identified in the accompanying table to create a full-panel weight. 

For ATP waves in which only a subsample of panelists are invited to participate, a wave-specific base weight is created by adjusting the full-panel weights for subsampled panelists to account for any differential probabilities of selection for the particular panel wave. For waves in which all active panelists are invited to participate, the wave-specific base weight is identical to the full-panel weight.

In the final weighting step, the wave-specific base weights for panelists who completed the survey are again calibrated to match the population benchmarks specified above. These weights are trimmed (typically at about the 1st and 99th percentiles) to reduce the loss in precision stemming from variance in the weights. Sampling errors and test of statistical significance take into account the effect of weighting. 

For this wave, the sample was weighted to align with benchmarks that were estimated among all Twitter users who responded to Wave 85.

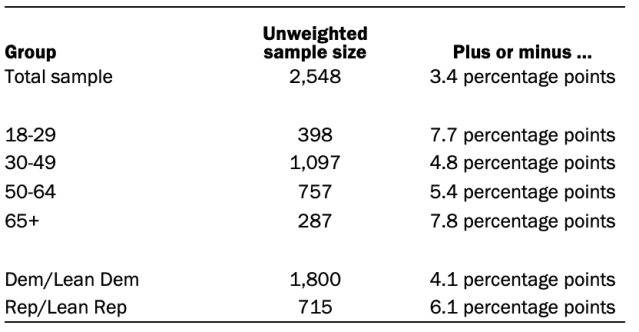
The following table shows the unweighted sample sizes and the error attributable to sampling that would be expected at the 95% level of confidence for different groups in the survey. 

Chart showing the unweighted sample sizes and the error attributable to sampling that would be expected at the 95% level of confidence for different groups in the survey

Sample sizes and sampling errors for other subgroups are available upon request. In addition to sampling error, one should bear in mind that question wording and practical difficulties in conducting surveys can introduce error or bias into the findings of opinion polls.

Dispositions and response rates

Chart showing Dispositions and response rates
Chart showing Cumulative response rate

Analysis of Twitter behavioral data 

The analysis of Twitter users’ behaviors and activities on the site is based on a subsample of 1,026 respondents to the main survey who had previously agreed to share their Twitter handle for research purposes and provided a valid handle. Researchers from the Center used these handles to collect information about their on-site behaviors using the Twitter API. 

The handles for these respondents were initially collected in a previous wave of the ATP fielded March 8 to March 14, 2021. These respondents were then included in the subsequent survey of all Twitter users that the main analysis in this report is based on.

Of the 2,548 adults who completed this survey, 1,099 (43%) had previously agreed to provide their Twitter handle. After the survey was fielded, researchers reviewed each account individually and removed any accounts that were suspended, invalid, or that belonged to institutions, products or international entities. The analysis of Twitter behavioral data in this report is based on the 1,026 respondents who both completed the survey and provided a valid, active handle. 

This final sample of 1,026 U.S. adult Twitter users with valid, active handles was weighted using an iterative technique that matches gender, age, race, place of birth among Hispanics and Asian Americans, years lived in the U.S., education, region, party identification, volunteerism, voter registration, and metropolitan area to American Trends Panel March 2021 (Wave 85) survey respondents who indicated in that survey that they use Twitter. The margin of error for the full sample is plus or minus 6 percentage points.

Collecting tweets from survey respondents

The findings in this report that examine users’ patterns of political posting and engagement are based on tweets produced by respondents whose accounts were set to public during the time period of May 1, 2020, to May 31, 2021. All tweets posted by these public accounts during this timeframe were collected using the Twitter API, resulting in a total of 959,254 original tweets, replies, quote tweets, and retweets from 942 users.

Identifying political tweets from our sample of users

To identify which tweets featured political content, researchers from the Center used a custom-trained machine learning classifier. This model was fine-tuned on a training set of 6,413 tweets that had been hand coded according to whether or not they referred to political content such as officials and activists, social issues, or news and current events.

To increase the model’s generalizability, the training data used was posted by users not in the American Trends Panel. This training set was selected by randomly sampling tweets from the Twitter Powertrack historical search API, filtered to posts originating from within the United States during the period between May 2020 and May 2021. These 6,413 sampled tweets were then labeled by a team of seven annotators (Krippendorff’s alpha = 0.76) for the presence or absence of recognizable political content, using the following codebook:

Political content on Twitter is varied, and can be about officials and activists, social issues, or news and current events.

Looking at the tweet displayed here, would you categorize it as POLITICAL or NOT POLTICAL content?

Pick what you think is the best option, even if you’re not entirely sure.

Where multiple coders disagreed on the appropriate label for a tweet, the ultimate label was decided using a modified Dawid-Skene aggregation model.5

Using this training set, researchers then fine-tuned a machine learning model, based on the DistilRoBERTa architecture in the Transformers library for Python. While the training data came from outside the American Trends Panel, the trained model was validated against a test set of 1,082 tweets sampled from the 959,254 tweets that were posted by the respondents who volunteered a handle for this study. The tweets in this test set were each coded for political content by three human annotators (Krippendorff’s alpha = 0.82), with labels decided by majority rule in the case of disagreement. Evaluated against this test set, the trained model achieved an accuracy score of 0.88 and an F1 score of 0.91. 

Once trained, this model was used to categorize all remaining uncoded tweets for the presence or absence of political content. The study excluded non-English tweets.

Classifying the accounts our panelists follow

The analysis of the account’s respondents follow is based on a snapshot of the following relationships for 899 Twitter accounts belonging to survey respondents who volunteered a handle for research, whose handle was valid and active as of the study period, and who followed at least one account between Sept. 12, 2021, to Sept. 15, 2021. This list yielded a total of 502,475 accounts that our respondents followed at that time. 

Researchers drew a random sample of 2,859 accounts stratified by the number of ATP respondents that follow them. Next, researchers identified 1,256 accounts followed by 20 or more ATP respondents. Researchers used a script to take screenshots of each sampled account’s Twitter profile. These profile screenshots were coded by six researchers after achieving an average pairwise agreement of 0.92 and Krippendorff’s alpha of 0.84 on a separate validation sample of 100 account screenshots.  The screenshots of the accounts that were followed by 20 or more respondents were taken on May 3, 2022. This second set of screenshots was coded by four of the six researchers. 

To categorize the accounts into substantive groups researchers developed a codebook consisting of five distinct categories. Coders were instructed to only use the information in the screenshot of the account when choosing a category. In cases in which an account fit multiple categories, coders were instructed to choose the first category that applied (in the order in which they are listed below). 

The codebook included categories for the following types of accounts:

  • Politicians, government figures, public offices, public officials (includes, federal, state, local agencies)  
    • Definition: Accounts belonging to politicians, government figures (e.g. Secretary of Transportation, Director of Health and Human Services), public offices (e.g. the White House, the Department of Justice), public officials, federal/state/local agencies.  
    • Note: Coders were allowed to consider former affiliations for this category if present, but not any others.
  • Policy or advocacy  
    • Definition: This includes organizations that take positions on policy areas or issue areas as well as individuals who hold leadership positions in those organizations 
  • General media and journalists
    • Definition: This includes news organizations, as well as individuals that indicate they say they are primarily a journalist, or they say they work for a news organization.  
  • Entertainment
    • Definition: This includes accounts that belong to people or organizations that work, cover, or are a dedicated fan of any of the following areas: music, sports, movies, TV, architecture, visual arts, literary arts, performing arts, and fashion, food
      • Can include: books, games, fashion, photography, fine arts, architecture, poetry, dance, theater, stand-up comedy 
  • Other/none of the above
    • Definition: This would include accounts that do not fit in any of the ones listed above

Question wording and respondent consent language for collection of Twitter handles

Respondents were asked to provide their Twitter handles for research purposes using the following language:

In many of our surveys, we ask about how people like you use social media. But there’s a lot we cannot learn unless you allow us to connect information about your public Twitter behavior to your answers.

No matter how often you use Twitter, would you be willing to share your Twitter handle to help us with this research?

  •       1          Yes
  •       2          No

This project will ONLY collect information that an ordinary user would see when they visit your profile. We will treat this data just like we treat your survey responses and will NEVER share anything that can be linked back to you.

How we will use your Twitter handle

If you provide us with your Twitter handle, we will only be able to collect what an ordinary user would see when visiting your profile. The specific information we will have access to depends on the privacy settings of your Twitter account.

If your account is set to PUBLIC, we will be able to see the accounts you follow; the accounts that follow you; the text of any tweets you have posted; and basic information in your profile, such as your description and the age of your account. We will NOT have access to any private messages you have sent or received.

If your account is set to PRIVATE, we will be able to see how many accounts you follow or how many times you have tweeted – but will NOT be able to see any private messages you have sent or received; the actual content of your tweets; or the names of the accounts you follow or that follow you.

We expect that this research will be concluded in approximately 18 months. At that point we will ask you again whether or not you would like to provide your handle. If you provided your Twitter handle to us previously, that is why you are seeing this question again.

If at any point you wish to opt out of research related to your Twitter account, contact info@americantrendspanel.org. For more information about our privacy practices, please see our Privacy Policy.