Pew Research Center

FOR RELEASE JUNE 6, 2022

Americans’ Views of Government: Decades of Distrust, Enduring Support for Its Role

65% say most political candidates run for office 'to serve their own personal interests'

FOR MEDIA OR OTHER INQUIRIES:

Communications Department
202.419.4372
www.pewresearch.org

RECOMMENDED CITATION

Pew Research Center, June 2022, "Americans’ Views of Government: Decades of Distrust, Enduring Support for Its Role"

About Pew Research Center

Pew Research Center is a nonpartisan, nonadvocacy fact tank that informs the public about the issues, attitudes and trends shaping the world. It does not take policy positions. The Center conducts public opinion polling, demographic research, computational social science research and other data-driven research. It studies politics and policy; news habits and media; the internet and technology; religion; race and ethnicity; international affairs; social, demographic and economic trends; science; research methodology and data science; and immigration and migration. Pew Research Center is a subsidiary of The Pew Charitable Trusts, its primary funder.

© Pew Research Center 2026

Table of contents

  • About Pew Research Center
  • Americans’ Views of Government: Decades of Distrust, Enduring Support for Its Role
  • 1. Public trust in government
  • 2. Public views about the federal government
  • 3. Federal government: Performance and role
  • 4. Levels of government: Federal, state, local
  • 5. Values and expectations of government
  • 6. The people of government: Career employees, political appointees and candidates for office
  • 7. Views about the state of the nation
  • Acknowledgments
  • Methodology

Americans’ Views of Government: Decades of Distrust, Enduring Support for Its Role

65% say most political candidates run for office 'to serve their own personal interests'

How we did this

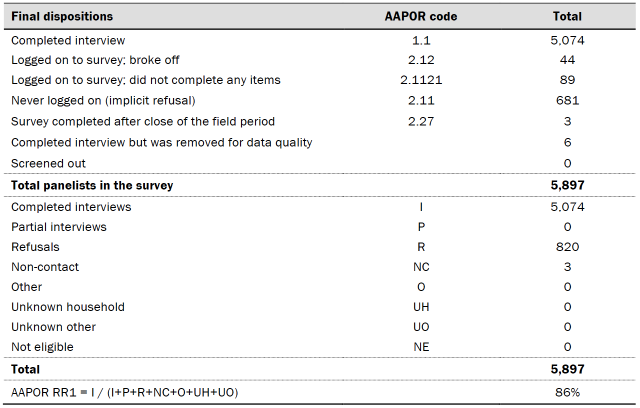
Pew Research Center conducted this study to better understand Americans’ attitudes about U.S. government. For this analysis, we surveyed 5,074 U.S. adults in April and May 2022. Everyone who took part in this survey is a member of the Center’s American Trends Panel (ATP), an online survey panel that is recruited through national, random sampling of residential addresses. This way nearly all U.S. adults have a chance of selection. The survey is weighted to be representative of the U.S. adult population by gender, race, ethnicity, partisan affiliation, education and other categories. Read more about the ATP’s methodology.

Here are the questions used for the report, along with responses, and its methodology.

Americans remain deeply distrustful of and dissatisfied with their government. Just 20% say they trust the government in Washington to do the right thing just about always or most of the time – a sentiment that has changed very little since former President George W. Bush’s second term in office.
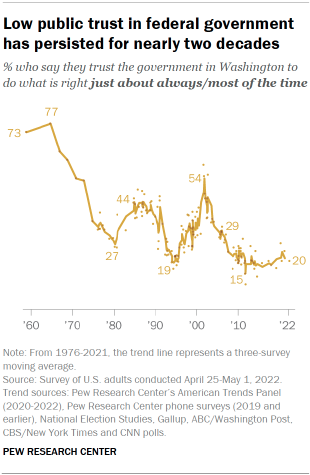
Chart shows low public trust in federal government has persisted for nearly two decades

The public’s criticisms of the federal government are many and varied. Some are familiar: Just 6% say the phrase “careful with taxpayer money” describes the federal government extremely or very well; another 21% say this describes the government somewhat well. A comparably small share (only 8%) describes the government as being responsive to the needs of ordinary Americans.

The federal government gets mixed ratings for its handling of specific issues. Evaluations are highly positive in some respects, including for responding to natural disasters (70% say the government does a good job of this) and keeping the country safe from terrorism (68%). However, only about a quarter of Americans say the government has done a good job managing the immigration system and helping people get out of poverty (24% each). And the share giving the government a positive rating for strengthening the economy has declined 17 percentage points since 2020, from 54% to 37%.

Yet Americans’ unhappiness with government has long coexisted with their continued support for government having a substantial role in many realms. And when asked how much the federal government does to address the concerns of various groups in the United States, there is a widespread belief that it does too little on issues affecting many of the groups asked about, including middle-income people (69%), those with lower incomes (66%) and retired people (65%).

Chart shows majorities of Americans say federal government does too little to address issues affecting several groups, including lower- and middle-income people, retirees

Among 11 groups included in the survey, the only group about which a majority of adults (61%) say the government does too much for are high-income people.

Republicans and Democrats generally agree that the government does too little regarding issues of concern for several groups, including retirees, rural residents, suburbanites and middle-income people. And nearly identical shares of both Republicans and independents who lean toward the Republican Party (52%) and Democrats and Democratic leaners (56%) say it does too little on issues affecting “people like you.”

However, Democrats are more likely than Republicans to say the government does too little on issues impacting children (63% of Democrats vs. 44% of Republicans) and parents (49% vs. 41%). And while 43% of Democrats say the federal government does too little on issues affecting people in cities, just 27% of Republicans say the same. Democrats (79%) also are considerably more likely than Republicans (50%) to say the government does too little to address issues facing lower-income people.

Chart shows broad public support for the federal government having a ‘major role’ in many different areas

The public’s attitudes on the overall size and scope of government – and whether the government should have a “major role” in specific issue areas – have changed little in recent years. Clear majorities of Americans (60% or more) say the government should have a major role in 11 of 12 issue domains included in the new survey – including terrorism, immigration and the economy, as well as ensuring access to health care and protecting the environment. The only exception is for helping people out of poverty (52% say it should have a major role).

Republicans are less likely than Democrats to favor a major role for government in most areas; this is especially – and increasingly – the case for alleviating poverty. Still, majorities of Republicans favor a major role for government in eight of the 12 areas. Majorities of Democrats say the government should have a major role in all 12.

These are among the findings from a new Pew Research Center survey conducted April 25-May 1, 2022, among 5,074 U.S. adults on the Center’s nationally representative Americans Trends Panel. The study builds upon the Center’s previous reports about the government’s role and performance, most recently published in 2020 and 2017.

As in the past, state and local governments are viewed more favorably than the federal government. Yet amid controversies over state policies on issues ranging from abortion to the textbooks used in public schools, the relationship between the federal government and state governments has raised a number of differing concerns among the public. (Note: This survey was conducted before the leak of a draft opinion from the Supreme Court indicating that the court is likely to overturn the Roe v. Wade decision, which guarantees access to abortion. For more on public attitudes toward abortion, see “America’s Abortion Quandary”).
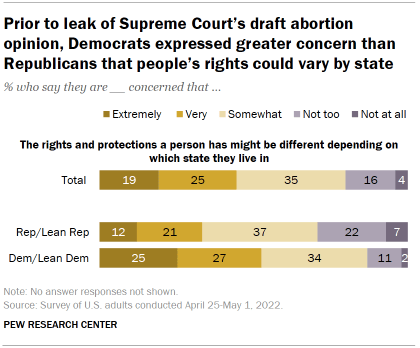
Chart shows prior to leak of Supreme Court’s draft abortion opinion, Democrats expressed greater concern than Republicans that people’s rights could vary by state

About a third of Americans (34%) are extremely or very concerned that the federal government is doing too much on issues better left to state governments; another 35% are somewhat concerned about this. An identical share expresses an entirely different concern – that state governments are not willing enough to work with the federal government (34% say they are extremely or very concerned about this).

Republicans (54%) are far more likely than Democrats (18%) to say they are extremely or very concerned that the federal government is doing too much on issues better left to the states. Democrats are more likely to say they are extremely or very concerned about states being uncooperative with the federal government (48% vs. 18%).

Moreover, about half of Democrats (53%) say they are extremely or very concerned that an individual’s rights and protections may vary depending on the state in which they live. By contrast, a smaller share of Republicans (33%) have a similar level of concern that a person’s rights may vary by state.

Other important findings

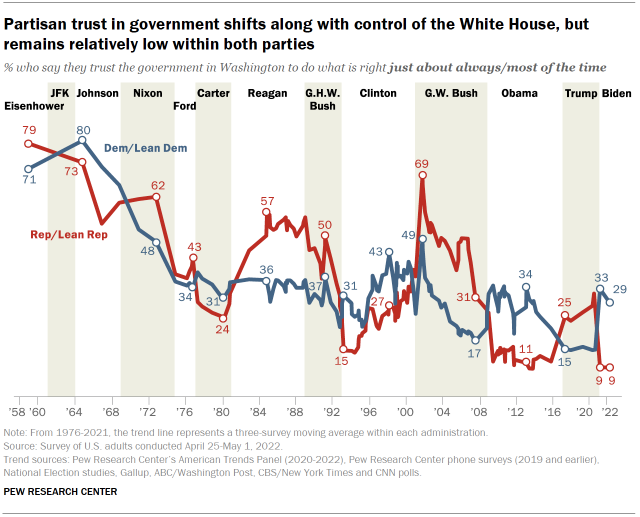
Low trust in government among members of both parties. As in the past, trust in government is higher among the party of the president than among the “out” party; still, only 29% of Democrats and just 9% of Republicans say they trust the government just about always or most of the time. The share of Republicans expressing trust in the federal government is currently as low as it has been at any point in the last 60 years; levels of trust among Democrats reached historic lows during George W. Bush’s and Donald Trump’s presidencies. (For more, see this interactive on public trust in government, 1958-2022.)

In their own words – how people feel about government performance. When asked to name, in their own words, areas where the federal government is doing a bad job, people cite a number of issues, including taxes and spending, immigration (with some specifically citing the situation at the U.S.-Mexico border) and social welfare programs. When asked about where the government is doing a good job, people also cite multiple issues; national security and foreign policy are mentioned most often.
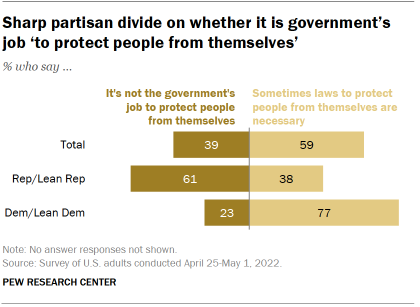
Chart shows sharp partisan divide on whether it is government’s job ‘to protect people from themselves’

Most say laws are needed to protect people from themselves. Republicans and Democrats have fundamental differences of opinion about the government’s role in protecting Americans. Among the public overall, 59% say that sometimes laws are needed to protect people from themselves; 39% say it is not the government’s job to protect people from themselves. A 61% majority of Republicans say it’s not the government’s job to protect people from themselves; an even larger majority of Democrats (77%) say laws are sometime needed for that purpose.
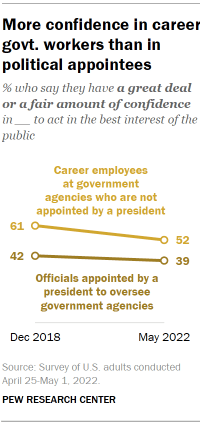
Chart shows more confidence in career govt. workers than in political appointees

Declining confidence in career government employees. A larger share of adults say they have a great deal or fair amount of confidence in career employees at federal agencies (52%) than in officials appointed by the president to oversee agencies (39%). However, the share expressing confidence in career employees has declined 9 points since 2018; there has been less change in confidence in political appointees.

Political candidates seen as motivated by their own interests, less by serving their communities. As the 2022 political campaigns heat up, 65% of adults – including nearly identical shares in both parties – say that all (15%) or most people (50%) who seek office at the local, state or federal level do so to serve their own personal interests. By contrast, just 21% say all or most people who run for office do so in order to serve their communities.

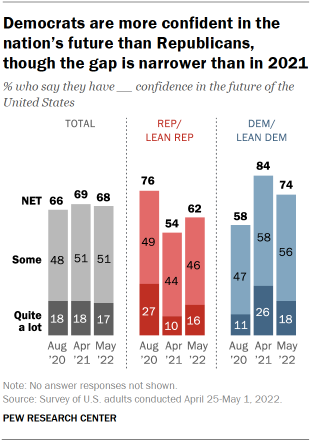
Most Americans have at least some confidence in nation’s future. Only about a quarter of adults (24%) say they are satisfied with the current state of the nation, and the public views a number of problems – especially inflation – as serious. Yet a majority of Americans continue to say they have a lot (17%) or some (51%) confidence in the future of the United States. These views have changed little since 2021.
1. Public trust in government

Today, two-in-ten Americans say they trust the government in Washington to do what is right just about always (2%) or most of the time (19%).

Trust in government has remained at roughly this low level for more than a decade. Since the 2007-2008 financial crisis, no more than about a quarter of Americans have expressed trust in the federal government to do what is right all or most of the time.

Chart shows partisan trust in government shifts along with control of the White House, but remains relatively low within both parties

Among Democrats and independents who lean toward the Democratic Party, 29% now say they trust the federal government just about always or most of the time, down slightly since 2021. Only about one-in-ten Republicans and GOP leaners say they trust the government in Washington to do what is right just about always or most of the time, also unchanged since the beginning of the Biden administration.
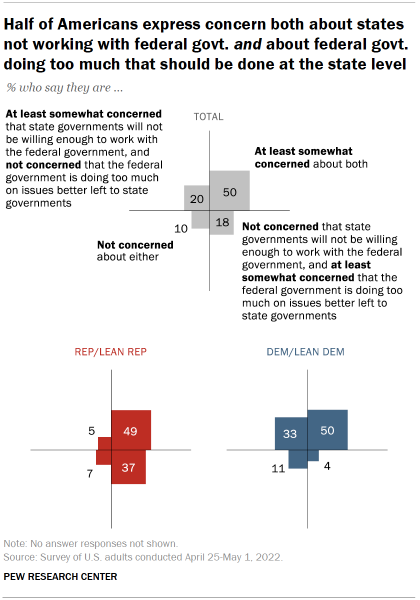
Chart shows most continue to express frustration – rather than anger or contentment – about the federal government

By comparison, Republicans were more trusting of the federal government than Democrats during Donald Trump’s presidency. Overall, partisans have tended to express higher levels of trust in government when a president of their party holds the White House. GOP levels of trust in government today are near an all-time low.

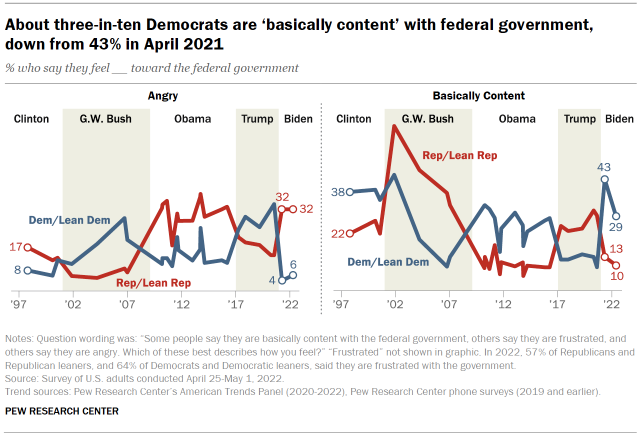
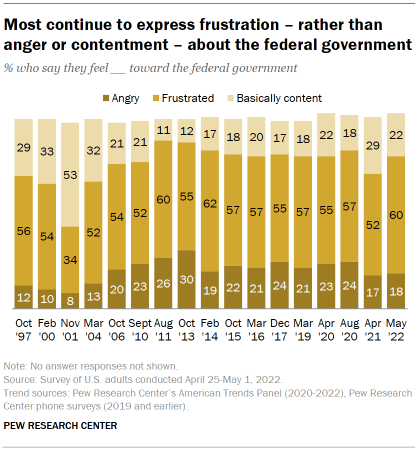
As has been the case for more than a decade, a majority of Americans say they feel frustrated with the federal government: 60% say this today, while 22% say they are basically content and 18% say they are angry.

Overall anger at government is little changed over the last year, and slightly lower than it was throughout the Trump administration. About two-in-ten have expressed contentment with the federal government for much of the last eight years (though contentment was somewhat higher in April 2021, when 29% of U.S. adults said they were basically content with the federal government).

Among Democrats, the share who say they are basically content with the federal government has decreased by 14 percentage points in the past year, from 43% to 29%, putting it roughly on par with Democratic views about the federal government throughout Barack Obama’s administration. The share of Democrats saying they are frustrated has increased since last year from 52% to 64%; just 6% now say they are angry with the federal government, up slightly from last year when 4% said this. But Democratic anger with the federal government remains substantially lower than it was during Donald Trump’s presidency and is slightly lower than it was throughout Obama’s administration.

About a third of Republicans (32%) report being angry at the federal government, identical to the share who said this a year ago. The shares who say they are basically content (10%) or frustrated (57%) are also similar to what they were a year ago (13% content, 55% frustrated).

Chart shows about three-in-ten Democrats are ‘basically content’ with federal government, down from 43% in April 2021

Age differences in distrust of the federal government

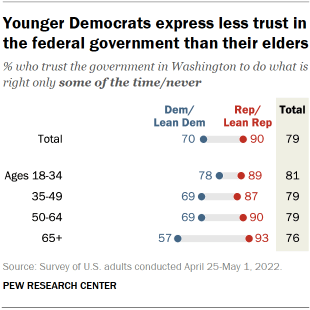
Nearly identical shares of adults across age groups say they trust the federal government to do what is right only some of the time or never, with 80% of adults under age 50 and 78% of adults ages 50 and older saying this. Older and younger Democrats, however, express different levels of trust in the government in Washington to do what is right.

Chart shows younger Democrats express less trust in the federal government than their elders

Among Democrats ages 65 and older, 57% say they trust the government to do what is right only some of the time or never. By comparison, about seven-in-ten Democrats ages 35 to 49 (72%) and ages 50 to 64 (69%) say the same, as do 78% of Democrats ages 18 to 34.

In contrast, there are no substantial age differences in trust in government among Republicans. Still, despite these sizable differences among Democrats, Democrats of all ages are more trusting of government than Republicans: About nine-in-ten Republicans in each of these four age groups say they trust the government in Washington to do what is right only some of the time or never.

2. Public views about the federal government

Asked about some descriptions of the federal government, relatively small shares of Americans say they think of the federal government as responsive to the needs of ordinary Americans, being careful with taxpayer money, or being able to address new problems as they come up. No more than one-in-ten say each of these phrases describe the federal government very or extremely well, and less than half say they describe the federal government even “somewhat” well. Majorities say these are not too, or not at all, good descriptors of the federal government.

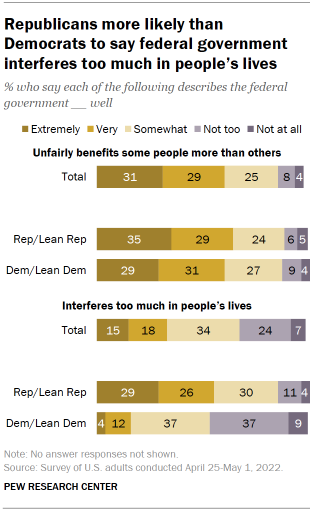
By comparison, about six-in-ten Americans say the phrase “unfairly benefits some people more than others” describes the federal government extremely well (31%) or very well (29%), and another quarter say it describes the government somewhat well.

The public’s views are more mixed when it comes to whether the government “interferes too much in people’s lives.” A third say that this phrase describes the federal government extremely (15%) or very well (18%); 34% say it describes the government somewhat well, while about three-in-ten say it describes the government not too (24%) or not at all (7%) well.

Chart shows Republicans more likely than Democrats to say federal government interferes too much in people’s lives

There are only modest partisan differences in views of whether the federal government unfairly benefits some people more than others. Republicans and independents who lean toward the Republican Party are somewhat more likely than Democrats and Democratic leaners to say this phrase describes the government extremely well (35% vs. 29%), but about six-in-ten in both partisan groups say it describes the federal government very or extremely well. Only about one-in-ten in either party say it is not too or not at all a good descriptor of the federal government.

The partisan divide is much larger on the question of whether government “interferes too much in people’s lives.” A majority of Republicans (55%) say this phrase describes the federal government very or extremely well, compared with 17% of Democrats. And about half of Democrats (53%) say this describes the government at least somewhat well, while 84% of Republicans say the same.

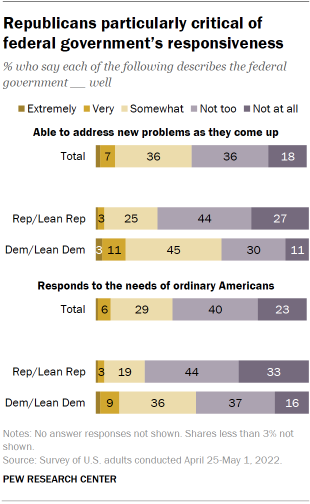
Chart shows Republicans particularly critical of federal government’s responsiveness

Sizable shares in both parties express doubts about the federal government’s ability to address new problems as they arise, as well as its responsiveness to the needs of ordinary Americans. Though these doubts are more widespread among Republicans than Democrats.

Seven-in-ten Republicans and 41% of Democrats say the phrase “able to address new problems as they come up” describes the federal government not too or not at all well, while just 13% of Democrats and 4% of Republicans say it describes the government very or extremely well. Nearly half of Democrats (45%) and a quarter of Republicans say this describes the federal government somewhat well.

A similar pattern is evident in views of whether the statement “responds to the needs of ordinary Americans” describes the federal government well. Roughly three-quarters of Republicans (76%) and 53% of Democrats say it does not, and only about one-in-ten Democrats (11%) and just 4% of Republicans say it describes the federal government very or extremely well. About a third of Democrats (36%) and 19% of Republicans say this describes the government somewhat well.

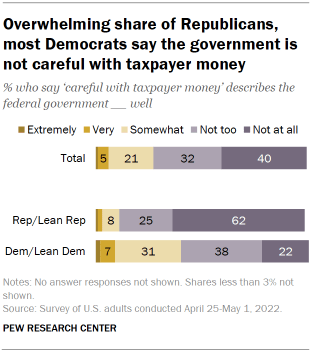
Chart shows overwhelming share of Republicans, most Democrats say the government is not careful with taxpayer money

Fewer than half in either party express much confidence in the way the federal government spends money, though Republicans are particularly likely to be critical of the federal government’s handling of taxpayer dollars.

About nine-in-ten Republicans say that the phrase “careful with taxpayer money” does not describe the government well, including 62% who say it describes the government not at all well. Among Democrats, six-in-ten say this phrase describes the federal government not too (38%) or not at all well (22%). While 8% of Republicans and 31% of Democrats say this describes the federal government somewhat well, no more than one-in-ten in either party say that this phrase describes the government extremely or very well (3% of Republicans, 9% of Democrats).

Public views of the challenges government faces

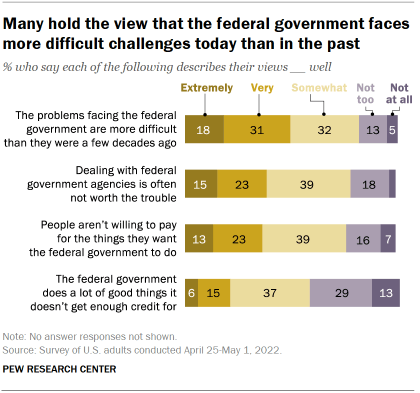
While the public is dissatisfied with some aspects of the federal government’s performance, many Americans also view the job of government as harder than it was in the past. About half of adults (49%) say the statement “the problems facing the federal government are more difficult than they were a few decades ago” describes their views very or extremely well, while just 18% say it does not describe their views; 32% say it describes their views somewhat well.

Chart shows many hold the view that the federal government faces more difficult challenges today than in the past

On balance, more Americans say “people aren’t willing to pay for the things they want the federal government to do” describes their own views extremely or very well (36%) than say it does not (23%). About four-in-ten (39%) say this describes their views somewhat well.

In contrast, just 21% of Americans say the statement “the federal government does a lot of good things it doesn’t get enough credit for” describes their views very or extremely well, while nearly twice as many say this describes their views not too or not at all well (41%). About four-in-ten (37%) say it describes their views somewhat well.

Chart shows similar shares of Republicans and Democrats say people aren’t willing to pay for what they want from government

Democrats are somewhat more likely than Republicans to say that the problems facing the federal government are more difficult today than in the past. A majority of Democrats (54%) say the statement “the problems facing the federal government are more difficult than they were a few decades ago” describes their views very or extremely well, compared with 43% of Republicans.

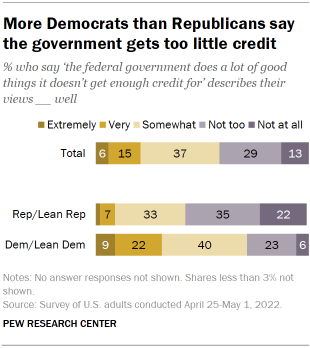
Chart shows more Democrats than Republicans say the government gets too little credit

There are no significant partisan differences on the question of whether people are willing to pay for what they want the federal government to do. Similar shares of Republicans (38%) and Democrats (36%) say the statement “people aren’t willing to pay for the things they want the federal government to do” describes their views very well or extremely well.

Partisan differences are larger when it comes to whether the government deserves more credit than it gets. About three-in-ten Democrats (31%) say the statement “the federal government does a lot of good things it doesn’t get enough credit for” describes their views extremely or very well, while an additional 40% say this describes their views somewhat well. By comparison, nearly six-in-ten Republicans (57%) say this statement describes their views not too or not at all well.

Nearly four-in-ten (38%) say that the statement “dealing with federal government agencies is often not worth the trouble” describes their views very or extremely well, and a similar share (39%) say this describes their views somewhat well. Just 22% say this describes their views not too or not at all well.

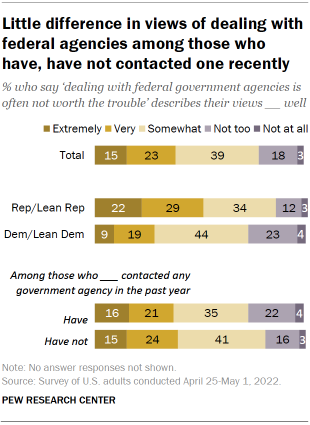
Chart shows little difference in views of dealing with federal agencies among those who have, have not contacted one recently

While large shares in both parties express at least somewhat negative views about dealing with government agencies, Republicans are more likely than Democrats to say that this statement describes their views very or extremely well. Half of Republicans say this, compared with 28% of Democrats; 84% of Republicans and 72% of Democrats say it describes their views at least somewhat well.

There are only modest differences in these views between the 31% of Americans who have contacted a government agency over the last year and the 68% who have not.

Personal freedoms and the federal government

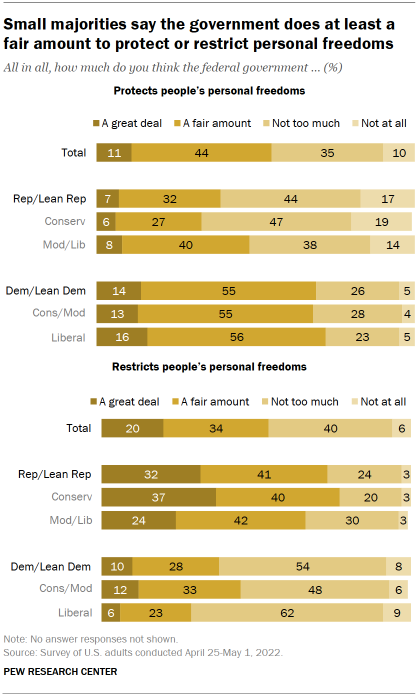
Just over half of Americans (54%) say the federal government does a great deal (11%) or a fair amount (44%) to protect people’s personal freedoms, while 35% say the government protects people’s freedoms “not too much” and one-in-ten say the federal government does not at all protect people’s personal freedoms.

Chart shows small majorities say the government does at least a fair amount to protect or restrict personal freedoms

Overall, the public holds similar views on whether the federal government restricts people’s personal freedoms: 54% say the government restricts people’s freedoms a great deal (20%) or a fair amount (34%), while 40% say the government does not do much to restrict people’s freedoms and just 6% say the federal government does not at all restrict people’s freedom.

Democrats are more likely than Republicans to say the federal government works to protects people’s personal freedoms. About seven-in-ten Democrats (69%) say the federal government does at least a fair amount to protect people’s freedoms. By contrast, 39% of Republicans say this.

Among Republicans, about half of moderate and liberal Republicans (48%) say the federal government does at least a fair amount to protect rights and freedoms. Conservative Republicans (34%) are considerably less likely to say this. There are no ideological differences among Democrats on how much the federal government does to protects people’s rights.

Republicans are much more likely to see the federal government as restricting people’s freedoms: Nearly three-quarters say the government does at least a fair amount to restrict people’s personal freedoms, including 32% who say it does a great deal to restrict people’s freedoms. Still, conservative Republicans (77%) are more likely than moderate and liberal Republicans (66%) to hold this view.

Most Democrats do not see the federal government as restricting people’s freedoms: 62% say the federal government does not do much or anything at all to restrict people’s personal freedoms, while 38% of Democrats say the government does at least a fair amount to restrict these freedoms. Conservative and moderate Democrats are more likely than liberal Democrats to say the federal government restricts personal freedoms (45% vs. 29%).

Beyond ideological divisions, there are only modest demographic differences among Republicans in views of how the government affects people’s rights and freedoms. Across most demographic groups, about seven-in-ten Republicans say the government does at least a fair amount to restrict personal freedoms, while about four-in-ten say the government protects people’s freedoms. However, there is more variation in these views among Democrats.

Chart shows among Democrats, wide demographic differences in views of government’s impact on people’s personal freedoms; smaller differences among Republicans

While 57% of Black Democrats, for example, say the federal government does at least a fair amount to protect personal freedoms, only a slightly smaller share (51%) say the federal government does a lot to restrict freedoms. By comparison, White Democrats are more than twice as likely to say the federal government does a fair amount to protect people’s freedoms (73%) than to say it does a fair amount to restrict people’s personal freedoms (30%). And while 65% of Hispanic Democrats say the government protects people’s freedoms, 48% say the government restricts personal freedom.

Democrats with a college degree or more education are far more likely to say the federal government protects people’s personal freedoms than to say it restricts them (78% vs. 24%). Among Democrats who have less formal education, there is a much narrower gap in the shares holding these two views (63% vs. 46%).

There are also wide differences in perceptions of the federal government supporting or hindering personal freedoms by household income among Democrats. Those with lower household incomes are just slightly more likely to say the government does a fair amount to protect personal freedoms (59%) than to say it does a fair amount to restrict freedoms (50%). Middle-income Democrats are twice as likely to say the government protects personal freedoms (72%) than to say it restricts personal freedoms (36%). Among upper-income Democrats, fully 82% say the government protects personal freedoms, while just 16% say the government restricts personal freedoms.

Large shares in both parties say the government intentionally withholds information

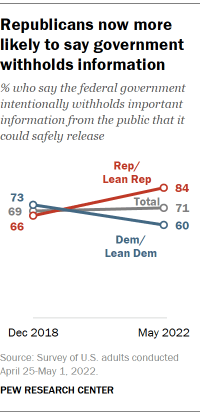
Chart shows Republicans now more likely to say government withholds information

About seven-in-ten Americans (71%) say that the federal government intentionally withholds important information from the public that it could safely release, while 28% say the federal government publicly releases the important information it can safely release.

Among the overall public, these views are little changed from 2018. But over this time period, Republicans have become more likely to say that the government intentionally withholds information, while Democrats have become less likely to say this. Today, more than eight-in-ten Republicans (84%) say that the government intentionally withholds information, up from 66% who said this in December 2018. And 60% of Democrats now say this, down from 73%.

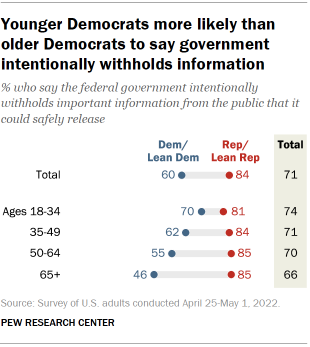
Younger Democrats are more likely than older Democrats to say that the federal government intentionally withholds important information from the public that it could safely release.

Chart shows younger Democrats more likely than older Democrats to say government intentionally withholds information

Seven-in-ten Democrats ages 18 to 34 say that the government does withhold important information, while 29% say the federal government publicly releases the information it can safely release.

Roughly six-in-ten Democrats ages 35 to 49 (62%) say the government withholds information, as do 55% of Democrats ages 50 to 64. Democrats ages 65 and older are more closely divided: About half (52%) say the government does release the information it can safely release, while a similar share (46%) say the government intentionally withholds important information.

Republicans’ views on whether the federal government intentionally withholds important information that it could safely release are nearly identical across age groups: At least eight-in-ten say the government withholds information among Republicans ages 18 to 34 (81%), 35 to 49 (84%), 50 to 64 (85%) and 65 and older (85%).

3. Federal government: Performance and role

Americans’ evaluations of the federal government’s performance in specific realms have shifted somewhat since 2020. For the most part, these shifts reflect changes in the political landscape: Democrats tend to rate the government’s performance more positively now than when Donald Trump was president, while Republicans have adopted more negative views – a similar, inverse shift in evaluations was seen between 2015 (during Barack Obama’s presidency) and the fall of 2017 (several months into Trump’s term). Still, as in the past, the public makes distinctions in its evaluations of the federal government’s performance in different realms – giving high marks in some areas and very low marks in others.

The public’s views of the appropriate role for government have, for the most part, changed only modestly over time. While most Americans say the government should have a major role on such issues as terrorism and immigration, there is less agreement about other areas – notably, in alleviating poverty.

High marks for government’s handling of disasters, terrorism, safety of food and medicine

Seven-in-ten Americans say that the federal government is doing a very or somewhat good job in responding to natural disasters. Similar shares say that the government is doing a good job at keeping the country safe from terrorism (68%), ensuring that food and medicine are safe (67%) and setting fair standards for workplaces (64%).

About half of Americans give positive assessments of the government’s performance protecting U.S. interests around the world and effectively handling threats to public health.

The public is more critical of the government’s performance in other areas: Just 37% say it is doing at least a somewhat good job of strengthening the economy and only about a quarter give the government positive ratings for managing immigration and helping people get out of poverty (24% each).

As in the past, there are sizable partisan differences in views of government performance. Democrats and Democratic-leaning independents are more likely than Republicans and GOP leaners to give positive assessments on all but two items in the survey – ensuring access to health care and protecting the environment.

Chart shows Democrats are more likely than Republicans to view govt. performance positively, except on health care and the environment

One of the widest partisan divides in views of government performance – of 12 items included in the survey – is on strengthening the economy. About half of Democrats (53%) say the federal government is doing a very or somewhat good job strengthening the economy. Only 17% of Republicans say the same.

There are similar gaps between partisans in assessments of protecting U.S. interests around the world, keeping the country safe from terrorism and effectively handling threats to public health.

Democrats are most positive in their assessments of the federal government’s performance keeping the country safe from terrorism: An overwhelming 84% majority say the government is doing a good job at this.

About three-quarters of Democrats also say the government is doing a very or somewhat good job of ensuring that food and medicine are safe and responding to natural disasters (73% each).

While Republicans are more negative in their assessments of government performance than they were in 2020, there are some areas where Republicans say the government is doing a good job. For instance, about two-thirds of Republicans (66%) say the government is doing a good job responding to natural disasters.

Six-in-ten Republicans also offer positive views of government performance on setting fair and safe standards for workplaces and a similar majority (59%) say the same about ensuring that food and medicine are safe.

The only area in which a significantly larger share of Republicans rate the job the federal government is doing more positively than Democrats is on protecting the environment. About half of Republicans (47%) say this, compared with 36% of Democrats. Nearly equal shares in both parties say the government does a good job of ensuring access to health care (46% of Republicans, 45% of Democrats).

Large partisan shifts in views of government performance since 2020

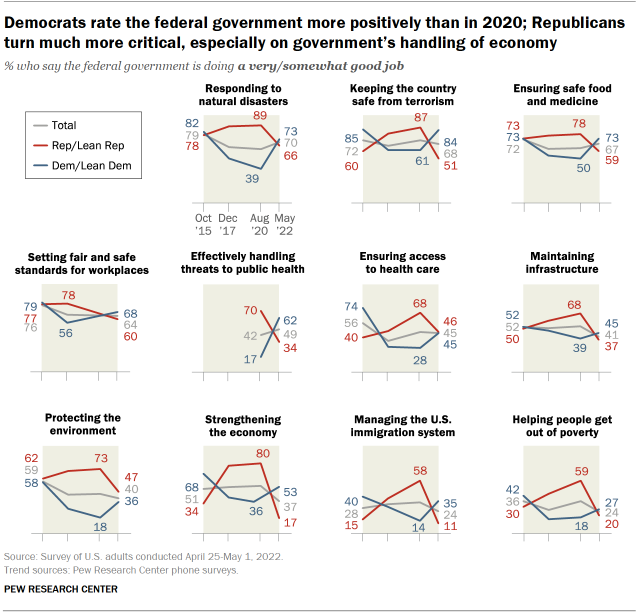
On many issues, Democrats now offer more positive assessments and Republicans offer more negative assessments than in 2020 during the Trump administration. This is a continuation of a pattern in which partisans tend to have more positive views of government when the presidency is held by a member of their party. GOP assessments of government were higher, and Democratic assessments lower, in 2017 and 2020 than both today and in 2015 (during the Obama administration).

Chart shows Democrats rate the federal government more positively than in 2020; Republicans turn much more critical, especially on government’s handling of economy

In 2020, 70% of Republicans said the government was doing a good job handling threats to public health, while just 17% of Democrats said the same. Today, 62% of Democrats approve of the job the government is doing handling threats to public health, while only about a third of Republicans (34%) say this.

Republicans have become much more critical of the government’s handling of the economy than they were two years ago: In 2020, 80% had positive assessments of the job the government was doing to strengthen the economy, but today, just 17% say the same. Among Democrats, there has been a more modest increase in positive views: Two years ago, 36% said the government was doing a good job strengthening the economy, today about half of Democrats (53%) say this.

In 2020, 87% of Republicans gave the government positive ratings for keeping the country safe from terrorism. Today, about half (51%) say the same. Among Democrats, 84% give the government positive ratings on this issue today, similar to Republicans two years ago.

When it comes to managing the immigration system, a 58% majority of Republicans gave positive assessments of the government’s performance in 2020. Today, just 11% say this, a 47 percentage point drop. Democrats are 21 points more positive on this issue than they were in 2020 (35% now, 14% then).

Both parties give the government low ratings for helping people get out of poverty. For Republicans, this is a change from 2020; today, just 20% say the government is doing well in alleviating poverty, down from 59% two years ago. Democrats also give the government low ratings for lifting people out of poverty (27% very/somewhat good today, 18% in 2020).

Large majorities say the government should play a major role in many areas

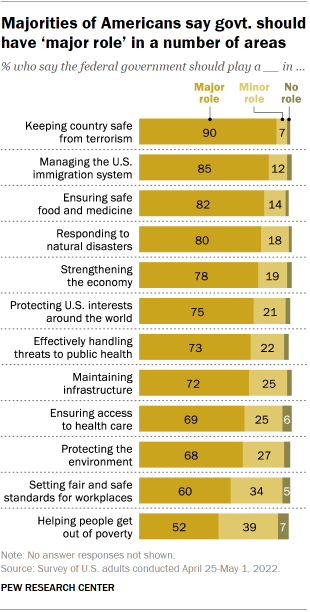
Chart shows majorities of Americans say govt. should have ‘major role’ in a number of areas

Majorities of adults say that the federal government should play a major role in all but one of the 12 areas asked about in the survey. Nine-in-ten say the government should play a major role in keeping the country safe from terrorism and more than eight-in-ten say the same about managing immigration (85%), ensuring that food and medicine are safe (82%) and responding to natural disasters (80%).

More than three-quarters of Americans (78%) say that the federal government should play a major role in strengthening the economy. Nearly as many (73%) say the same about the role of the federal government in effectively handling threats to public health.

A somewhat smaller majority (60%) say that the government should play a major role in setting fair and safe standards for workplaces. And about half of adults (52%) say that the federal government should play a major role in helping people get out of poverty, ranking lowest of 12 items in the survey; 39% say it should play a minor role and just 7% say it should not play a role.

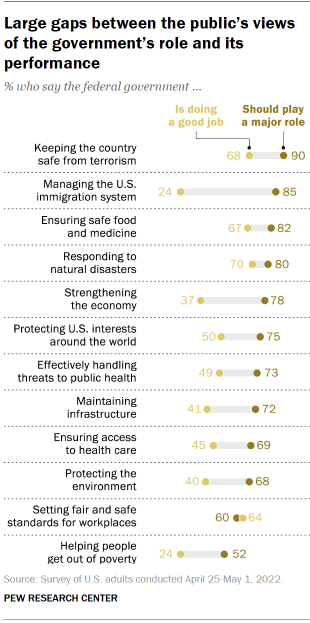
While large majorities of the public say that the federal government should play a major role in nearly all of the issue areas included on the survey, as in the past, the shares who say the federal government is doing a good job on those same areas is consistently lower.

Chart shows large gaps between the public’s views of the government’s role and its performance

The largest gap is on managing the U.S. immigration system. An overwhelming 85% majority of adults say that the federal government should play a major role in managing the U.S. immigration system. However, just 24% say the government is doing a very or somewhat good job in this area.

Similarly, more than three-quarters of Americans say that the federal government should play a major role in strengthening the economy, while 37% say that it is doing a good job.

On most other issues included in the survey, there is a sizable gap between views of the role of the government and the job the federal government is doing.

The only issue where the share of the public saying the government should play a major role is not higher than its assessment of the government’s performance is setting fair and safe standards for workplaces.

Six-in-ten Americans say the government should play a major role in setting fair and safe standards for workplaces, while a roughly similar share (64%) say it is doing a good job on this.

Chart shows wide partisan gaps in views of whether government should play ‘major role’ on poverty, health care, the environment

There are deep divides between Democrats and Republicans on the role of the federal government across many of the 12 issues included in the survey. The largest gap is on protecting the environment. Nearly nine-in-ten Democrats (89%) say the federal government should play a major role in protecting the environment; fewer than half of Republicans (43%) say the same. Half of Republicans say the government should have a minor role in protecting the environment; just 7% say it should have “no role at all.”

There are similarly large gaps over the extent to which the government should play a role in ensuring access to health care (86% of Democrats and 46% of Republicans say it should play a major role) and helping people get out of poverty (70% of Democrats, 31% of Republicans).

Large shares of both Republicans and Democrats say that the government should play a major role in strengthening the economy, although Democrats are somewhat more likely to say this.

Similar shares of partisans say that the government should play a major role in keeping the country safe from terrorism and protecting U.S. interests around the world.

Managing the U.S. immigration system is the only issue in the survey where Republicans are more likely than Democrats to say the government should play a major role, although at least eight-in-ten in each party say this (88% of Republicans, 82% of Democrats).

While views of the role of government have remained largely consistent, the shares of the public saying the federal government should play a major role in helping people get out of poverty and effectively handling threats to public health have declined since 2020.

In 2020, a 62% majority said the government should play a major role in helping people get out of poverty; today, about half of Americans (52%) say this. On handling public health threats, a somewhat smaller share of adults today (73%) say that the government should play a major role in effectively handling threats to public health than said this two years ago (78%).

Chart shows since 2020, sharp declines in shares of Republicans saying government should have ‘major role’ in alleviating poverty, addressing public health

For both of these issue areas, these declines are particularly pronounced among Republicans.

In 2020, half of Republicans said the government should play a major role in helping people get out of poverty. Today, only 31% say this.

Two years ago, about two-thirds of Republicans (68%) said the government should play a major role in handling threats to public health; a smaller majority (57%) say this today.

There were no substantive declines among Democrats on the role of government for these two issue areas.

In their own words: What Americans think of federal and state government performance

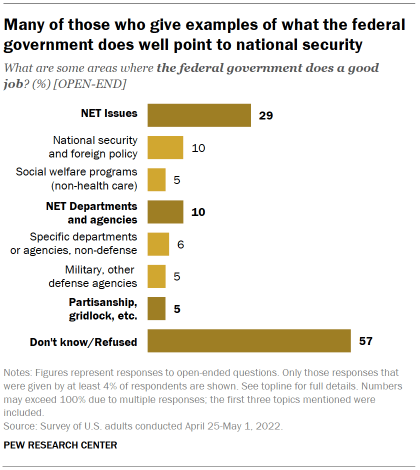
When asked to name some areas where the federal government is doing a good job, roughly four-in-ten Americans (41%) offer an answer.

Chart shows Many of those who give examples of what the federal government does well point to national security

About three-in-ten (29%) name a specific issue or issue areas where the government is doing a good job, covering a wide range of government policies and programs.

One-in-ten specifically cite national security or foreign policy, with topics ranging from defending the country from terrorism, to international trade, to the response to Russia’s invasion of Ukraine. One man in his 20s says the government does a good job “working together when a major emergency occurs, such as sending aid to Ukraine.”

A smaller share (5%) refers to a variety of social welfare programs, including Social Security and the stimulus checks many Americans received in response to the coronavirus pandemic. An additional 3% of adults discuss the federal government’s performance on issues related to health care or its administration of programs such as Medicare and Medicaid.

One-in-ten adults discuss specific branches, departments or agencies within the government that they say are performing well. This includes 5% who point to the military and agencies tasked with national security, and a similar share who name other specific departments and agencies, ranging from the Centers for Disease Control and Prevention (CDC) to the National Parks Service to the U.S. Census Bureau.

A small but notable share of adults (5%) answer this question by saying that the government does a “good” job at failing to serve the people. For example, a woman in her 40s says that she “can’t think of anything they are good at, besides wasting taxpayers’ money and time.”

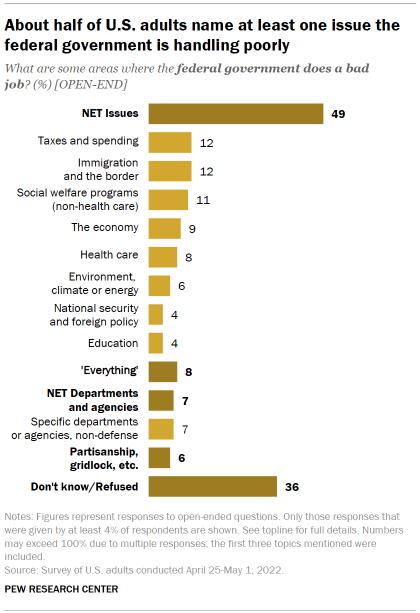
Chart shows About half of U.S. adults name at least one issue the federal government is handling poorly

About six-in-ten adults (63%) provide an answer when asked to name some areas where the federal government is doing a bad job, including 49% who name a specific issue or issue area.

About one-in-ten each cite taxes and spending (12%), immigration and the border (12%), social welfare programs (11%), the economy (9%) or health care (8%). In contrast to those who name social welfare programs as a positive area of government performance, one woman in her 60s who views the federal government’s performance in this area negatively says it fails in “not making sure the people that need help are getting it. Too many people that are able to work are receiving money and help they don’t need.”

A small share of Americans (7%) point to specific agencies and departments. However, in sharp contrast to comments about what the federal government is doing well, hardly any Americans (1%) name the military or national security agencies as parts of the government that are doing a bad job. And 8% offer that the entire federal government is performing poorly.

Another 6% of adults express complaints about politicians or the political process as areas where the government is doing a poor job. As a woman in her 50s says, “They are completely partisan, and many good ideas or bills get tossed because both sides can’t compromise to come up with legislation that would be helpful to the American people. They spend more time stopping legislation than they do passing anything.”

Views of state government performance

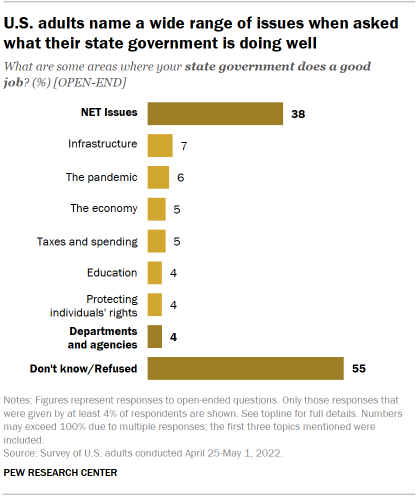
Chart shows U.S. adults name a wide range of issues when asked what their state government is doing well

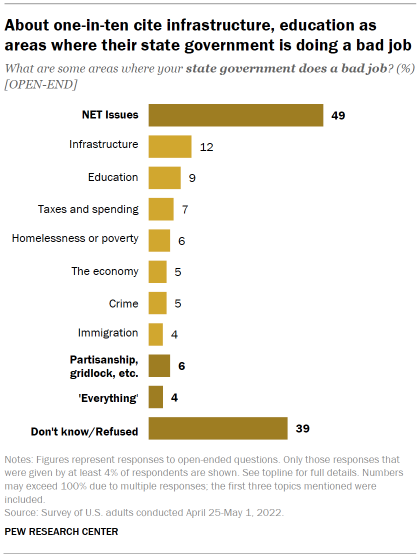
When asked to name some areas where their state government is doing a good job, 38% of Americans name specific issue areas, while 4% name components of the state government such as specific departments or elected officials. Just over half of respondents (55%) do not offer a response. Asked what their state government does poorly, 49% name specific issue areas, 3% cite components of the state government, and about four-in-ten (39%) do not offer a response.

Infrastructure is among the most commonly cited issues among those discussing both positive and negative aspects of their state government’s performance, though those discussing areas where their state government is doing a bad job are somewhat more likely to name this than those discussing areas where their state government is doing a good job (12% vs. 7%). The condition of roads within the state is an important topic for many, though some are also concerned with the high cost of utilities or with internet access in certain areas of their state.

Chart shows about one-in-ten cite infrastructure, education as areas where their state government is doing a bad job

Nearly one-in-ten (9%) name education as an area where their state is doing a bad job, roughly twice as many as the share who say it is an area where their state is doing a good job (4%). One woman in her 70s notes the good intentions of many officials, saying, “Some in state government do care about citizens and do their best to benefit us, such as education, health care, etc.” By contrast, a man in his 40s asserts, “We need more funding for K12 education” in his state.

As with federal government performance, Americans name a wide variety of policy areas where their state governments are performing well or where they could perform better. Beyond infrastructure and education, state governments’ handling of taxes and spending, homelessness and poverty, the economy, crime and the COVID-19 pandemic are among the most commonly cited issues – both good and bad.

Additionally, 6% of adults express concerns about the motives of politicians and gridlock in the political process when it comes to their state government’s performance. This is identical to the share of adults who offer up that the federal government’s performance is hampered by these types of problems. And as with the federal government, a small but sizable share says that every or just about every part of their state government is doing a bad job, with 4% saying this.

4. Levels of government: Federal, state, local

Americans have long had a more favorable view of their state and local governments than the federal government, and this continues to be the case today.

About two-thirds (66%) say they have a favorable view of their local government, compared with 54% who have a favorable view of their state government and just 32% who have a favorable view of the federal government.

The share who say they have a favorable view of the federal government is identical to the share who said this three years ago, though there has been substantial movement within each party. Just over one-in-ten Republicans (13%) now hold a favorable view of the federal government, down from 41% in August 2019. And about half of Democrats (49%) now hold favorable views of the federal government, up from 26% in 2019.

Favorable views of both state and local governments are down slightly since 2019 (5 points and 3 points, respectively).

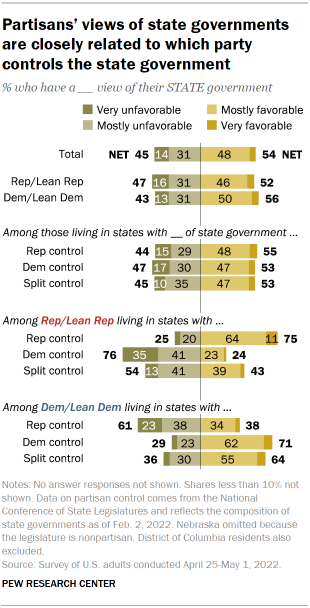
Both Republicans and Democrats tend to hold more favorable views of their state government if they live in a state where their party is currently in control.

Chart shows partisans’ views of state governments are closely related to which party controls the state government

Three-quarters of Republicans living in states with a Republican governor and Republican control of the state legislature have a very favorable (11%) or mostly favorable (64%) view of their state government. A nearly identical share of Republicans living in Democratic-controlled states have unfavorable views of their state government: 35% say they have a very unfavorable view while 41% have a mostly unfavorable view.

Seven-in-ten Democrats living in states with a Democratic governor and a majority-Democratic legislature have a very (8%) or mostly (62%) favorable view of their state government. And about six-in-ten Democrats living in Republican-controlled states (61%) have unfavorable views of their state government: 23% very unfavorable and 38% mostly unfavorable.

Democrats living in states with divided governments (those with split partisan control of the legislature or a governor of one party and a legislature controlled by the other party) generally hold more favorable views of their state government than Republicans living in states with divided governments. More than six-in-ten Democrats living in states with divided control (64%) report favorable views, compared with less than half of Republicans in these states (43%).

Federal and state government relations

When it comes to the relationship between state governments and the federal government, the public expresses a mix of concerns. About a third express a high degree of concern that the federal government does too much on issues they would rather see be left to state governments, while an equal share expresses a high degree of concern that state governments are not willing enough to work with the national government. And while Republicans are more likely than Democrats to express concern about the former, and Democrats are more concerned than Republicans about the latter, about half of those in both parties have at least some concern about both of these things.

At the same time, 43% of Americans are very or extremely concerned that people’s rights and protections might differ from state to state (about two-in-ten say they are not concerned about this), with Democrats more likely than Republicans to express this concern.

Chart shows partisans differ over concerns about the relative role of state and federal governments

All in all, about a third of the public is extremely (15%) or very concerned (19%) “the federal government is doing too much on issues better left to state governments,” while three-in-ten are not too (24%) or not at all concerned (6%) about this; 35% are somewhat concerned about this occurring.

Similarly, about a third of the public (34%) say they are extremely (12%) or very concerned (22%) about “state governments not being willing enough to work with the federal government.” Nearly three-in-ten (28%) say they are not too (22%) or not at all concerned (6%) about this occurring. An additional 36% say they are somewhat concerned about state governments not working with the federal government.

Republicans and Republican-leaning independents express far higher levels of concern about the federal government’s involvement in issues that can be dealt with at the state level than they are in states not being willing enough to work with the federal government. By contrast, Democrats and Democratic leaners are more concerned that state governments don’t do enough to work with the federal government than they are about the federal government stepping into areas better left to state governments.

More than half of Republicans say they are extremely (27%) or very concerned (27%) about federal government overreach into state-level issues. Another 32% of Republicans say they somewhat concerned about this occurring. Democrats express far lower levels of concerns about this: Just 18% say they are extremely or very concerned about the federal government doing too much on issues better left to the states, while 36% express some concern about this and 45% are not too or not at all concerned about this.

Democrats, by contrast, are more concerned about state governments not being willing to work with the federal government. About half (48%) are extremely or very concerned about this, compared with 18% of Republicans. Another 35% of Democrats say they are somewhat concerned about state governments’ unwillingness to work with the federal government. Fully 44% of Republicans are not too (34%) or at all concerned (10%) that state governments are not willing enough to work with the federal government.

Chart shows half of Americans express concern both about states not working with federal govt. and about federal govt. doing too much that should be done at the state level

Half of Americans – and similar shares of both Republicans (49%) and Democrats (50%) – express at least some concern both that states are not willing to work with the federal government andthat the federal government is doing too much on issues better left to state governments.

However, about four-in-ten Republicans (37%) say they are at least somewhat concerned that the federal government will overreach on issues better left to state governments but are not concerned about state governments being unwilling to work with the federal government, while just 4% of Democrats hold this combination of views.

In contrast, a third of Democrats are at least somewhat concerned that state governments will not be willing to work with the federal government and are not concerned that the federal government will take on issues that are better suited for state governments, while just 5% hold this combination of views.

Partisans differ in level of concern that rights and protections may vary across states

Chart shows Democrats more concerned than Republicans that the rights Americans have may differ from state to state

About four-in-ten U.S. adults (43%) say they are extremely or very concerned that the rights and protections a person has might be different depending on which state they live in, with an additional 35% saying they are somewhat concerned about this. About one-in-five are not too (16%) or not at all concerned (4%) about this possibility. (Note: This survey was conducted April 25-May 1, before the May 2 leak of a draft Supreme Court opinion on abortion that suggests that the upcoming court decision would result in states setting their own policies on this issue.)

Democrats are more likely than Republicans to express this concern: 53% say they are concerned that the rights and protections a person has might be different depending on which state they live in, with a quarter saying they are extremely concerned. Roughly a third of Democrats say they are somewhat concerned that the rights and protections a person has might depend on where they live, and just 13% say they are not too or not at all concerned about this.

By contrast, Republicans have fairly mixed views on how concerning they view the possibility of rights and protections differing depending on which state a person lives in: A third of Republicans say they are extremely (12%) or very concerned (21%) about this, while 37% say they are somewhat concerned. About three-in-ten say they are not too (22%) or not at all concerned (7%) about this.

Chart shows among Democrats, older adults more concerned that rights and protections a person has may very by state

Among Democrats, there are differences across demographic groups in the level of concern that rights and protections might vary from state to state.

While similar shares of White (56%) and Black Democrats (61%) say they are extremely or very concerned that the rights and protection a person has may differ depending on which state they live in, Hispanic Democrats are less likely to say this. Hispanic Democrats are more likely than other Democrats to say they are somewhat concerned individual rights and protection may differ by state.

Older Democrats are more likely than younger Democrats to say they are concerned that the rights a person holds may differ by state: 64% of Democrats ages 65 and older say this, compared with 55% of those ages 50 to 64 and about half of those under the age of 50 (48%).

Among Republicans, there are only modest differences in the level of concern that individual rights and protections may differ from state to state.

5. Values and expectations of government

There has been little recent change in the public’s views of whether government generally should do more to solve problems, or whether it is doing too many things better left to businesses and individuals.

Currently, a majority of adults (53%) say that the government should do more to solve problems; a nearly identical share said this in 2021 (55%). Today, 45% say the government is doing too many things better left to businesses and individuals.

There consistently have been wide partisan differences in these views. Democrats are about three times as likely as Republicans to say that government should do more to solve problems (76% vs. 25%).

While Democrats are slightly less likely to say the government should do more to solve problems than they were in 2021, Republican views are virtually unchanged.

There are also sizable differences by race and ethnicity, as well as by age.

Chart shows younger adults more likely than older people to say that government should do more to solve problems

While large majorities of Black (72%), Asian (68%) and Hispanic (65%) respondents say that government should do more, about half of White adults (52%) say that the government is doing too many things better left to businesses and individuals.

Younger adults are more likely than older adults to say the government should do more.

Majorities of those ages 18 to 29 (63%) and 30 to 49 (59%) say that government should do more; about half of adults ages 50 to 64 and four-in-ten over the age of 65 say the same.

Groups and the federal government

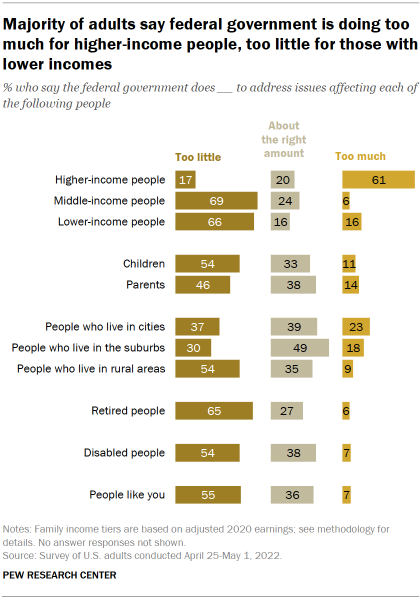
When it comes to addressing the needs of various people in the country today, a majority of adults say the federal government is doing too much for higher-income adults – and too little for those with lower and middle incomes.

A majority of the public says the federal government is doing too little to address issues affecting middle-income (69%) and lower-income people (66%). Conversely, about six-in-ten (61%) say the government is doing too much for higher-income adults.

Chart shows majority of adults say federal government is doing too much for higher-income people, too little for those with lower incomes

A similarly large majority (65%) also says the government is doing too little to address the needs of retired people.

For the other groups asked about in the survey, views are more mixed. For example, the public overall is more likely to say that the government is doing too little for people who live in rural areas (54%), but is less likely to say this about those who live in cities (37%) or suburbs (30%).

More than half of U.S. adults (55%) say that the government is doing too little to address issues affecting “people like you.” By comparison, 36% say the government is doing about the right amount to address these problems, while just 7% say it is doing too much.

Though there is bipartisan agreement about the level of assistance the government is providing some groups, there are sizable gaps in views of its support of other groups – including lower-income people, children and disabled people.

Democrats more likely than Republicans to say government is doing too little to address issues affecting children, parents

Republicans and Democrats are fairly aligned in views of how much the government is doing for middle- and higher-income adults. However, Democrats are far more likely than Republicans to say the government is doing too little to address the needs of lower-income people (79% vs. 50%).

There are also significant gaps in views of children and parents. Compared with Republicans, Democrats are more likely to say the government is doing too little for each of these groups – 63% of Democrats say the government is doing too little for children, compared with 44% of Republicans who say this. Republicans are far more likely than Democrats to say the government is doing too much for children (19% vs. 5%), while about a third in each party say the government is providing about the right amount of assistance.

And while about half of Democrats (49%) say too little is being done for parents, about four-in-ten Republicans (41%) say the same. Republicans are about three times as likely as Democrats to say the government is doing too much in addressing issues that affect parents (23% vs. 7%).

Democrats are also considerably more likely than Republicans to say too little is done for people with disabilities (60% vs. 45%). More than four-in-ten Republicans (44%) say about the right amount is being done to address this group’s needs, compared with 34% of Democrats who say this.

Chart shows Democrats far more likely than Republicans to say government is doing too little on issues affecting lower-income people

While similar majorities of Republicans and Democrats say the government is doing too little to address issues affecting middle-income adults, there are sizeable partisan gaps in views about how the government is addressing the needs of lower-income and higher-income adults.

About eight-in-ten Democrats (79%) say the government is doing too little to address the needs of lower-income people; this compares with half of Republicans who say the same. Three-in-ten Republicans say the government is doing too much for low-income adults, while 19% say it is doing about the right amount.

There is also a sizable gap in views of what the federal government is doing for higher-income people. Democrats are far more likely than Republicans to say the government is doing too much to address issues facing high-income adults (69% vs. 53%, respectively). Republicans are much more likely than Democrats to say the government is doing about the right amount (28% vs. 12%).

By and large, Republicans and Democrats have similar views about how the federal government is doing addressing issues facing suburban and rural people. But there is a wide partisan gap in views of those who live in urban areas.

Chart shows Republicans more likely than Democrats to say the government is doing ‘too much’ on issues affecting city dwellers

About half of adults in each partisan group say too little is done for people who live in rural areas; smaller shares say the government is doing about the right amount to address issues affecting adults in rural communities.

Republicans and Democrats also hold similar views about suburbanites: About half of adults in each party say the government is doing about the right amount to address the needs of people who live in suburbs.

But there is a wider gap in views of government attention to people who live in cities. Democrats are considerably more likely than Republicans to say too little is done for city dwellers (43% vs. 27%). In contrast, Republicans are three times as likely as Democrats to say the government is doing too much for those who live in cities.

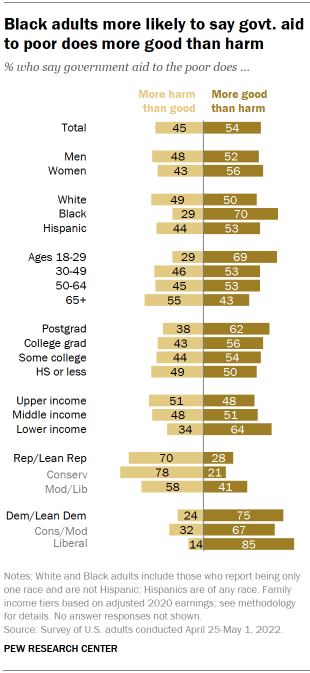
Democrats more likely than Republicans to say government aid to poor does more good than harm

Overall, a 54% majority of Americans say that government aid to the poor “does more good than harm because people can’t get out of poverty until their basic needs are met.” A smaller share (45%) says that government aid to the poor “does more harm than good by making people too dependent on government assistance.”

Chart shows Black adults more likely to say govt. aid to poor does more good than harm

Seven-in-ten Black adults say that government aid does more good than harm, compared with about half of Hispanics (53%) and half of White adults who say the same thing.

A large majority of adults ages 18 to 29 (69%) say that government aid does more good than harm, more than any other age group.

About half of adults ages 30 to 49 and 50 to 64 (53% each) say that government aid to the poor does more good than harm, while a small majority of those over the age of 65 say that government aid does more harm than good.

Lower-income adults are more likely to have favorable views of government aid to the poor: About two-thirds of this group say that this aid does more good than harm, compared with about half of middle- (51%) and upper-income (48%) adults.

There are also ideological differences within each party with moderates in each party expressing somewhat more mixed views than those who are more conservative or liberal. Moderate and liberal Republicans are nearly twice as likely as conservative Republicans to say that aid to the poor does more good than harm (41% vs. 20%). Among Democrats, a larger majority of liberals (85%) than moderates and conservatives (67%) have a positive view of the impact of aid to the poor.

Among Republicans, there are considerable differences in views of government aid to the poor by age and income.

Chart shows younger, lower-income Reps. have more positive views of govt. aid to the poor

Republicans under the age of 50 are about twice as likely as those 50 and older to say that government aid does more good than harm (38% vs. 20%).

About half of lower-income Republicans (52%) say that government aid to the poor does more good than harm, compared with much smaller shares of middle- (23%) and upper-income (13%) Republicans who say this.

There are no substantial differences among Democrats by age or income.

Most say religion should be kept separate from government policy

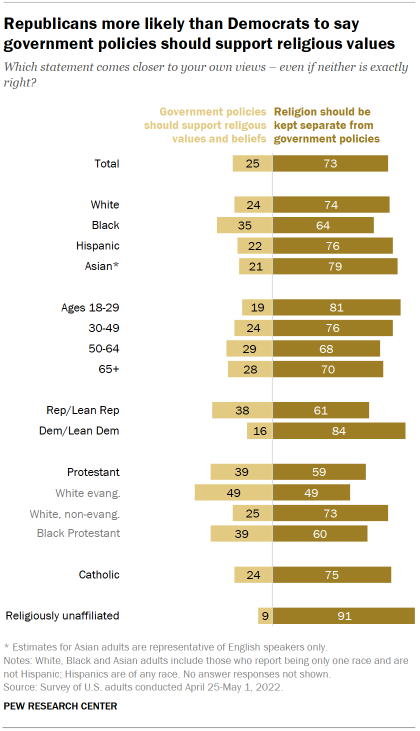
Chart shows Republicans more likely than Democrats to say government policies should support religious values

Though the vast majority of adults say religion should be kept separate from government policies (73%), there are sizable differences in these views by partisanship and religious affiliation. There are also more modest differences by race and ethnicity, and by age.

While large majorities of adults across racial and ethnic groups say that religion should be kept out of government policies, Black adults are slightly more likely than others to say the government should support religious values and beliefs: About a third of Black adults say this, compared with about two-in-ten adults of other racial and ethnic groups.

And while majorities of both Republicans (61%) and Democrats (84%) say religion should be separate from government policies, Republicans are more than twice as likely as Democrats to say government policies should support religious values and beliefs (38% vs. 16%). Among Republicans, those who are religiously affiliated – as well as older Republicans – are particularly likely to say this.

White evangelical Protestants stand out for their views on the relationship between government and religion: About half say government policies should promote religious values and beliefs. This compares with a smaller share of White non-evangelicals (25%) and Black Protestants (39%) who say the same. Religiously unaffiliated adults overwhelmingly say that the U.S. government should not promote religious values (91%).

6. The people of government: Career employees, political appointees and candidates for office

The public continues to express more confidence in the federal government’s career employees than in officials appointed by the president. However, the share of Americans who have a great deal or fair amount of confidence in career employees at federal agencies has declined since 2018.

The public is deeply skeptical about the motives of those who seek political office: Far more U.S. adults say these individuals do so in order to serve their own interests rather than to serve their communities. And most Americans are doubtful that if they reached out to their House member with a problem, that the representative would be likely to help them.

Confidence in government’s career employees drops

The share of Americans who have a great deal or a fair amount of confidence in career employees at government agencies who are not appointed by a president has declined by 9 percentage points since late 2018, from 61% to 52%.

Roughly one-in-ten adults (9%) now say they have a great deal of confidence in career government employees, while 44% have a fair amount of confidence. A third say they have not too much confidence in career civil servants, and 14% say they have no confidence in them at all.

Confidence in government employees has declined among both Republicans and Democrats since 2018. Among Republicans and independents who lean toward the Republican Party, 38% say they have a great deal or a fair amount of confidence in civil servants, down from 48% in December 2018.

Chart shows after 2020 election, partisans flip in confidence in presidential appointees

Among Democrats and Democratic leaners, nearly two-thirds (65%) have a great deal (14%) or a fair amount (51%) of confidence in career civil servants, down from 71% nearly four years ago.

Overall confidence in officials appointed by a president to oversee government agencies has also decreased slightly since 2018. Nearly four-in-ten adults (39%) have a fair amount (35%) or a great deal (5%) of confidence in presidential appointees. Six-in-ten adults say they have not too much confidence (42%) or no confidence at all (18%) in these officials – a 3 point increase since 2018.

Confidence in officials appointed by a president to oversee government agencies is more closely related to partisanship than to confidence in career government employees.

Between December 2018, when Donald Trump was president, and May 2022, with Joe Biden midway through his term, Republicans became much less confident in presidential appointees; at the same time, Democrats became much more confident in them.

Today, about two-in-ten Republicans (21%) have a great deal (2%) or a fair amount (19%) of confidence in officials appointed by a president, compared with six-in-ten who expressed at least a fair amount of confidence in 2018. And a narrow majority of Democrats (54%) now have a great deal (6%) or a fair amount (48%) of confidence, compared with 28% in late 2018.

More say those who run for office do so to serve personal interests rather than their community

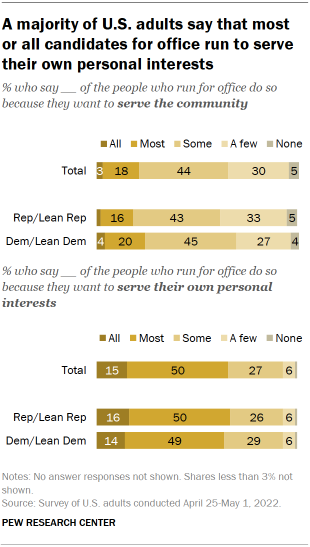
Chart shows a majority of U.S. adults say that most or all candidates for office run to serve their own personal interests

The public is skeptical of the motivations of those who run for local, state and federal elected offices. Nearly two-thirds (65%) say that at least some candidates run for office out of a desire to serve the community, but a much larger share (92%) say at least some political candidates seek office as a means of serving their own interests.

Relatively few Americans say all (3%) or most people (18%) who run for office do so because they want to serve the community; however, another 44% say some political office seekers are motivated by a desire to serve. About a third (35%) say few or no candidates run because they want to serve the community.

By contrast, 65% say all (15%) or most (50%) candidates for office are motivated by personal interests; another 27% say this is a factor for some candidates. Very few (7%) say few or no candidates run to advance their own interests.

Republicans and Democrats hold fairly similar views on the motivations of those who run for office.

Nearly identical shares in each party say that all or most of the people who run for office do so to serve personal interests (66% of Republicans, 64% of Democrats). However, Democrats are somewhat more likely than Republicans to say that all or most candidates run to serve the community (25% vs. 18%).

A substantial share of the public is particularly cynical about the motives of people who run for office: Three-in-ten adults say that all or most of those who run for office do so to serve their own personal interests and say that a few or none do so to serve the community.

Republicans are somewhat more likely to be in this group than Democrats, and those who lean toward a party are more likely than those who identify with that party to be in it: Four-in-ten Republican leaners, 33% of Democratic leaners, 30% of Republicans and 21% of Democrats say that all or most candidates for office run to serve their personal interests and that few or none do so to serve the community.

Few expect U.S. House members to be responsive to constituents

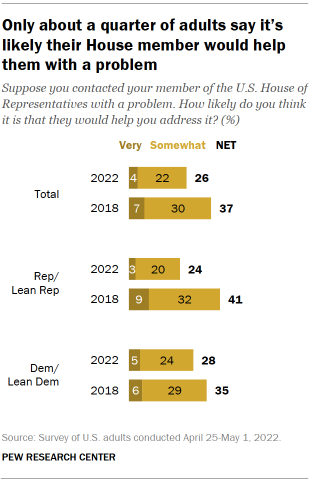
Chart shows only about a quarter of adults say it’s likely their House member would help them with a problem

About a quarter of Americans (26%) say that, if they contacted their member of the U.S. House of Representatives with a problem, it is very (4%) or somewhat (22%) likely that the representative would help them address it. Nearly three times as many (73%) say that it is not very likely (45%) or not at all likely (29%) that their representative would assist them.

The share of the public who thinks it’s very or somewhat likely that their House representative would assist them with a problem has declined 11 points since 2018. There has been a decline among both Republicans and Democrats, though it is somewhat steeper for Republicans. Democrats currently hold a majority in the House; in 2018, Republicans had the majority.

Today, 24% of Republicans say it is at least somewhat likely that their representative would assist them, down from 41% four years ago. And 28% of Democrats say this, compared with 35% in 2018.

Americans who live in districts represented by a member of their own party are somewhat more likely than those who live in districts represented by a member of the other party to expect that their representative would help them address a problem if contacted.

Chart shows large majorities say it’s unlikely House member would help with a problem, regardless of member’s party

However, even among partisans who live in a district with a representative from the same party, relatively small shares say the House member would be likely to assist them.

Among Republicans, 27% of those represented by a Republican in the House say it is somewhat or very likely that their representative would assist them. Somewhat fewer Republicans (18%) living in districts represented by a Democrat say this.

A third of Democrats who are represented by a Democratic member in the House say it is somewhat or very likely that their representative would assist with a problem, compared with 22% of those who are represented by a Republican.

7. Views about the state of the nation

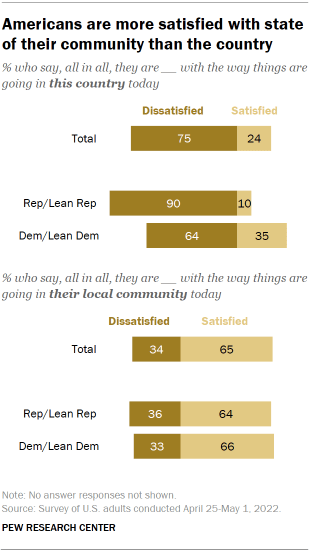
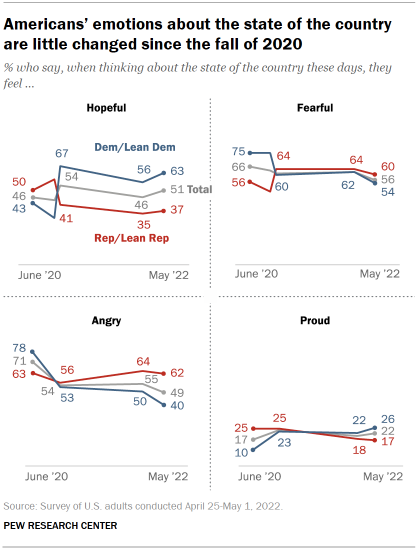
As has been the case for nearly two decades, a majority of Americans express dissatisfaction with the current state of the nation. Today, only about a quarter (24%) are satisfied with the way things are going in the country, while three-quarters say they are dissatisfied. Although public satisfaction is now higher than it was during the summer and fall of 2020, it is somewhat lower than it was both in the spring of 2021 and prior to the onset of the COVID-19 pandemic in 2020.

Partisans’ national satisfaction ratings typically shift with change in control of the White House: Democrats and Democratic leaners’ views improved markedly after the election and inauguration of President Joe Biden, though they have dropped since. Today, 35% of Democrats say they are satisfied with the state of the country, up modestly from earlier this year, but down from 47% in March of last year. By comparison, just 10% of Republicans express satisfaction with the way things are going in the country. GOP ratings are little changed over the last year but are substantially lower than they were throughout the Trump administration.

Chart shows Americans are more satisfied with state of their community than the country

In contrast to low satisfaction with the state of the nation, majorities of Americans provide positive assessments of how things are going in their own communities.

Nearly two-thirds of Americans (65%) are satisfied with the way things are going in their local community today, while 34% are dissatisfied. Republicans and Democrats are about equally likely to express satisfaction with the state of their local community, and there are relatively modest demographic differences in these evaluations. Majorities across demographic groups express satisfaction with the way things are going in their local communities.

About half of Americans (51%) say they are hopeful about the state of the country today, up from 46% in January but down slightly from late November 2020. As has been the case since Biden won the 2020 presidential election, Democrats (63%) are considerably more likely than Republicans (37%) to say they feel hopeful about the state of the country.

Chart shows Americans’ emotions about the state of the country are little changed since the fall of 2020

Overall, 49% of Americans are angry with how things are going in the country, slightly lower than the shares saying this in late 2020 (54%) and early 2022 (55%), and far lower than the 71% who said this in June 2020.

Over the last two years, the share of Republicans saying they are angry about the state of the country has remained relatively stable, with about six-in-ten saying this (62% say this today). By comparison, 40% of Democrats now say they feel angry thinking about the state of the country, down from 50% earlier this year, and down from nearly eight-in-ten (78%) in the summer of 2020.

Just over half of the U.S. public (56%) says they are fearful about the country, down slightly from recent years. Republicans (60%) are somewhat more likely than Democrats (54%) to say this.

Only about two-in-ten Americans say they are proud of the way things are going in this country, little changed since the summer of 2020. Democrats are slightly more likely than Republicans to report feeling proud today (26% vs. 17%). In 2020, Republicans were more likely than Democrats to say this (25% vs. 10%).

Confidence in the nation’s future and its ability to solve problems

Chart shows Democrats are more confident in the nation’s future than Republicans, though the gap is narrower than in 2021

Today, 68% of Americans say they have some or quite a lot of confidence in the future of the United States, similar to the shares saying this in both 2020 and 2021.
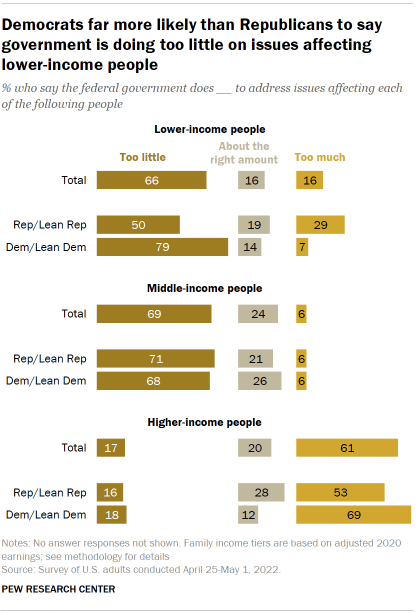
While overall attitudes about the future of the U.S. have remained steady, partisan views have shifted since before the 2020 election.

About six-in-ten Republicans and Republican-leaning independents (62%) say they have some or quite a lot of confidence in the future of the United States, a more positive evaluation than last year (54%). Still, Republicans express less confidence in the future of the country than they did in August of 2020 (76%).

Today, about three-quarters of Democrats and Democratic leaners (74%) express at least some confidence in the country’s future today. This is a 10 percentage point drop from last spring, but Democratic confidence in the future of the United States remains higher than it was in the summer of 2020 (58%).

Chart shows majority of Americans say ‘we can always find ways to solve our problems’

A majority of the public (57%) says “Americans can always find ways to solve our problems,” while 41% say “this country can’t solve many of its important problems.” Overall, public assessments of whether the country can solve the pressing problems it is facing are little changed over the last three years.

Republicans (63%) are more likely than Democrats (54%) to say Americans can always find ways to solve national problems. However, Democrats express somewhat more optimistic assessments today on this question than they did in 2019 and 2020.

Chart shows public split over whether there are solutions to big issues facing the country, Democrats are more optimistic than Republicans

Americans are split on whether there are clear solutions to big issues facing the country today: 48% say there are clear solutions to most of the big issues facing the country, while 52% say most big issues don’t have clear solutions.

Republicans are more likely than Democrats to say that there are clear solutions to big issues facing the country (57% vs. 42%).

Acknowledgments

This report is a collaborative effort based on the input and analysis of the following individuals:

Research team

Carroll Doherty, Director, Political Research
Jocelyn Kiley, Associate Director, Political Research
Baxter Oliphant, Senior Researcher
Andrew Daniller, Research Associate
Hannah Hartig, Research Associate
Luis Noe-Bustamante, Research Analyst
Amina Dunn, Research Analyst
Ted Van Green, Research Analyst
Vianney Gómez, Research Assistant

Communications and editorial

Nida Asheer, Communications Manager
Calvin Jordan, Communications Associate
Talia Price, Communications Assistant
Rebecca Leppert, Editorial Assistant

Graphic design and web publishing

Alissa Scheller, Information Graphics Designer
Reem Nadeem, Associate Digital Producer

Methodology

Andrew Mercer, Senior Research Methodologist
Nick Bertoni, Senior Panel Manager
Dorene Asare-Marfo, Research Methodologist
Arnold Lau, Research Methodologist

Methodology

The American Trends Panel survey methodology

Overview

The American Trends Panel (ATP), created by Pew Research Center, is a nationally representative panel of randomly selected U.S. adults. Panelists participate via self-administered web surveys. Panelists who do not have internet access at home are provided with a tablet and wireless internet connection. Interviews are conducted in both English and Spanish. The panel is being managed by Ipsos.

Data in this report is drawn from the panel wave conducted from April 25 to May 1, 2022, and included oversamples of Asian, Black and Hispanic Americans in order to provide more precise estimates of the opinions and experiences of these smaller demographic subgroups. These oversampled groups are weighted back to reflect their correct proportions in the population. A total of 5,074 panelists responded out of 5,897 who were sampled, for a response rate of 86%. The cumulative response rate accounting for nonresponse to the recruitment surveys and attrition is 3%. The break-off rate among panelists who logged on to the survey and completed at least one item is 1%. The margin of sampling error for the full sample of 5,074 respondents is plus or minus 2.0 percentage points.

Panel recruitment

Table shows American Trends Panel recruitment surveys

The ATP was created in 2014, with the first cohort of panelists invited to join the panel at the end of a large, national, landline and cellphone random-digit-dial survey that was conducted in both English and Spanish. Two additional recruitments were conducted using the same method in 2015 and 2017, respectively. Across these three surveys, a total of 19,718 adults were invited to join the ATP, of whom 9,942 (50%) agreed to participate.

In August 2018, the ATP switched from telephone to address-based recruitment. Invitations were sent to a stratified, random sample of households selected from the U.S. Postal Service’s Delivery Sequence File. Sampled households receive mailings asking a randomly selected adult to complete a survey online. A question at the end of the survey asks if the respondent is willing to join the ATP. Starting in 2020 another stage was added to the recruitment. Households that do not respond to the online survey are sent a paper version of the questionnaire, $5 and a postage-paid return envelope. A subset of the adults returning the paper version of the survey are invited to join the ATP. This subset of adults receive a follow-up mailing with a $10 pre-incentive and invitation to join the ATP.

Across the four address-based recruitments, a total of 19,822 adults were invited to join the ATP, of whom 17,472 agreed to join the panel and completed an initial profile survey. In each household, the adult with the next birthday was asked to go online to complete a survey, at the end of which they were invited to join the panel. Of the 27,414 individuals who have ever joined the ATP, 11,677 remained active panelists and continued to receive survey invitations at the time this survey was conducted.

The U.S. Postal Service’s Delivery Sequence File has been estimated to cover as much as 98% of the population, although some studies suggest that the coverage could be in the low 90% range.1 The American Trends Panel never uses breakout routers or chains that direct respondents to additional surveys.

Sample design

The overall target population for this survey was non-institutionalized persons ages 18 and older living in the U.S., including Alaska and Hawaii. It featured a stratified random sample from the ATP in which Black, Asian and Hispanic panelists were selected with certainty. The remaining panelists were sampled at rates designed to ensure that the share of respondents in each stratum is proportional to its share of the U.S. adult population to the greatest extent possible. Respondent weights are adjusted to account for differential probabilities of selection as described in the Weighting section below.

Questionnaire development and testing

The questionnaire was developed by Pew Research Center in consultation with Ipsos. The web program was rigorously tested on both PC and mobile devices by the Ipsos project management team and Pew Research Center researchers. The Ipsos project management team also populated test data that was analyzed in SPSS to ensure the logic and randomizations were working as intended before launching the survey.

Incentives

All respondents were offered a post-paid incentive for their participation. Respondents could choose to receive the post-paid incentive in the form of a check or a gift code to Amazon.com or could choose to decline the incentive. Incentive amounts ranged from $5 to $20 depending on whether the respondent belongs to a part of the population that is harder or easier to reach. Differential incentive amounts were designed to increase panel survey participation among groups that traditionally have low survey response propensities.

Data collection protocol

The data collection field period for this survey was April 25 to May 1, 2022. Postcard notifications were mailed to all ATP panelists with a known residential address on April 25. 

Invitations were sent out in two separate launches: Soft Launch and Full Launch. Sixty panelists were included in the soft launch, which began with an initial invitation sent on April 25, 2022. The ATP panelists chosen for the initial soft launch were known responders who had completed previous ATP surveys within one day of receiving their invitation. All remaining English- and Spanish-speaking panelists were included in the full launch and were sent an invitation on April 26.

All panelists with an email address received an email invitation and up to two email reminders if they did not respond to the survey. All ATP panelists that consented to SMS messages received an SMS invitation and up to two SMS reminders.

Table shows invitation and reminder dates

Data quality checks

To ensure high-quality data, the Center’s researchers performed data quality checks to identify any respondents showing clear patterns of satisficing. This includes checking for very high rates of leaving questions blank, as well as always selecting the first or last answer presented. As a result of this checking, six ATP respondents were removed from the survey dataset prior to weighting and analysis.

Weighting

The ATP data is weighted in a multistep process that accounts for multiple stages of sampling and nonresponse that occur at different points in the survey process. First, each panelist begins with a base weight that reflects their probability of selection for their initial recruitment survey.  The base weights for panelists recruited in different years are scaled to be proportionate to the effective sample size for all active panelists in their cohort and then calibrated to align with the population benchmarks in the accompanying table to correct for nonresponse to recruitment surveys and panel attrition. If only a subsample of panelists was invited to participate in the wave, this weight is adjusted to account for any differential probabilities of selection.

Table shows weighting dimensions

Among the panelists who completed the survey, this weight is then calibrated again to align with the population benchmarks identified in the accompanying table and trimmed at the 1st and 99th percentiles to reduce the loss in precision stemming from variance in the weights. Sampling errors and tests of statistical significance take into account the effect of weighting.

Some of the population benchmarks used for weighting come from surveys conducted prior to the coronavirus outbreak that began in February 2020. However, the weighting variables for panelists recruited in 2021 were measured at the time they were recruited to the panel. Likewise, the profile variables for existing panelists were updated from panel surveys conducted in July or August 2021.
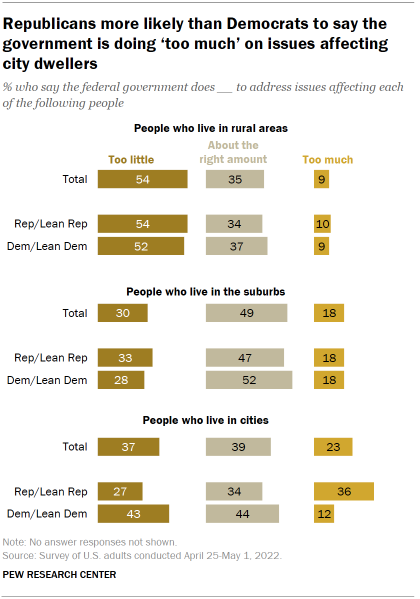
This does not pose a problem for most of the variables used in the weighting, which are quite stable at both the population and individual levels. However, volunteerism may have changed over the intervening period in ways that made their 2021 measurements incompatible with the available (pre-pandemic) benchmarks. To address this, volunteerism is weighted using the profile variables that were measured in 2020. For all other weighting dimensions, the more recent panelist measurements from 2021 are used.

For panelists recruited in 2021, plausible values were imputed using the 2020 volunteerism values from existing panelists with similar characteristics. This ensures that any patterns of change that were observed in the existing panelists were also reflected in the new recruits when the weighting was performed.

The following table shows the unweighted sample sizes and the error attributable to sampling that would be expected at the 95% level of confidence for different groups in the survey.

Table shows unweighted sample sizes and error attributable

Note: This survey includes oversamples of Asian, Black and Hispanic respondents. Unweighted sample sizes do not account for the sample design or weighting and do not describe a group’s contribution to weighted estimates. See the Sample design and Weighting sections above for details.

Sample sizes and sampling errors for other subgroups are available upon request. In addition to sampling error, one should bear in mind that question wording and practical difficulties in conducting surveys can introduce error or bias into the findings of opinion polls.

Dispositions and response rates

Table shows dispositions
Table shows response rates

Adjusting income and defining income tiers

To create upper-, middle- and lower-income tiers, respondents’ 2020 family incomes were adjusted for differences in purchasing power by geographic region and household size. “Middle-income” adults live in families with annual incomes that are two-thirds to double the median family income in the panel (after incomes have been adjusted for the local cost of living and household size). The middle-income range for the American Trends Panel is about $42,000 to $125,900 annually for an average family of three. Lower-income families have incomes less than roughly $42,000, and upper-income families have incomes greater than roughly $125,900 (all figures expressed in 2020 dollars).

Based on these adjustments, 33% of respondents are lower income, 45% are middle income and 16% fall into the upper-income tier. An additional 6% either didn’t offer a response to the income question or the household size question.

For more information about how the income tiers were determined, please see here.

© Pew Research Center, 2022