Public’s Top Priority for 2022: Strengthening the Nation’s Economy
Dealing with coronavirus has declined as a policy priority, especially among Republicans
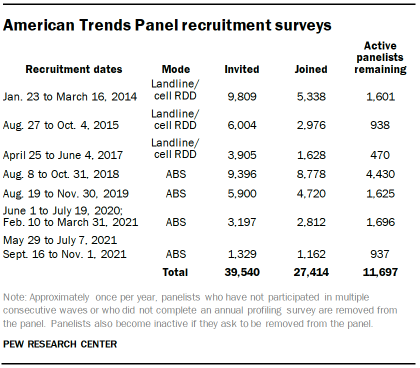
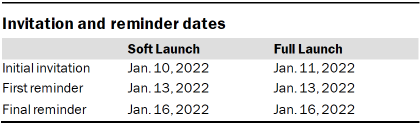
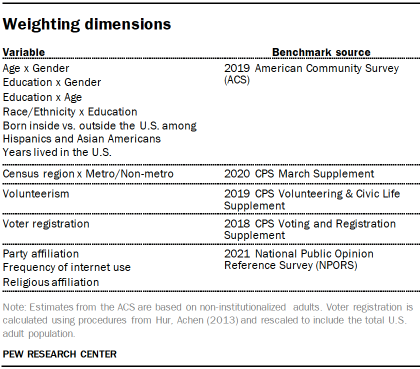
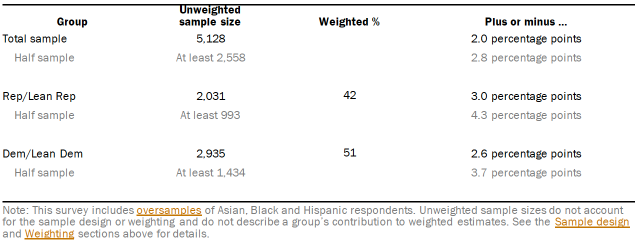
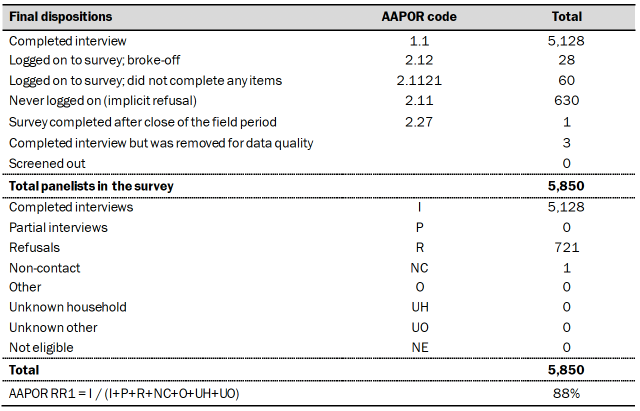
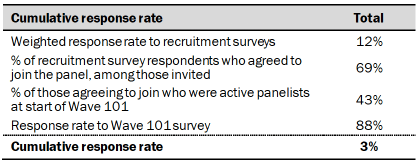
Pew Research Center conducted this study to understand which issues the public views as most important for the president and Congress to prioritize in the coming year. For this analysis, we surveyed 5,128 U.S. adults in January 2022. Everyone who took part in this survey is a member of the Center’s American Trends Panel (ATP), an online survey panel that is recruited through national, random sampling of residential addresses. This way nearly all U.S. adults have a chance of selection. The survey is weighted to be representative of the U.S. adult population by gender, race, ethnicity, partisan affiliation, education and other categories. Read more about the ATP’s methodology.
Here are the questions used for the report, along with responses, and its methodology.

As the coronavirus pandemic enters its third year, more Americans view strengthening the U.S. economy as a top policy priority than say the same about dealing with COVID-19.
This marks a shift from last year, when the economy and the coronavirus both topped the public’s policy agenda.
At a time when Americans rate several issues as lower priorities than they did a year ago, the decline in the share citing the pandemic has been particularly steep: 60% now view dealing with the coronavirus as a top policy priority, down from 78% last year.
Currently, 71% of U.S. adults rate strengthening the economy as a top policy priority, followed by reducing health care costs (61%), addressing the coronavirus (60%), improving education (58%) and securing Social Security (57%) – according to a Pew Research Center survey of 5,128 adults conducted Jan. 10-17, 2022, on the nationally representative American Trends Panel. Smaller shares view seven of the 18 items included in the survey as top policy priorities than did so last year (four items increased).
The public’s policy agenda reflects continued concerns over the economy. With inflation at a four-decade high, large majorities of Americans say prices for food and consumer goods (89%), gas prices (82%) and the cost of housing (79%) are worse than they were a year ago. Only 28% rate economic conditions as excellent or good.
Still, fewer Americans cite strengthening the economy as a top priority than did so in 2021 (71% now vs. 80% then), and there has been a sizable decline in concern about jobs. Only about half of Americans view improving the job situation as a top priority (52%), compared with 67% last year. Prior to the COVID-19 outbreak in 2020, there had been a long-term decline in the shares citing the economy and jobs as top policy priorities.
As in the past, Republicans and Democrats differ on the importance of most policy priorities, but the partisan gaps have widened significantly for 11 of the 18 items included in the survey – including double-digit increases in partisan differences on dealing with immigration, improving the political system, improving the job situation and addressing issues within the criminal justice system.
Among those items that rank near the bottom on the 18-item priorities list today are addressing issues around race (37% top priority), strengthening the military (also 37%), dealing with global trade (35%) and dealing with drug addiction (31%). Notably, majorities rate all of these policy goals either as a “top priority” for the president and Congress or as “an important but lower priority”; for each, relatively small shares say they are “not too important” or “should not be done.” (For a closer look at the top policy priorities of partisan and demographic groups, see the detailed tables accompanying this report).
Changing public priorities: Economy, coronavirus, jobs

While the economy continues to lead the public’s list of priorities, there has been a decline in the share of Americans, especially Democrats, who view it as a top policy priority. The share of Democrats and independents who lean toward the Democratic Party who say strengthening the economy should be a top priority has fallen from 75% a year ago to 63% today.
By contrast, there has been almost no change in views among Republicans and GOP leaners (85% top priority then, 82% today).
Democrats also are less likely to rate improving the job situation as a top priority than they did last January, before President Joe Biden took office. Last year, 71% of Democrats said jobs should be a top priority; today, only about half of Democrats say this (49%). The decline has been more modest among Republicans (from 63% to 55%).
Dealing with the coronavirus outbreak is viewed as a less important priority than last year. A year ago, 78% of the public said it was a top priority; today, that share has fallen to 60%. The decline is steeper among Republicans than Democrats – 60% said the pandemic was a top priority a year ago compared with 35% today – but fewer Democrats also still view it as a major priority (93% last year, 80% now).
Republicans are more likely to rate dealing with immigration and reducing the budget deficit as top priorities than did so last year, while there has been little change in views on the importance of these issues among Democrats.

A year ago, identical shares of Republicans and Democrats (39% each) said dealing with the issue of immigration should be a top priority. Today, two-thirds of Republicans (67%) view immigration as a top priority, compared with just 35% of Democrats.
The share of Republicans who prioritize reducing the budget deficit also increased from 54% to 63%, while holding stable among Democrats (29% then vs. 31% now).
Other issues have declined as policy priorities among members of both parties since last year. The share of Americans who say addressing issues around race should be a top priority for the president and Congress has fallen from 49% to 37%. Currently, 53% of Democrats say addressing issues around race should be a top priority, compared with 72% who said the same last year. Among Republicans, who were far less likely than Democrats to rate this as a priority, there has been a 10 percentage point decline in the share rating it as a top priority (24% to 14%).
Dealing with the problems of poor people has declined as a policy priority as well. Both Republicans (25% now vs. 35% in 2021) and Democrats (58% now vs. 68% then) are now less likely to see dealing with the problems low-income families face as a top priority – though Democrats continue to prioritize this policy area far more than Republicans.
There also has been a decline in the share of the public saying that improving the political system should be a top policy priority, largely driven by Republicans. Last year, there was essentially no difference between the shares in each party who viewed improving the political system as a top priority (64% of Democrats and 60% of Republicans). Now, just 40% in the GOP say this should be a top priority, compared with 61% of Democrats.
Widest partisan gaps on addressing climate change and the coronavirus
While there are wide partisan differences on most priorities, 82% of Republicans and a smaller majority of Democrats (63%) say strengthening the economy should be a top priority for the president and Congress. Among 18 items, the economy is by far the leading priority among Republicans and is among the leading priorities for Democrats.

Comparable shares in both parties also say taking steps to make the Social Security system financially sound (58% of Republicans, 56% of Democrats) and dealing with drug addiction (32% of Democrats, 27% of Republicans) should be top priorities.
On most other issues, however, there are substantial partisan differences – especially on dealing with global climate change and the coronavirus outbreak. Large majorities of Democrats say both should be top priorities (80% coronavirus, 65% climate change) compared with just 35% and 11% of Republicans, respectively.
Beyond the economy, Republicans say the president and Congress should prioritize dealing with immigration (67%), defending against terrorism (65%), reducing the budget deficit (63%) and reducing crime (60%).
Republicans are, on average, about 25 points more likely than Democrats to say each of these issues should be at the top of the national policy agenda.
In addition to strengthening the economy, Democrats’ leading priorities are dealing with the coronavirus (80%), reducing health care costs (69%), improving education (66%) and dealing with global climate change (65%). These issues are far less salient for Republicans: Democrats are on average about 33 points more likely than Republicans to rate each as a top priority.
Policy priorities of Black, Hispanic and White Americans
Across racial and ethnic lines, strengthening the economy ranks near the top of the policy agenda. About seven-in-ten White (72%), Black (69%) and Hispanic (70%) adults say this should be a top priority this year.

But there are significant differences in the importance of a number of other issues, especially addressing issues around race, dealing with the problems of poor people and addressing the criminal justice system.
Black adults (66%) are more likely than either White (27%) or Hispanic adults (47%) to say that addressing issues around race should be a top priority.
In addition, about two-thirds of Black adults say dealing with the problems associated with poverty (68%) and criminal justice reform (67%) should get top priority this year, compared with around four-in-ten White adults who say this for both issues. Hispanic Americans express views closer to Black adults on dealing with poverty (55% of Hispanic adults say it should be top priority), but their views are closer to those of White adults on criminal justice reform (48%).

Among Democrats and Democratic leaners, Black adults are more likely than White or Hispanic adults to rate a number of issues as top policy priorities.
For example, 70% of Black Democrats rate reducing crime as a top priority, compared with 56% of Hispanic Democrats and just 34% of White Democrats. Black Democrats (71%) also are almost twice as like as White Democrats (38%) to say that addressing the criminal justice system should be a top priority; 53% of Hispanic Democrats see this as a major priority.
Dealing with climate change is the only issue which White Democrats (68%) are more likely than Black Democrats (58%) to view as a top priority.
Age and policy priorities

There are wide age differences in views of policy priorities, with older adults more likely than younger people to rate several policy priorities as more important.
There are some exceptions to this pattern, however. For example, adults under 30 (54%) are more likely to say global climate change should be a top priority than older age groups.
The widest gaps between older and younger adults are on strengthening the military and defending against terrorism. About half of adults ages 50 and older (52%) say that strengthening the military should be a top priority. Just 10% of adults under age 30 say the same. Similarly, about three-quarters of adults ages 65 and older say that defending against terrorism should be a top priority, compared with about a third of those under 30. Within both parties, older Americans are more likely to prioritize defense issues (see detailed tables).
Older adults are also more likely than younger adults to prioritize dealing with immigration, securing Social Security and strengthening the economy.

While the share of the public who says that dealing with the coronavirus outbreak should be a top priority has fallen in the last year, this decline is larger among younger Americans.
A year ago, three-quarters of adults under 50 said dealing with the coronavirus should be a top priority; today, about half (54%) say the same. There has been a similar decline among adults ages 50 to 64 who view COVID-19 as a top priority (80% in 2021, 61% today).
Older Americans are only somewhat less likely to say that dealing with the pandemic should be a top priority (80% a year ago, 72% today).
While there is a large partisan gap in views of the coronavirus as a top priority, there are also age differences within each party. Older adults in each party are generally more likely to prioritize the coronavirus than younger ones.
Today, Republicans across all ages are at least 20 points less likely than they were a year ago to say that dealing with the coronavirus outbreak should be a top priority. However, Republicans ages 65 and older are somewhat more likely to rate dealing with the coronavirus as a top goal than Republicans under 65 (44% vs. 32%).
While overwhelming majorities of Democrats ages 65 and older are as likely to say that dealing with the coronavirus should be a top priority as they were a year ago, younger Democrats are less likely to say this over the same timespan. Democrats under 50 are 17 points less likely to rate dealing with COVID-19 as a top priority (90% then, 73% now) and Democrats ages 50 to 64 are 14 points less likely to say this (99% then, 85% now).
Gender and policy priorities

Women place a higher priority than men on several policy goals, especially around the coronavirus and dealing with the problems of poor people.
Nearly two-thirds of women (65%) say that dealing with the coronavirus outbreak should be a top priority for the president and Congress this year. A smaller share of men (54%) say the same.
About half of women also say that dealing with the issue of poverty should be a top priority, while men are 10 points less likely to say this.
Larger shares of women than men also say reducing health care costs, improving education, addressing issues around race and dealing with drug addiction should be top priorities in the year ahead.
There are three topics – dealing with global trade issues, reducing the budget deficit and dealing with immigration – that men view as higher priorities than do women.
Education and policy priorities
There are substantial differences in views of policy priorities by education. Adults who do not have a four-year college degree are more likely to view several goals as top policy priorities.

Roughly four-in-ten Americans without a college degree (42%) say that strengthening the military should be a top priority, compared with about a quarter (26%) of those with a college degree.
Similarly, nearly two-thirds of those without a college degree (63%) say securing Social Security should be a top priority for the president and Congress. Less than half of those with a college degree (44%) say that issue should be a top priority.
Adults with less formal education are also more likely to prioritize many of these issues as top priorities, such as defending against terrorism, reducing crime, dealing with drug addiction, improving the job situation and reducing the budget deficit.
There are two issues – dealing with the coronavirus outbreak and dealing with climate change – where those with more formal education are more likely to say this issue should be a top priority.