Pew Research Center

FOR RELEASE NOVEMBER 9, 2021

Beyond Red vs. Blue: The Political Typology

Even in a polarized era, deep divisions in both partisan coalitions

FOR MEDIA OR OTHER INQUIRIES:

Communications Department
202.419.4372
www.pewresearch.org

RECOMMENDED CITATION

Pew Research Center, November 2021, "Beyond Red vs. Blue: The Political Typology"

About Pew Research Center

Pew Research Center is a nonpartisan, nonadvocacy fact tank that informs the public about the issues, attitudes and trends shaping the world. It does not take policy positions. The Center conducts public opinion polling, demographic research, computational social science research and other data-driven research. It studies politics and policy; news habits and media; the internet and technology; religion; race and ethnicity; international affairs; social, demographic and economic trends; science; research methodology and data science; and immigration and migration. Pew Research Center is a subsidiary of The Pew Charitable Trusts, its primary funder.

© Pew Research Center 2026

Table of contents

  • About Pew Research Center
  • Beyond Red vs. Blue: The Political Typology
  • 1. The Republican coalition
  • 2. The Democratic coalition
  • 3. Faith and Flag Conservatives
  • 4. Committed Conservatives
  • 5. Populist Right
  • 6. Ambivalent Right
  • 7. Stressed Sideliners
  • 8. Outsider Left
  • 9. Democratic Mainstays
  • 10. Establishment Liberals
  • 11. Progressive Left
  • 12. Political engagement among typology groups
  • 13. How the political typology groups view major issues
  • 14. Demographics and lifestyle differences among typology groups
  • Acknowledgments
  • Appendix A: Survey methodology
  • Appendix B: Typology group creation and analysis

Beyond Red vs. Blue: The Political Typology

Even in a polarized era, deep divisions in both partisan coalitions

How we did this

Pew Research Center conducted this study to learn more about the complexity of the current political environment. While partisanship remains the dominant factor in politics, we sought to identify the fissures within both partisan coalitions. We did this by creating a political typology, which classifies the public into nine distinct groups based on their political values and attitudes. To learn more about the political typology, including its history and the statistical methods used to create the typology, see “Behind Pew Research Center’s 2021 Political Typology.”

The study is primarily based on a survey of 10,221 adults conducted on Pew Research Center’s nationally representative American Trends Panel (ATP) from July 8-18, 2021; it also draws from several additional interviews with these respondents conducted since January 2020 (for more on the surveys used for analysis, see Appendix B and the detailed tables.

Everyone who took part in this survey is a member of the ATP, an online survey panel that is recruited through national, random sampling of residential addresses. This way nearly all U.S. adults have a chance of selection. The survey is weighted to be representative of the U.S. adult population by gender, race, ethnicity, partisan affiliation, education and other categories. Read more about the ATP’s methodology.

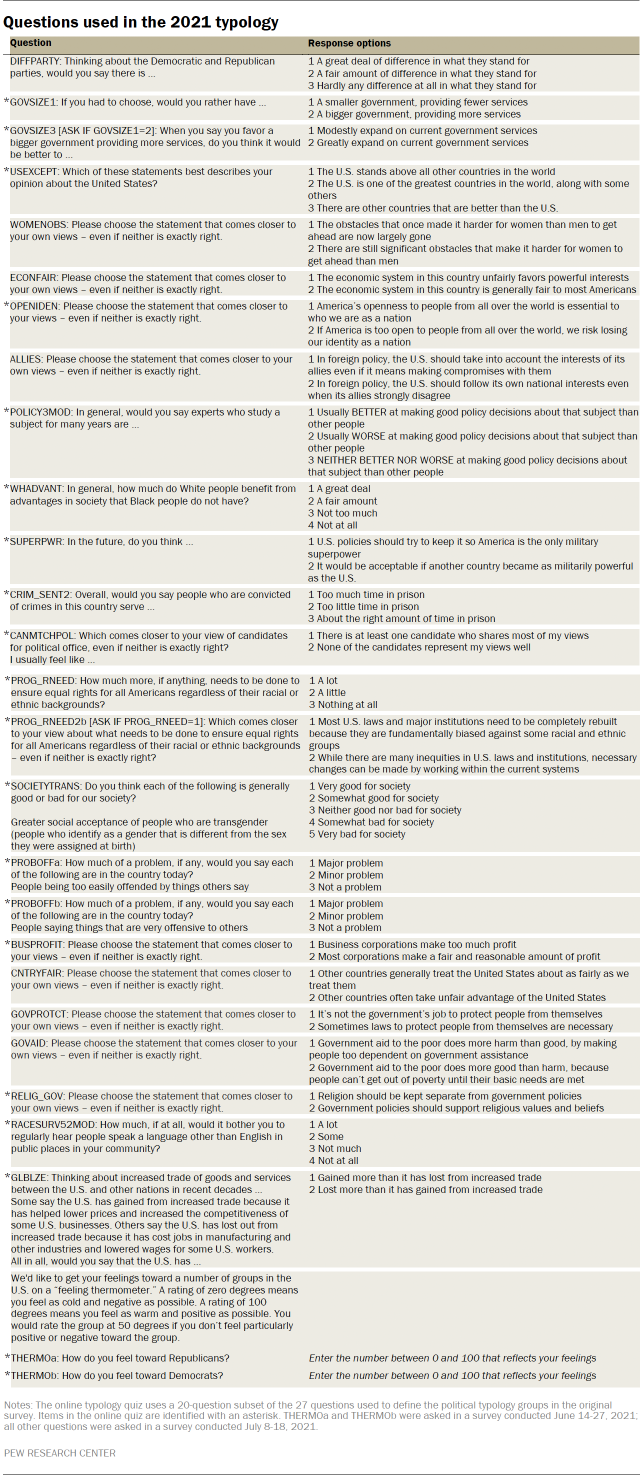
Here are the questions used in the main typology survey, along with responses, and the survey methodology.

Note: For a new and fully revised version of Pew Research Center’s political typology (published June 2026), read “Beyond Red vs. Blue: The 2026 Political Typology.”

Partisan polarization remains the dominant, seemingly unalterable condition of American politics. Republicans and Democrats agree on very little – and when they do, it often is in the shared belief that they have little in common.
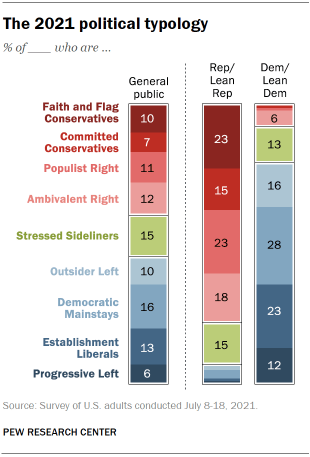
Chart shows the 2021 political typology

Yet the gulf that separates Republicans and Democrats sometimes obscures the divisions and diversity of views that exist within both partisan coalitions – and the fact that many Americans do not fit easily into either one.

Republicans are divided on some principles long associated with the GOP: an affinity for businesses and corporations, support for low taxes and opposition to abortion. Democrats face substantial internal differences as well – some that are long-standing, such as on the importance of religion in society, others more recent. For example, while Democrats widely share the goal of combating racial inequality in the United States, they differ on whether systemic change is required to achieve that goal.

These intraparty disagreements present multiple challenges for both parties: They complicate the already difficult task of governing in a divided nation. In addition, to succeed politically, the parties must maintain the loyalty of highly politically engaged, more ideological voters, while also attracting support among less engaged voters – many of them younger – with weaker partisan ties.

Pew Research Center’s new political typology provides a road map to today’s fractured political landscape. It segments the public into nine distinct groups, based on an analysis of their attitudes and values. The study is primarily based on a survey of 10,221 adults conducted July 8-18, 2021; it also draws from several additional interviews with these respondents conducted since January 2020.

This is the Center’s eighth political typology since 1987, but it differs from earlier such studies in several important ways. It is the first typology conducted on Pew Research Center’s nationally representative American Trends Panel, which provides the benefit of a large sample size and the ability to include a wealth of other political data for the analysis, including the Center’s validated voter study.


Take the Typology quiz


The four Democratic-oriented typology groups highlight the party’s racial and ethnic diversity, as well as the unwieldy nature of the current Democratic coalition. (For complete descriptions of all nine typology groups see Chapters 3-11; for profiles of the Democratic and Republican coalitions see Chapters 1 and 2 of this report.)

They include two very different groups of liberal Democrats: Progressive Left and Establishment Liberals. Progressive Left, the only majority White, non-Hispanic group of Democrats, have very liberal views on virtually every issue and support far-reaching changes to address racial injustice and expand the social safety net. Establishment Liberals, while just as liberal in many ways as Progressive Left, are far less persuaded of the need for sweeping change.

Two other Democratic-aligned groups could not be more different from each other, both demographically and in their relationship to the party. Democratic Mainstays, the largest Democratic-oriented group, as well as the oldest on average, are unshakeable Democratic loyalists and have a moderate tilt on some issues. Outsider Left, the youngest typology group, voted overwhelmingly for Joe Biden a year ago and are very liberal in most of their views, but they are deeply frustrated with the political system – including the Democratic Party and its leaders.

The four Republican-oriented groups include three groups of conservatives: Faith and Flag Conservatives are intensely conservative in all realms; they are far more likely than all other typology groups to say government policies should support religious values and that compromise in politics is just “selling out on what you believe in.” Committed Conservatives also express conservative views across the board, but with a somewhat softer edge, particularly on issues of immigration and America’s place in the world. Populist Right, who have less formal education than most other typology groups and are among the most likely to live in rural areas, are highly critical of both immigrants and major U.S. corporations.

Ambivalent Right, the youngest and least conservative GOP-aligned group, hold conservative views about the size of government, the economic system and issues of race and gender. But they are the only group on the political right in which majorities favor legal abortion and say marijuana should be legal for recreational and medical use. They are also distinct in their views about Donald Trump – while a majority voted for him in 2020, most say they would prefer he not continue to be a major political figure.

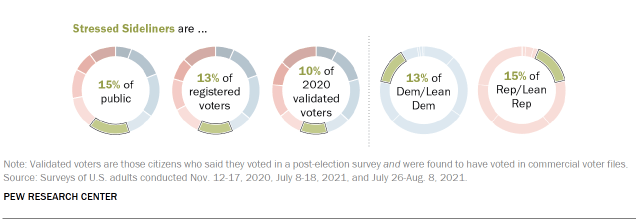
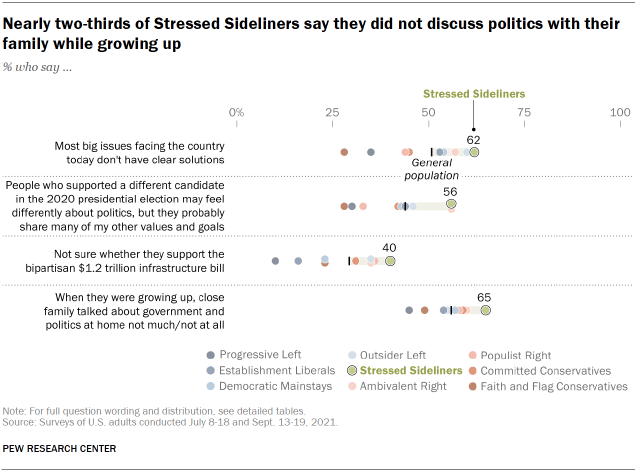
The only typology group without a clear partisan orientation – Stressed Sideliners – also is the group with the lowest level of political engagement. Stressed Sideliners, who make up 15% of the public but constituted just 10% of voters in 2020, have a mix of conservative and liberal views but are largely defined by their minimal interest in politics.

Here are the main findings from the new political typology:
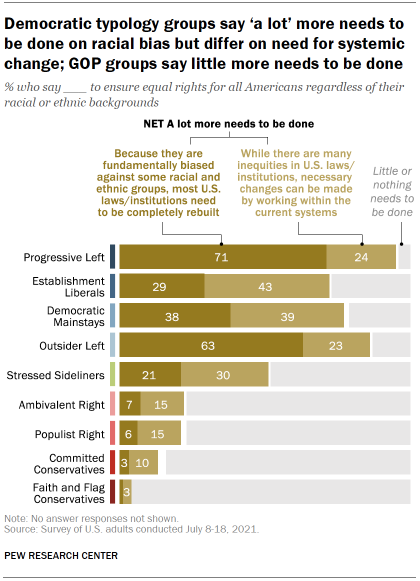
Chart shows Democratic typology groups say ‘a lot’ more needs to be done on racial bias but differ on need for systemic change; GOP groups say little more needs to be done

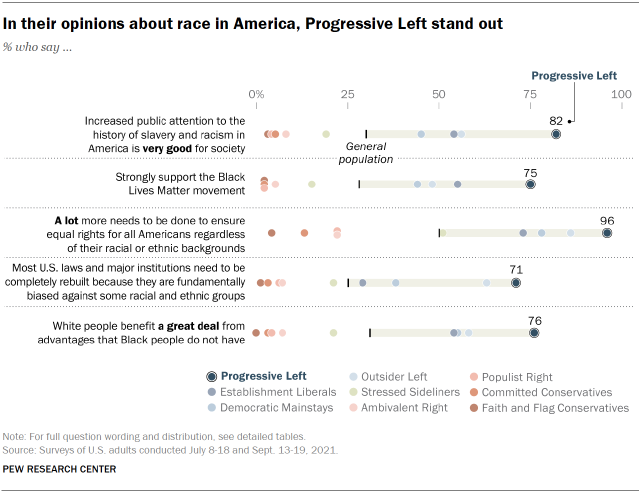
Racial injustice remains a dividing line in U.S. politics. Perhaps no issue is more divisive than racial injustice in the U.S. Among the four Republican-oriented typology groups, no more than about a quarter say a lot more needs to be done to ensure equal rights for all Americans regardless of their racial or ethnic background; by comparison, no fewer than about three-quarters of any Democratic group say a lot more needs to be done to achieve this goal. However, Democrats differ over whether the changes to ensure equal rights for all can be achieved by working within the current system, or whether most laws and institutions need to be completely rebuilt. Progressive Left and Outsider Left are far more likely than the two other Democratic groups to say systemic change is needed to combat racial bias.

Democrats prefer bigger government – but how big? There are much bigger divides between parties than within them on opinions about the size of government. Democratic-aligned groups overwhelmingly prefer a bigger government providing more services; GOP groups, by similar margins, favor smaller government. But when asked if government services should be greatly expanded from current levels, Democrats are divided: A clear majority of Progressive Left (63%) favor greatly expanding government services, compared with about a third in other Democratic-oriented groups.
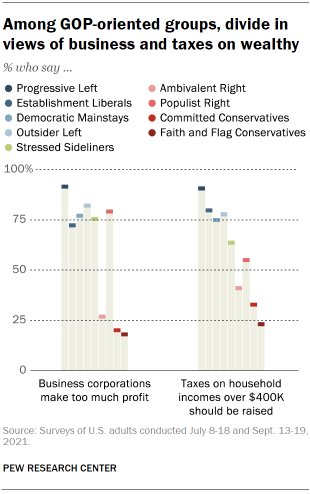
Chart shows among GOP-oriented groups, divide in views of business and taxes on wealthy

Economic policy – including taxes – divides the GOP. As noted, Populist Right diverge sharply from traditional GOP positions with their very negative views of corporations; just 17% say most corporations make a fair profit, which places this conservative group much closer to Democratic groups than to their Republican counterparts. And a majority of Populist Right (56%) favor raising taxes on household incomes above $400,000, as do 42% of Ambivalent Right (and substantial majorities in all Democratic-aligned groups).

Republicans’ complicated views of Trump. The Republican-oriented typology groups each supported Trump by wide margins in 2020. Yet the survey shows substantial differences among GOP groups over Trump’s future political role. In two of the four groups – Faith and Flag Conservatives and Populist Right – majorities want Trump to remain a major political figure and run for president again in 2024. And only among Populist Right does a clear plurality view Trump as the best president of the past 40 years. Among other Republican-aligned groups, more either view Ronald Reagan as the best recent president (Committed Conservatives, Ambivalent Right), or are divided between Reagan and Trump (Faith and Flag Conservatives).

Stark differences among typology groups on U.S. global standing. When asked whether the U.S. is superior to all other countries, it is among the greatest countries, or there are other countries that are better, there is relative agreement across six of nine typology groups: About half or more in this very ideologically mixed set of groups – including Establishment Liberals and Populist Right – say the U.S. is among the greatest countries in the world. Faith and Flag Conservatives are the only group in which a majority (69%) says the U.S. stands above all other countries. Conversely, Progressive Left (75%) and Outsider Left (63%) are the only typology groups in which majorities say there are other countries better than the U.S.
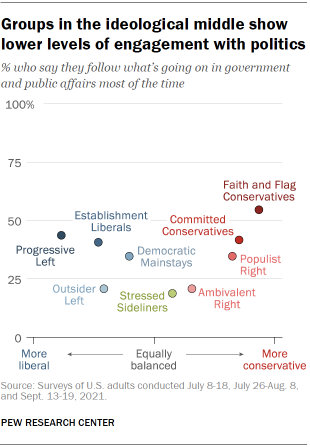
Chart shows groups in the ideological middle show lower levels of engagement with politics

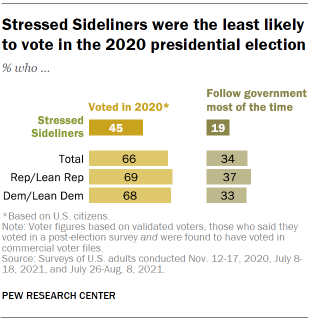
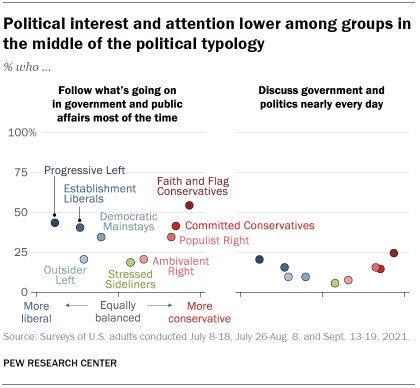
Is there a ‘middle’ in politics today? Surveys by Pew Research Center and other national polling organizations have found broad support, in principle, for a third major political party. Yet the typology study finds that the three groups with the largest shares of self-identified independents (most of whom lean toward a party) – Stressed Sideliners, Outsider Left and Ambivalent Right – have very little in common politically. Stressed Sideliners hold mixed views; Ambivalent Right are conservative on many economic issues, while moderate on some social issues; and Outsider Left are very liberal on most issues, especially on race and the social safety net. What these groups do have in common is relatively low interest in politics: They had the lowest rates of voting in the 2020 presidential election and are less likely than other groups to follow government and public affairs most of the time.

1. The Republican coalition

Note: For a new and fully revised version of Pew Research Center’s political typology (published June 2026), read “Beyond Red vs. Blue: The 2026 Political Typology.”

Chart shows the Republican coalition: A snapshot

The Republican-aligned groups in the political typology are united by shared preferences for a smaller role for the federal government, a strong U.S. military and a rejection of the view that the country needs to do a great deal more to address racial inequities. But when it comes to several other issue areas – particularly views of economic fairness, immigration and foreign policy – there are stark differences between several groups under the GOP umbrella.

Although GOP-oriented groups generally are united in placing importance on securing U.S. borders, groups within the coalition hold starkly different views about the extent to which illegal immigration is a problem in the country, as well as over the nation’s approach to legal immigration.

And there is a cleavage in the coalition around views of the economic system itself: Two typology groups who both hold highly restrictive views about immigration – Faith and Flag Conservatives and Populist Right – differ over corporate power, economic inequality and taxation of large businesses and wealthy individuals.

Ambivalent Right, the youngest GOP-oriented group, diverge from other groups in the coalition in both their weak attachment to the party and their more moderate views on social issues like same-sex marriage, abortion and marijuana legalization. At the same time, Faith and Flag Conservatives, one of the oldest segments of the party coalition, are characterized by a strong Christian affiliation, extremely conservative social views and a view that government policies should bolster religious values and beliefs.

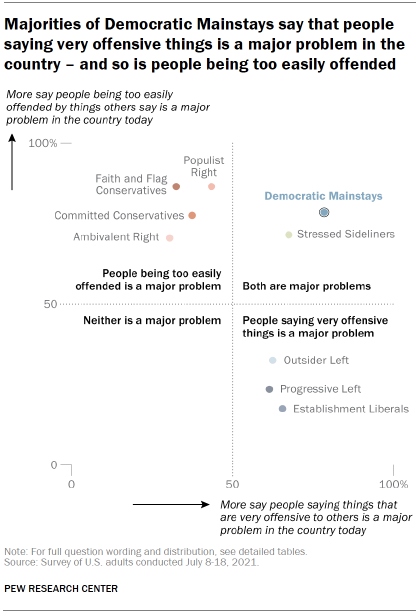
Still, GOP-oriented groups are more united than divided over issues related to race and gender: For example, majorities across the Republican coalition say that the country has made a lot of progress on addressing racial and ethnic inequality over the last 50 years and that, looking forward, little or nothing more needs to be done. Similarly, most reject the contention that White people in America benefit from societal advantages that Black people do not have. In the same vein, majorities across GOP-oriented groups say that “people too easily taking offense to things others say” is a major problem for the country, while far fewer think that “people saying things that are very offensive to others” is a major problem.

Chart shows Faith and Flag Conservatives more likely than other GOP-aligned groups to say they are ‘very conservative’

The most deeply conservative group in the political typology – Faith and Flag Conservatives– make up 23% of Republicans and independents who lean toward the Republican Party, making them one of the two largest groups in the GOP coalition. Conservative across the board, they are one of the most politically engaged typology groups. Fully 88% of Faith and Flag Conservatives say their political views are conservative, including 35% who describe themselves as “very conservative.” They are overwhelmingly White and Christian and stand out for their views on the role of religion in public life. They are among Donald Trump’s strongest supporters – both while he was in office and today. Most say Trump definitely or probably is the legitimate winner of the 2020 election, despite official counts showing that Joe Biden was the legitimate winner. And 79% say there has been too much attention paid to the Jan. 6 riot at the U.S. Capitol.

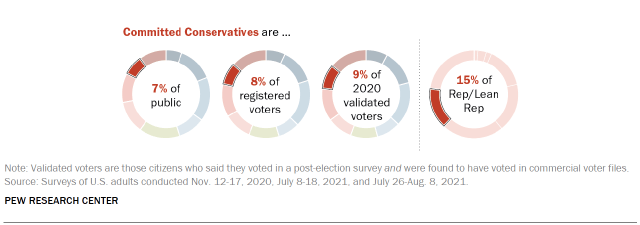
Committed Conservatives are one of the two smallest groups in the political typology; they constitute 15% of Republicans and Republican leaners. They are loyal Republicans with pro-business views and are staunch advocates of limited government; most (73%) identify as conservative. However, they differ from Faith and Flag Conservatives and Populist Right in prioritizing U.S. relationships with allies in foreign policy and in taking a less restrictive approach to immigration. While they hold positive views of Trump and nearly all voted for him in 2020, they are not nearly as enthusiastic about the former president as the two other conservative groups. And when asked to name the best president of the last 40 years, they are much more likely to say Ronald Reagan than any of his successors.

Chart shows only half of Ambivalent Right say the GOP represents them well

Populist Right – 23% of Republicans and Republican leaners – are one of the two largest groups in the GOP coalition, along with Faith and Flag Conservatives. They also are deeply conservative and reliably vote Republican. Yet they differ from Committed Conservative on two key dimensions: They hold hard-line immigration views and are highly critical of the economic system. They are the sole Republican-oriented group in which majorities say the economic system in the country unfairly favors powerful interests, that businesses in this country make too much profit and that taxes on household income over $400,000 should be raised. Like Faith and Flag Conservatives, Populist Right strongly support Trump, and most (81%) would like him to remain a prominent political figure, including 57% who say he should run for president in 2024.

The other Republican-oriented group in the political typology – Ambivalent Right – also are the only GOP coalition group in which most do not identify as politically conservative. With their combination of political values, they are cross-pressured politically: While they hold nearly down-the-line conservative views about the size of government and the economic system and lean more right than left on issues of race and gender, they are far more moderate on immigration and on social issues like abortion, same-sex marriage and marijuana legalization.

Chart shows most Ambivalent Right say they usually feel like no political candidates represent their views well

Reflecting this cross pressure, a quarter of Ambivalent Right identify as Democrats or Democratic leaners. Still, Ambivalent Right make up 18% of all Republicans and Republican leaners. They are considerably younger than those in other GOP-oriented groups and less politically engaged. They are much less likely than other groups in the coalition to say the Republican Party represents them well or to feel like they have options to vote for political candidates who represent their views. And, unlike those in other GOP-oriented groups, they have more negative than positive feelings about Trump, with 63% saying they would prefer he not remain a major national political figure.

Stressed Sideliners, despite not having a clear partisan tilt, make up small but significant shares of both the Republican and Democratic coalitions (15% of Republicans and Republican leaners, 13% of Democrats and Democratic leaners). This group is financially stressed and relatively unengaged with politics.

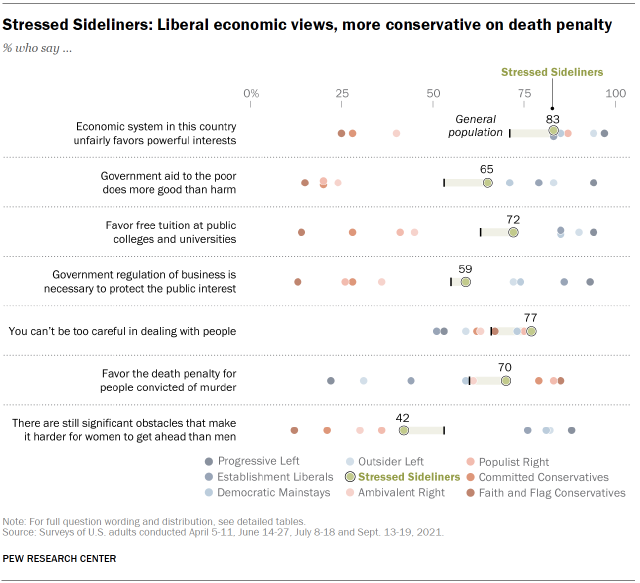
They generally have attitudes that place them near the center of overall public opinion, tilting more conservative than liberal on some social issues and more liberal than conservative on economic issues. And while they vote at significantly lower rates than other typology groups, 43% of them cast ballots in 2020 – with roughly half of them voting for Trump.

An additional 6% of Republicans and Republican leaners belong to a Democratic-oriented typology group. These are individuals who lean Republican but whose values and attitudes are more aligned with a group whose other members tend to be affiliated with the Democratic Party. (Similarly, 8% of Democrats and Democratic leaners belong to Republican-oriented typology groups.)

Areas of general agreement within the Republican coalition

Two-thirds or more of those in all four Republican-oriented groups share a belief that government is doing too many things that would be better left to individuals and the private sector, and there is a widespread belief that individuals are responsible for their own success.

The GOP coalition also generally shares an outlook that historical obstacles faced by women and people who are not White are now largely gone: At least six-in-ten across all GOP-aligned groups say that obstacles that once made it harder for women than men to get ahead are now largely gone, and comparably large majorities say that the country has made a lot of progress over the past 50 years in ensuring equal rights for all Americans regardless of race and ethnicity.

Chart shows areas of agreement within the GOP coalition: Support for limited government, belief in an individual’s ability to succeed and rejection of White privilege

The Republican-oriented typology groups also widely favor policies aimed at making sure that the United States remains the world’s sole military superpower. And while they differ over whether the size of the U.S. military should be increased or kept at its current size, they largely reject reductions in the size of the military. No more than about one-in-ten say the size of the military should be reduced. Note: For full question wording and distribution on each question, see detailed tables.

Political values and issues: Where there are divides in the GOP coalition

There are a number of issues that divide Republican-oriented groups in the political typology, and different sets of issues split the GOP coalition in different ways.

Chart shows issues that divide the GOP coalition: Corporate profits, same-sex marriage, compromise with U.S. allies, expanding the production of oil, coal and natural gas

On abortion and same-sex marriage, for example, Faith and Flag Conservatives express highly conservative views, while Ambivalent Right stand out for their more moderate opinions. On both issues, the attitudes of Committed Conservatives and Populist Right fall between these two groups. A similar pattern is evident in support for expanding exploration and production of fossil fuels: Faith and Flag Conservatives are more than 40 percentage points more likely than Ambivalent Right to favor this, with the other groups in between.

When it comes to the influence of religion on government policy, Faith and Flag Conservatives stand alone: They are the only group in which a majority (75%) says government policies should support religious values and beliefs. Fewer than a third in other Republican groups say the same.

As noted, Populist Right are deeply skeptical of corporations. In fact, just 17% say corporations make a fair and reasonable profit; that compares with 70% or more of the other GOP-aligned groups. In views of U.S. relations with its allies, majorities of Committed Conservatives and Ambivalent Right say the U.S. should heed allied interests even if it means compromising with them. Much smaller shares of Faith and Flag Conservatives and Populist Right express this view.

The Republican-oriented groups: Voting and views of the presidents

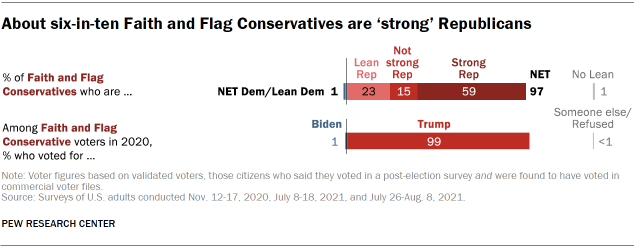
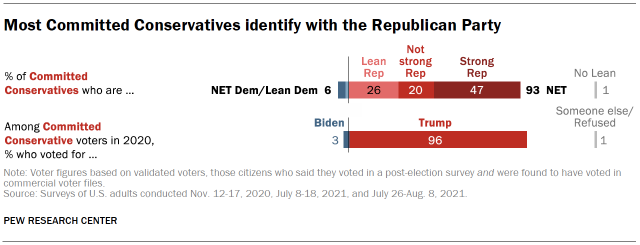
Almost all Faith and Flag Conservatives (99%), Committed Conservatives (96%) and Populist Right (97%) who voted in the 2020 presidential election cast their ballots for Donald Trump, as did a narrower majority (70%) of Ambivalent Right voters. Though to some degree this reflects that about a quarter of Ambivalent Right lean to the Democratic Party, Trump’s level of support among Ambivalent Right who identify as Republicans or Republican leaners was still somewhat lower than among the other Republican-oriented groups: 86% of Ambivalent Right Republican voters backed Trump, while 10% voted for Biden and 4% voted for someone else.

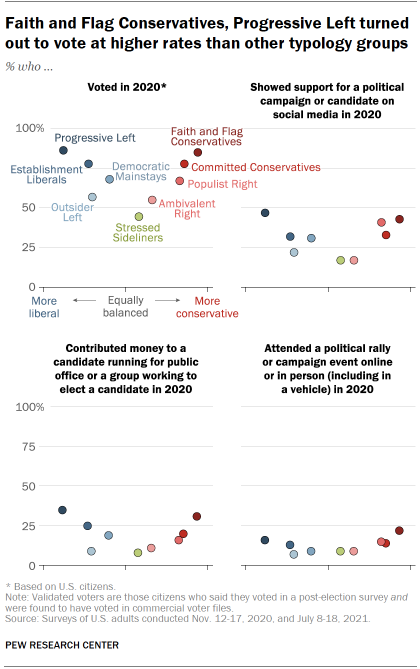
Faith and Flag Conservatives voted at very high rates in 2020: 85% of those eligible have a record of having voted, as do 78% of Committed Conservatives. Populist Right (67%) turned out at a rate little different from that of citizens overall, while just 55% of Ambivalent Right eligible voters cast ballots in 2020. And while roughly half of Stressed Sideliners (45%) voted, about half of those who did vote (49%) voted for Trump.

Chart shows the three most conservative typology groups say control of Congress in 2022 ‘really matters’; Ambivalent Right far less likely to view outcome as important

Looking ahead to the 2022 midterm elections, Faith and Flag Conservatives are most likely among Republican-oriented groups to say it really matters which party wins control of Congress (and most likely to say this among all typology groups). Nearly nine-in-ten Faith and Flag Conservatives who are registered voters (89%) say this, compared with about eight-in-ten Populist Right (81%) or Committed Conservatives (79%).

Just 43% of Ambivalent Right registered voters say it really matters which party wins control of Congress next year, and about half of this group (53%) say they would vote for a Republican candidate if the election for U.S. House were held today (13% would favor a Democrat, while 12% say they would opt for “another candidate” and 21% say they aren’t sure). Overwhelming shares of registered voters in other GOP-oriented groups say they would vote for a Republican candidate if the election were held today.

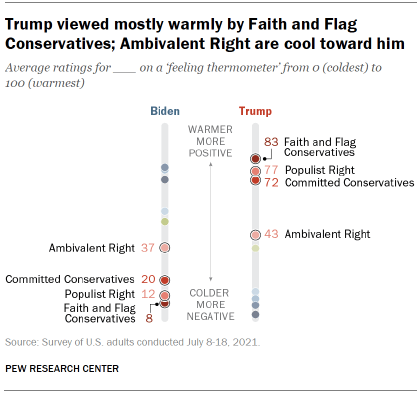
Chart shows Trump viewed mostly warmly by Faith and Flag Conservatives; Ambivalent Right are cool toward him

Faith and Flag Conservatives feel more positively about former president Trump than those in other Republican-oriented groups. On a “feeling thermometer” where 0 is the coldest rating and 100 is the warmest, Faith and Flag Conservatives give Trump a very warm average rating of 83. Populist Right and Committed Conservatives also rate Trump warmly, with average ratings of 77 and 72, respectively. Ambivalent Right are much less warm toward Trump, giving him an average rating of 43. This rating is somewhat higher (52) among Republicans and GOP leaners in Ambivalent Right.

Chart shows Populist Right are the only GOP-aligned group in which significantly more name Trump than Reagan as the best recent president

Ambivalent Right also give Joe Biden a less chilly rating than other Republican-oriented groups, though they still feel coolly toward the president. Ambivalent Right give Biden an average rating of 37, compared with very cold average ratings of 20 from Committed Conservatives, 12 from Populist Right and just 8 from Faith and Flag Conservatives.

Asked who has been the best president of the last 40 years, Faith and Flag Conservatives are about equally likely to choose Trump (48%) and Reagan (46%), while Populist Right are more likely to name Trump (47%) than Reagan (37%). (Far smaller shares name any other president – including both George H.W. and George W. Bush.)

Committed Conservatives and Ambivalent Right both name Reagan more frequently than Trump: 49% of Committed Conservatives choose Reagan as the best president while 35% choose Trump. About four-in-ten Ambivalent Right (38%) say Reagan, while 16% say Trump; similar shares name Barack Obama (16%) and Bill Clinton (14%). (Among only Ambivalent Right who identify with or lean toward the Republican Party, 48% name Reagan as the best president while 22% name Trump.)

Who should be allowed in the Republican Party tent?

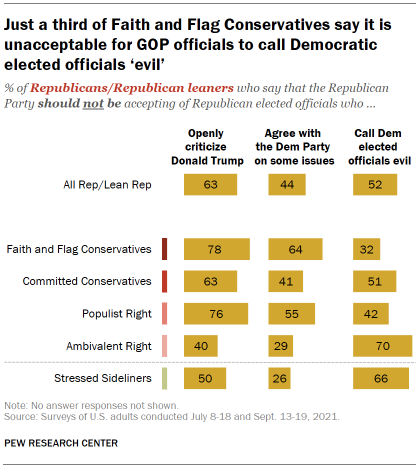
A majority of Republicans and Republican leaners (63%) say that the Republican Party should not be accepting of elected officials who are openly critical of Trump, including 78% of Faith and Flag Conservatives, 76% of Populist Right and 63% of Committed Conservatives. Ambivalent Right and Stressed Sideliner Republicans are more open to officials who criticize Trump: A majority of Republicans and Republican leaners who are Ambivalent Right (58%) say the party should be somewhat or very accepting of those who criticize Trump, and 49% of Republicans and Republican leaners who are Stressed Sideliners say this.

Chart shows just a third of Faith and Flag Conservatives say it is unacceptable for GOP officials to call Democratic elected officials ‘evil’

Across the board, Republican-oriented groups are more willing to accept elected officials who sometimes agree with the Democratic Party than they are officials who criticize Trump. While most Faith and Flag Conservatives (64%) and Populist Right (55%) say the Republican Party should not be accepting of elected officials who agree with the Democratic Party on some important issues, 59% of Committed Conservatives and even larger majorities of Ambivalent Right (70%) and Stressed Sideliners (73%) who are Republicans or Republican leaners say the party should be accepting of those who agree with the Democrats on some important issues.

Majorities of Republicans who are Ambivalent Right (70%) or Stressed Sideliners (66%) say the GOP should not be accepting of officials who call Democratic elected officials evil, though this drops to about half (51%) of Committed Conservatives and fewer than half of Populist Right (42%) or Faith and Flag Conservatives (32%).

GOP coalition differs over 2020 election outcome

Six-in-ten Populist Right and a nearly identical share of Faith and Flag Conservatives (59%) say they like political leaders who assert that Trump is the legitimate winner of the 2020 election, despite official counts showing that Biden was the legitimate winner. While Committed Conservatives are less likely to express this preference, on balance more say they like a leader who asserts Trump won (40%) than say they dislike a leader who asserts this (24%); about a third of Committed Conservatives (36%) say they neither like nor dislike leaders who assert Trump was the legitimate winner.

Chart shows GOP-oriented typology groups are divided over how they feel about leaders who publicly claim that Donald Trump won the 2020 election

By contrast, almost half of Ambivalent Right (46%) say they dislike a political leader who asserts Trump won the 2020 election, while just 16% say they like those who assert this (36% say they neither like nor dislike this). Even those Ambivalent Right who are Republicans or lean Republican are about twice as likely to say they dislike a leader who asserts Trump won as they are to say they like such a leader (41% vs. 20%).

These differences between groups reflect differences in attitudes about the 2020 election itself. Faith and Flag Conservatives and Populist Right are most likely to contend that Trump definitely or probably received the most votes cast by eligible voters in enough states to win the election, with more than eight-in-ten in each group claiming this (86% of Faith and Flag Conservatives, 85% of Populist Right). About six-in-ten Committed Conservatives (62%) also contend Trump definitely or probably won, compared with about a third (35%) of Ambivalent Right who say this. Ambivalent Right are the only Republican-oriented group in which a majority (62%) say that Joe Biden definitely or probably received the most votes cast by eligible voters in enough states to win the election.

Race and ethnicity, age and the GOP coalition

Faith and Flag Conservatives and Populist Right make up larger shares of the Republican coalition than other groups. Each account for nearly a quarter (23% each) of all Republicans and Republican leaners. Faith and Flag Conservatives (25%) and Populist Right (26%) make up about half of White Republicans.

Chart shows White Republicans are more likely than Hispanic Republicans to be Faith and Flag Conservatives and Populist Right

However, Hispanic Republicans are more likely to be Stressed Sideliners than they are to be Faith and Flag Conservatives or Populist Right. About a quarter of Hispanic Republicans (27%) are Stressed Sideliners, while just 16% are Faith and Flag Conservatives and just 14% are Populist Right; 12% are Committed Conservatives, roughly the same as the overall share of Republicans in this group, while 21% are Ambivalent Right.

Older Republicans are much more likely than younger Republicans to be Faith and Flag Conservatives and somewhat more likely to be Populist Right. About a third of Republicans 65 and older (32%) and 27% of those ages 50 to 64 are Faith and Flag Conservatives, compared with 17% of Republicans ages 30 to 49 and just 11% of those under 30. Nearly three-in-ten Republicans 65 and older (28%) are Populist Right, compared with 17% of those under 30.

Chart shows younger Republicans are more likely to be Ambivalent Right than any other typology group

The youngest Republican adults are more likely to be Ambivalent Right or Stressed Sideliners than older Republicans. Republicans under 30 are nearly three times as likely as those 65 and older to be Ambivalent Right (27% vs. 10%) and about twice as likely to be Stressed Sideliners (21% vs. 10%). And 13% of Republicans under the age of 30 have political values that place them in Democratic-oriented groups, compared with just 2% of those ages 50 and older.

2. The Democratic coalition

Note: For a new and fully revised version of Pew Research Center’s political typology (published June 2026), read “Beyond Red vs. Blue: The 2026 Political Typology.”

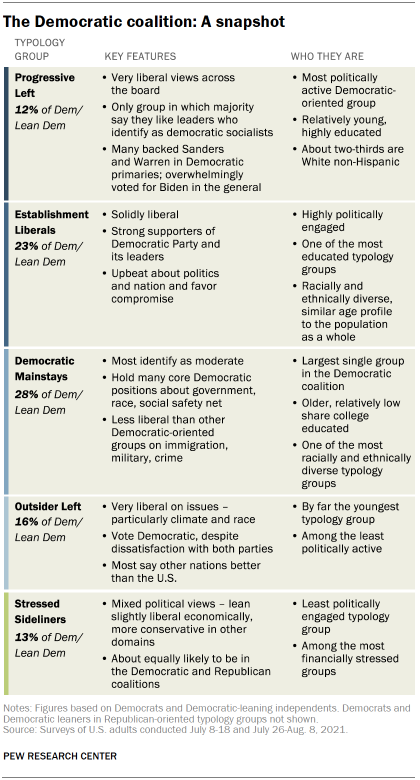
Chart shows the Democratic coalition: A snapshot

As in previous political typologies, the groups that form the Democratic coalition are largely united in support for a robust role of government and a strong economic and social safety net, as well as in their skepticism about corporate power. However, there are notable differences across the coalition around views of U.S. military might and – to some extent – views related to criminal justice and immigration.

And in several key issue areas – including environmental policy, gun policy, abortion, racial equality and other topics – differences across the coalition are less about the issue itself than in the intensity of support for liberal positions and policies.

This is also the case when it comes to some aspects of economic policy. Despite sharing the beliefs that economic inequality is a problem in the country, that the economic system favors powerful interests and that government should play a role in addressing inequities, the Democratic-oriented groups differ both in their views about the magnitude of the problems and in their level of support for proposed solutions.

In several other domains, divides seen in past typologies across the Democratic-oriented groups – particularly over social issues – are now areas where there is generally more agreement among Democrats than in the GOP coalition.

Chart shows most Progressive Left identify as liberal; majority of Democratic Mainstays say they are moderate

In part because some issues that used to divide the Democratic Party – like same-sex marriage, abortion and marijuana legalization – are no longer major fault lines, cleavages on the left flank of the party are now more evident. And, for the first time, this year’s political typology identifies not just a single solid liberal group, but distinctions across several liberal groups.

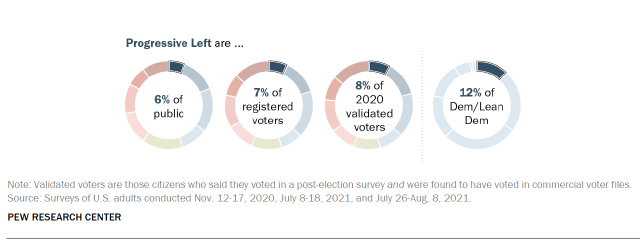
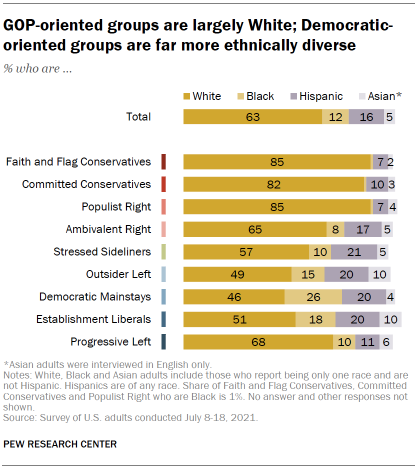
The most liberal group – nearly 80% call themselves liberal, including 42% who describe themselves as “very liberal” – Progressive Left make up a relatively small share of the party, 12% of Democrats and Democratic-leaning independents. However, this group is the most politically engaged segment of the coalition, extremely liberal in every policy domain and, notably, 68% White non-Hispanic. In contrast, the three other Democratic-oriented groups are no more than about half White non-Hispanic.

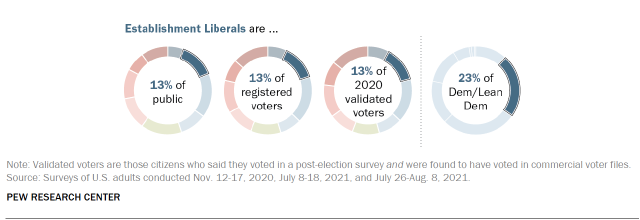
Establishment Liberals, who make up a significantly larger share of the party (23%) than Progressive Left, also vote at high rates and are very politically attentive.

But while Establishment Liberals have liberal opinions on nearly all issues, they tend to support more measured policy approaches and are more likely to back political compromise than Progressive Left and, to some extent, Outsider Left.

For instance, while all Democratic groups say by wide margins that more needs to be done to ensure equal rights for all Americans, regardless of their racial or ethnic backgrounds, Establishment Liberals are somewhat more likely than other groups to say needed changes can be made within existing laws and institutions. A majority also say the party should be at least somewhat accepting of members who sometimes agree with the GOP on issues.

Democratic Mainstays – the largest single group in the Democratic coalition this year (constituting 28% of Democrats and Democratic leaners) – are considerably more likely than other groups to call themselves politically moderate. Still, they hold nearly as liberal positions as other Democratic-oriented groups on economic issues, while they diverge from others in the coalition somewhat on immigration issues. (For instance, they are much less likely to support increasing legal immigration and more likely to identify illegal immigration as a problem in the country.) They also are more invested in U.S. military power than other Democratic-oriented groups. Black Democrats are particularly concentrated in this group: 40% of Black Democrats are Democratic Mainstays. Mainstays are also older and less likely to be college educated than other segments of the coalition.

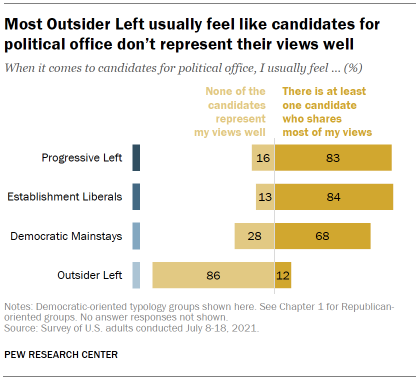
Chart shows most Outsider Left usually feel like candidates for political office don’t represent their views well

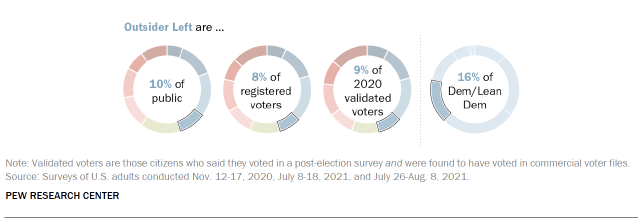
Outsider Left – 16% of Democrats and Democratic leaners – are young, progressive and not particularly at ease within the Democratic Party. Though they are not quite as liberal across the board as Progressive Left and express some skepticism about government performance, their liberalism is particularly evident when it comes to race, immigration and environmental issues.

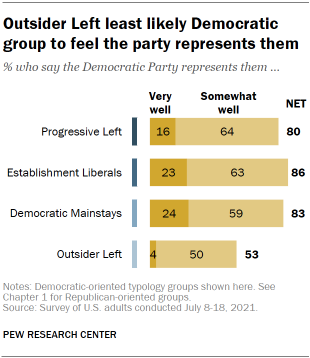
Chart shows outsider Left least likely Democratic group to feel the party represents them

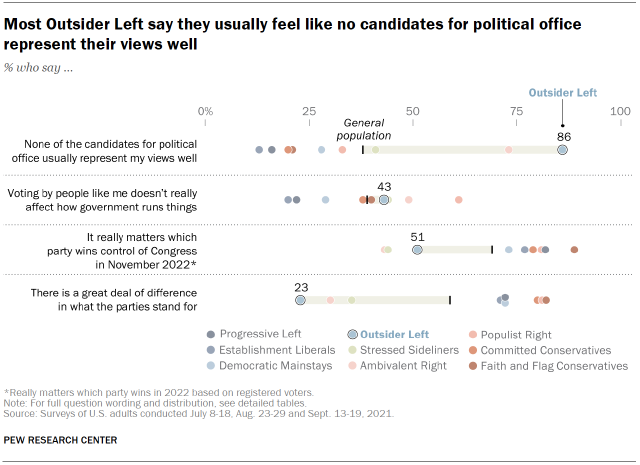
While Outsider Left are more likely to identify as political independents than as partisans – and nearly nine-in ten (86%) say that they usually don’t feel like there are political candidates that represent their views well – their dissatisfaction with the party largely comes from a liberal, not moderate, perspective.

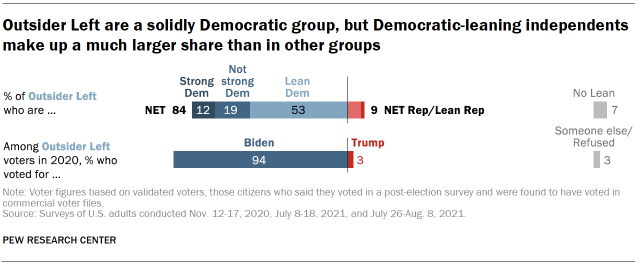
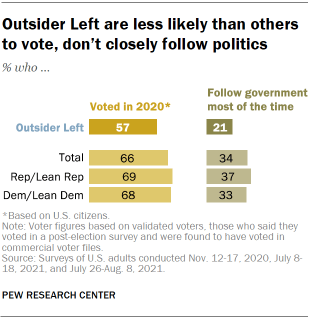
Outsider Left are not as reliable voters as other Democratic-oriented groups, but when they do vote and are faced with a choice between GOP and Democratic candidates, they overwhelmingly cast their votes for Democrats.

Stressed Sideliners, despite not having a clear partisan tilt, make up small but significant shares of both the Democratic and Republican coalitions (13% of Democrats and Democratic leaners, 15% of Republicans and Republican leaners). This group is financially stressed and relatively unengaged with politics. They generally have attitudes that place them near the center of overall public opinion, tilting more liberal than conservative on economic issues, while tilting more conservative on some social issues. And while they vote at significantly lower rates than other typology groups, 45% of them cast ballots in 2020 – roughly half of them voting for Joe Biden.

An additional 8% of Democrats and Democratic leaners belong to a GOP-oriented typology group (the majority of whom are part of Ambivalent Right). These are individuals who lean Democratic, but whose values and attitudes are more aligned with a group whose other members tend to be affiliated with the GOP. (Similarly, 6% of Republicans and Republican leaners belong to Democratic-oriented typology groups.)

Areas of general agreement within the Democratic coalition

Three-quarters or more of those in all four core Democratic-oriented typology groups say government should do more to solve problems. There is even more widespread agreement within the coalition that the economic system unfairly favors powerful interests and that tax rates on large businesses and corporations – and on households with incomes over $400,000 – should be raised, as should the federal minimum wage.

Chart shows areas of agreement within the Democratic coalition: Support for strong government safety net, higher taxes on corporations, greater progress toward racial equality

On questions of racial equity in society, Democratic-oriented groups also generally share a sense that more needs to be done in the country to achieve racial equality, that White people benefit from advantages in society that Black people do not, and that Black, Asian and Hispanic people face at least some discrimination in society.

About three-quarters or more in all four groups also say that women continue to face significant obstacles in society that make it harder for them to get ahead than men.

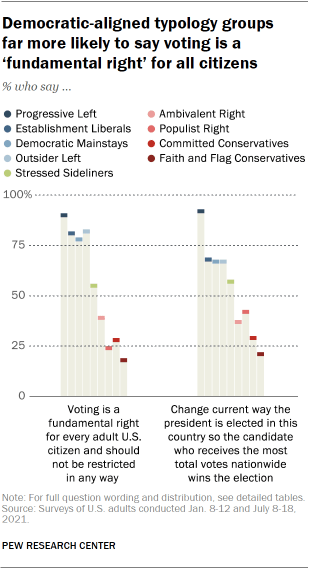
The coalition is largely united on key issues related to voting rights and access. Wide majorities say voting is a fundamental right that cannot be restricted; about three-quarters or more favor several reforms like making Election Day a national holiday, automatic voter registration, allowing convicted felons to vote after serving their sentences and expanding early voting. Note: For full question wording and distribution on each question, see detailed tables.

Divides within the Democratic coalition

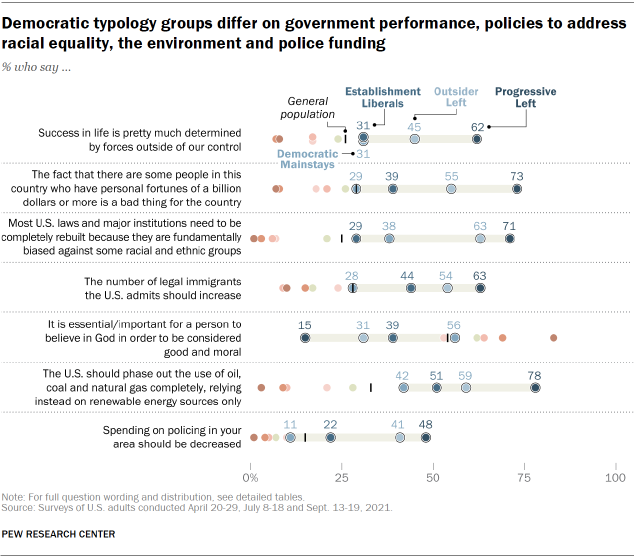
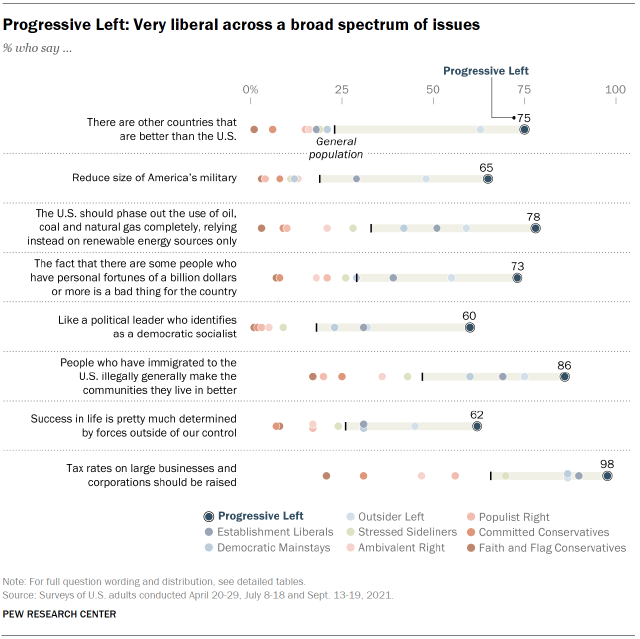
Despite largely agreeing on key economic attitudes, there are areas where aspects of the Democratic coalition diverge. Progressive Left stand out as the only typology group in which a majority say that “success in life is pretty much determined by forces beyond our control” (rather than that “everyone has it in their own power to succeed”). And while 73% of Progressive Left say the fact that there are billionaires in this country is bad for the country, as do 55% of Outsider Left, most Democratic Mainstays and Establishment Liberals do not share this view.

Chart shows Democratic typology groups differ on government performance, policies to address racial equality, the environment and police funding

Although majorities across all Democratic-oriented groups say more needs to be done to address racial inequities in society, the groups differ on how to achieve needed change. Clear majorities of Progressive Left (71%) and Outsider Left (63%) say change will require completely rebuilding most U.S. laws and institutions because they are fundamentally biased against some racial and ethnic groups, while far smaller shares of Democratic Mainstays (38%) and Establishment Liberals (29%) say this.

Democratic-oriented groups also differ over the extent to which they see immigration as a good, with Democratic Mainstays, in particular, offering somewhat more conservative views. For example, while 63% of Progressive Left and 54% of Outsider Left say the U.S. should admit more legal immigrants, that drops to 44% of Establishment Liberals and 28% of Democratic Mainstays (most say the number of legal immigrants should stay about the same).

Democratic-oriented groups are largely united in saying that climate change is a big problem for the country, that stricter environmental laws are worth the cost and that the priority for energy investment should be on developing alternative sources – like wind, solar and hydrogen. But differences emerge when it comes to the intensity of these views. Nearly eight-in-ten Progressive Left (78%) say that the U.S. should phase out the use of oil, coal and natural gas entirely, a position taken by a narrower majority of Outsider Left (59%), along with about half of Establishment Liberals (51%). By contrast, a smaller share (42%) of Democratic Mainstays hold this view, while a narrow majority (55%) say instead that the country should use a mix of energy sources, including fossil fuels.

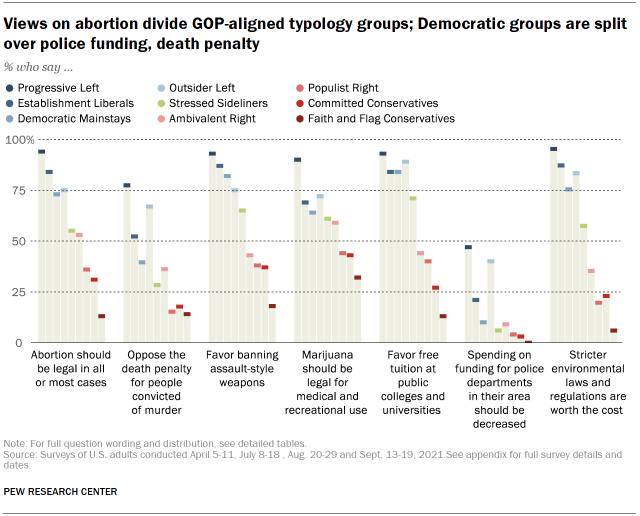
Nearly half of Progressive Left (48%) say police funding in their area should be decreased, as do 41% of Outsider Left. But both Democratic Mainstays and Establishment Liberals reject this idea. In fact, both groups are more likely to say that police funding in their areas should be increased than to say it should be decreased: 47% of Democratic Mainstays say police funding should be increased, while just 11% say it should be decreased. Among Establishment Liberals, 31% say it should be increased, 22% say it should be decreased and 47% say it should stay the same.

The Democratic-oriented groups: Voting and views of the presidents

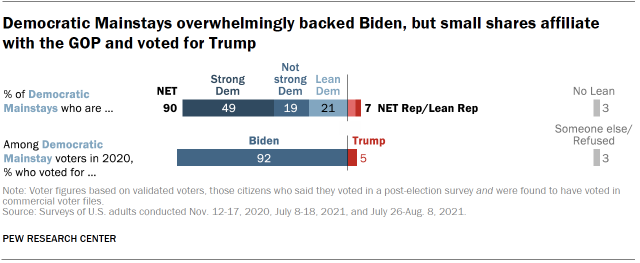
In the 2020 election, Joe Biden garnered the vast majority of votes cast by those in all four of the Democratic-oriented groups. Among 2020 voters, 92% of Democratic Mainstays and 94% of Outsider Left voted for Biden – as did nearly all Establishment Liberals and Progressive Left (98% each). But some groups were more likely to turn out than others. Fully 86% of Progressive Left and 78% of Establishment Liberals have a record of having voted in 2020, while that drops to 68% among Democratic Mainstays and to 57% among Outsider Left. And although a majority of Stressed Sideliners did not vote, those who did were about evenly split between Biden and Donald Trump in their votes (48% vs. 49%, respectively).

Chart shows most in Democratic-oriented groups plan to back Democratic candidates in 2022, though Outsider Left are more likely to be undecided, less invested in the outcome

Similar patterns are evident in vote intention for the 2022 midterm elections. While overwhelming majorities of registered voters in all four Democratic-oriented groups say they would vote for a Democratic House candidate over a Republican candidate, Outsider Left are far less likely than others to say that control of Congress “really matters” – and they are somewhat more likely than other groups to say, when faced with the choice of a Democrat or a Republican for their House seat, they’d opt for “another candidate” (8%) or say they are not sure (17%).

Chart shows Biden enjoys warm ratings from most Democratic- oriented groups, though Outsider Left are lukewarm

While Biden won the votes of overwhelming majorities of those in all Democratic-oriented groups who voted in 2020, some groups feel more positively than others about the president. Asked to rate Biden on a “feeling thermometer” where 0 is the coldest rating and 100 is the warmest, Establishment Liberals offer an average rating of 79, or very warm, while Democratic Mainstays’ average rating of Biden is a similarly very warm 77. Progressive Left also rate the president warmly, though somewhat less so (average 72), while Biden averages a lukewarm 56 degree rating among Outsider Left.

Yet ratings of Biden’s 2020 general election opponent among these groups are more uniform. Trump’s rating tops out at a very cold average 14 degrees among Outsider Left and is a frigid 2 degrees among Progressive Left.

Chart shows Obama seen as best recent president by all Democratic-oriented typology groups

Majorities in all Democratic-oriented typology groups point to Barack Obama as the best president of the last 40 years. Progressive Left (72%) and Establishment Liberals (66%) are particularly likely to say this. While a 54% majority of Democratic Mainstays name Obama, 22% of this group name Bill Clinton, a higher share saying this than among Progressive Left (14%) and Establishment Liberals (17%).

The 2020 Democratic primary through the lens of the typology groups

Chart shows in 2020 Democratic primary contest, Democratic Mainstays backed Biden, Progressive Left supported Sanders or Warren

Looking back to the 2020 Democratic presidential primary contest, the Democratic-oriented typology groups had distinctly different preferences heading into the first caucuses and primaries. In January 2020, when there were still about a dozen Democratic candidates in the running, 39% of Democratic Mainstays named Biden as their first choice for the nomination, more than twice as many as named any other single candidate. Biden also held an edge among Establishment Liberals, though about a quarter of this group (26%) named candidates with less overall support (then-Mayor Pete Buttigieg, Sen. Amy Klobuchar, Michael Bloomberg and others).

By comparison, Sen. Bernie Sanders had the support of 35% of Progressive Left, with this group nearly as likely to name Sen. Elizabeth Warren (28%) as their first choice – and a far smaller share (15%) naming Biden. And while Outsider Left were similar to their Progressive Left co-partisans in their support for Sanders (38% named him), they were less likely to back Warren (18%).

Who should be allowed in the Democratic Party tent?

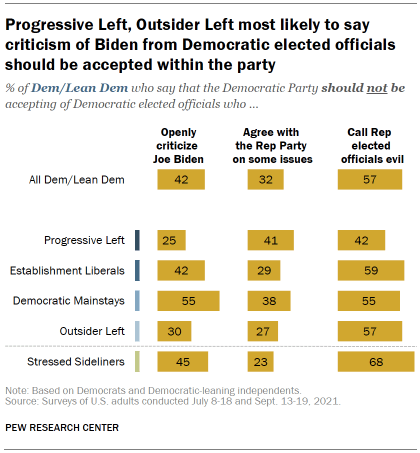
Although a majority of Democrats and Democratic leaners say the Democratic Party should be generally accepting of elected officials who are openly critical of Biden, that sentiment differs across Democrats within typology groups: While just 25% of Progressive Left and 30% of Outsider Left say the party should not be accepting of those who are critical of the president, that rises to 42% among Democrats who are Establishment Liberals and 55% of those who are Democratic Mainstays.

Chart shows Progressive Left, Outsider Left most likely to say criticism of Biden from Democratic elected officials should be accepted within the party

Progressive Left, by contrast, are more likely to say the party should not be accepting of members who agree with the Republican Party on some issues (41% say this, as do 38% of Democratic Mainstays, while just 29% of Establishment Liberals and 27% of Outsider Left say the same).

And while majorities of Democrats who are Establishment Liberals (59%), Democratic Mainstays (55%) and Outsider Left (57%) say the Democratic Party should not be accepting of elected officials who call GOP elected officials “evil,” that drops to 42% among Progressive Left.

The ‘democratic socialist’ label

Chart shows Progressive Left stand out for positive views of elected officials who identify as democratic socialists

Today, Progressive Left are the only typology group in which a majority say they like political leaders who identify as democratic socialists – 60% say this, while just 4% say they do not. Both Establishment Liberals and Outsider Left are more likely to say they like this about a political candidate than to say they dislike it; still, about half of those in these groups say they neither like nor dislike candidates who use this self-description.

Democratic Mainstays are the least likely to say this label appeals to them – just 23% say it does, the same share who say they dislike the label. About half (52%) say they neither like nor dislike it.

Race and ethnicity, age and the Democratic coalition

Democratic Mainstays make up 28% of the Democratic coalition – the largest single group. But they are an even larger share of Black Democrats: Four-in-ten Black Democrats are Democratic Mainstays. By comparison, the share of Black Democrats who are Establishment Liberals is nearly identical to the overall share of Democrats who fall into this group. And just 12% of Black Democrats are Outsider Left, while only 6% are Progressive Left, in both cases substantially smaller shares than in the overall Democratic population.

Hispanic Democrats also are somewhat less likely than Democrats as a whole to be Progressive Left (just 7% of Hispanic Democrats are Progressive Left). However, 19% are Outsider Left. Hispanic Democrats are somewhat more likely than Democrats in other racial and ethnic groups to fall into GOP-oriented political typology groups.

Roughly a third of Asian American Democrats (32%) are Establishment Liberals – a larger share of Asian Democrats belong to this group than among White, Black and Hispanic Democrats. Asian American Democrats are also more likely than White and Black Democrats to be Outsider Left – roughly a quarter fit into this group (24%). And Asian American Democrats are far less likely than Democrats as a whole to be Democratic Mainstays – just 19% are in this group.

Chart shows Black Democrats are more likely than White, Asian and Hispanic Democrats to be Democratic Mainstays

A quarter of White Democrats are Democratic Mainstays, while a similar share (24%) are Establishment Liberals, 16% are Outsider Left and 15% are Progressive Left – a larger share than among Black or Hispanic Democrats.

Older Democrats are far more likely than younger Democrats to be Democratic Mainstays: 42% of those ages 65 and older and 37% of those 50 to 64 belong to this group. By comparison, just 15% of Democrats under age 30 and 23% of those 30 to 49 are Mainstays.

In contrast, the largest single group among Democrats ages 18 to 29 is Outsider Left, with three-in-ten falling into this group. The youngest Democrats are also more likely than older Democrats to be Progressive Left.

Chart shows younger Democrats more likely than older Democrats to be Progressive Left, Outsider Left

3. Faith and Flag Conservatives

Staunchly conservative on all issues; deeply loyal to Donald Trump

Note: For a new and fully revised version of Pew Research Center’s political typology (published June 2026), read “Beyond Red vs. Blue: The 2026 Political Typology.”

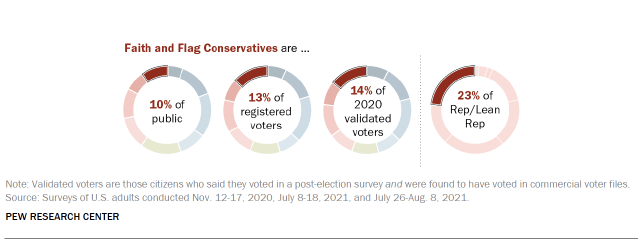
Chart shows Faith and Flag Conservatives are ...

Faith and Flag Conservatives are highly religious, politically engaged and both socially and economically conservative. They favor a robust role for religion in public life and a smaller role for government in society, and they hold that a strong American military is essential in international affairs. They overwhelmingly identify with the GOP and remain strong supporters of former President Donald Trump.

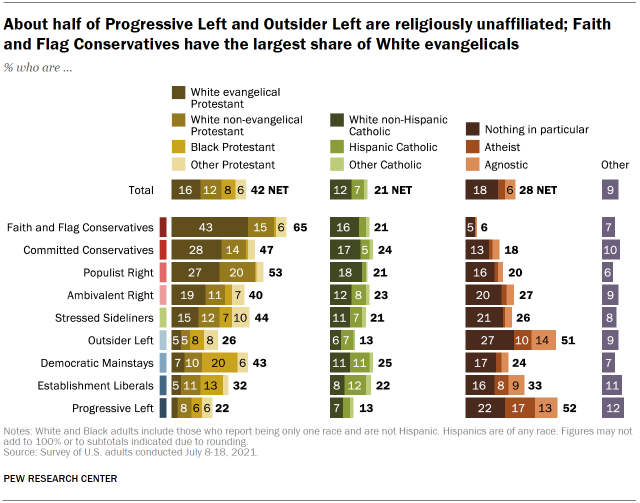
More than four-in-ten are White evangelical Protestants, the highest share of any political typology group. Faith and Flag Conservatives are more likely than those in other groups to emphasize the importance of religion in their lives and to hold restrictive attitudes on abortion and same-sex marriage; they are the sole group in which a majority (67%) say same-sex marriage being legal is bad for the country. They are also the only group in which a majority (58%) favors allowing public school teachers to lead students in Christian prayers.

Three-quarters of Faith and Flag Conservatives say that the best way to ensure peace is through military strength rather than through diplomatic means, by far the highest share of any group saying this. They are one of only two groups, alongside Populist Right, in which a majority favor increasing the size of America’s military.

Faith and Flag Conservatives are the most likely to say that White people benefit “not at all” from advantages in society that Black people don’t have, and they are much more likely to say that there is a lot of discrimination against White people in our society today than they are to say the same of discrimination against Black people. About six-in-ten (63%) say that “increased public attention to the history of slavery and racism in America” is bad for our society.

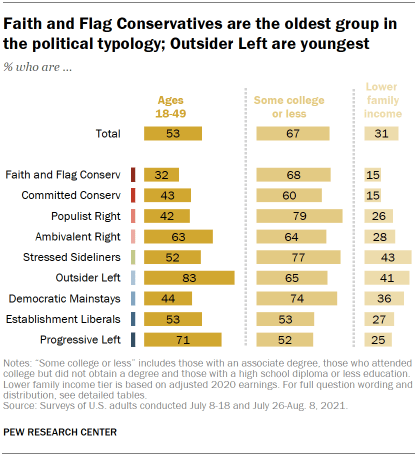
Faith and Flag Conservatives are the oldest typology group, with a median age of 57.

Trump enjoys stronger support from Faith and Flag Conservatives than from nearly any other typology group. They nearly unanimously voted for him in 2020, and a majority say that he was a great president. Roughly half say that he definitelyreceived the most votes cast by eligible voters in enough states to win the 2020 presidential election (86% say Trump at least probably won the 2020 election). Official counts show that Biden received the most votes cast by eligible voters in enough states to win.

About eight-in-ten (83%) in this group say they would like Trump to remain a major national figure for many years to come, with a majority (55%) wanting him to run for president again.

Political affiliation, voting and engagement

Chart shows about six-in-ten Faith and Flag Conservatives are ‘strong’ Republicans

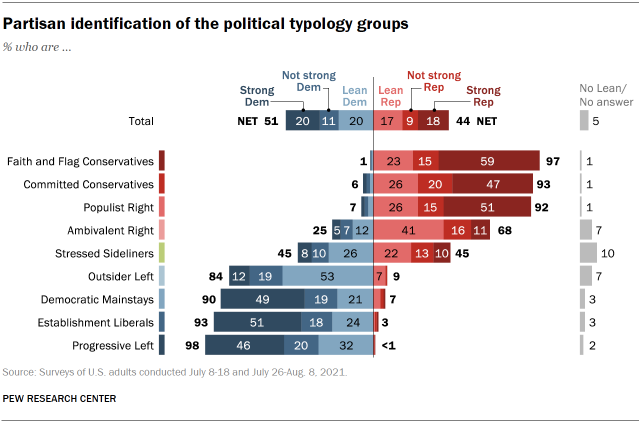
Almost all Faith and Flag Conservatives (97%) either identify as Republicans (74%) or lean toward the Republican Party (23%). About six-in-ten (59%) identify strongly with the GOP. This is the highest share who identify strongly with either party across all nine typology groups.

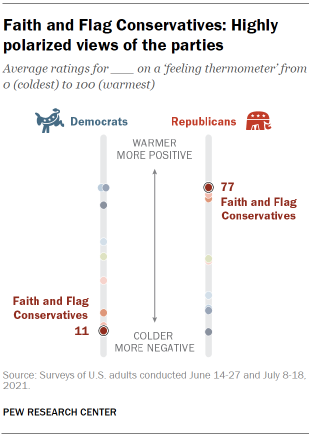
Chart shows Faith and Flag Conservatives: Highly polarized views of the parties

Nearly nine-in-ten Faith and Flag Conservatives describe their own political views as conservative, including 35% who say they are very conservative.

Faith and Flag Conservatives give Republicans a very warm average rating of 77 on a “feeling thermometer” ranging from 0-100, where 100 represents the warmest feelings – the highest rating of any typology group. They give Democrats an average rating of 11, lower than any other group.

Chart shows Faith and Flag Conservatives are among the most politically engaged

Faith and Flag Conservatives are one of the two most politically engaged groups, alongside Progressive Left. They voted at very high rates in 2020 – 85% of those eligible to vote did so – and in the months leading up to the 2020 election, a higher share (31%) contributed money to a candidate for office or to a group working to elect a candidate than in any other Republican-oriented group.

A majority of this group (55%) say they follow what’s going on in government and public affairs most of the time. Faith and Flag Conservatives are also more likely than most to say they discuss government and politics nearly every day.

Faith and Flag Conservatives: Key political attitudes and beliefs

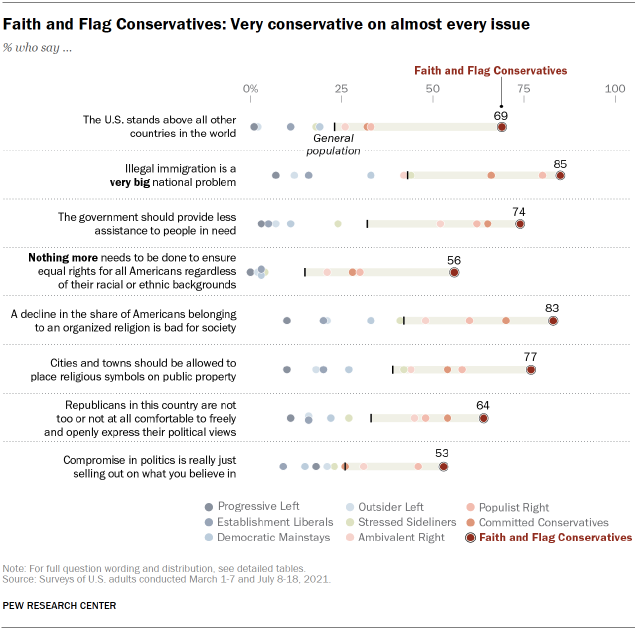
Faith and Flag Conservatives stand out for their conservative views on a wide array of issues, including the role of religion in public life. About three-quarters (77%) say that cities and towns should be allowed to place religious symbols on public property. A similar share (75%) say government policies should support religious values (the only typology group in which a majority says this). And 83% say the decline in the share of Americans belonging to an organized religion is bad for society.

Chart shows Faith and Flag Conservatives: Very conservative on almost every issue

They diverge from other Republican-oriented groups on several issues. For example, 69% of Faith and Flag Conservatives say the U.S. “stands above all other countries in the world,” far larger than the share in any other typology group, Republican and Democratic. And they are highly skeptical of political compromise: 53% of Faith and Flag Conservatives say that “compromise is really just selling out on what you believe in.”

Faith and Flag Conservatives have very favorable attitudes toward Trump. Large shares of Faith and Flag Conservatives assert that Trump was either definitely or probably the legitimate winner of the 2020 presidential election, despite official counts showing Biden legitimately won the election: 53% say that Trump definitely received the most votes cast by eligible voters in enough states to win the election, and another 34% say that he probably did. A majority (59%) say that they like political leaders who publicly assert that Trump was the legitimate winner, and 42% say that the Republican Party should be not at all accepting of elected officials who criticize Trump.

Chart shows large majority of Faith and Flag Conservatives say too much attention has been paid to riot at U.S. Capitol

Nearly eight-in-ten Faith and Flag Conservatives (79%) say that too much attention has been paid to the Jan. 6 riot at the U.S. Capitol and its impacts, a higher share than in any other group. And 58% say that the criminal penalties the individuals who broke into the Capitol and rioted have been receiving are too severe – the only typology group in which a majority says this.

Faith and Flag Conservatives express relatively high levels of antipathy toward Democrats. Roughly seven-in-ten (71%) say that people who supported a different candidate than they did in the 2020 presidential election probably don’t share many of their other values and goals, either. This is similar to the shares of Populist Right (66%) and Progressive Left (69%) who say this, and higher than in other groups.

Faith and Flag Conservatives: Who they are

Faith and Flag Conservatives are the oldest typology group. Two-thirds are ages 50 and older, including a third who are at least 65, while just 8% are under the age of 30.

Along with Committed Conservatives and Populist Right, they have the highest share who identify as non-Hispanic White (85%). Nearly six-in-ten (58%) are men, the highest share in the typology – along with Committed Conservatives. They are also among the most likely to live in rural communities.

Nearly four-in-ten Faith and Flag Conservatives (38%) said they definitely or probably would not get a COVID-19 vaccine as of late August, similar to the 39% of Populist Right who said this. Far smaller shares of those in other typology groups said this.

A large majority of this group (74%) report getting political news from Fox News, a higher share than any other group.

4. Committed Conservatives

Stalwart Republicans, supporters of Trump – with reservations

Note: For a new and fully revised version of Pew Research Center’s political typology (published June 2026), read “Beyond Red vs. Blue: The 2026 Political Typology.”

Chart shows Committed Conservatives are ...

Staunchly conservative and overwhelmingly Republican, Committed Conservatives hold pro-business views traditionally associated with the Republican Party, have favorable attitudes about international trade and favor a limited role of government. Their approach to international relations centers on engaging with U.S. allies and maintaining American military might.

Committed Conservatives tend to hold more moderate positions on immigration than the two other deeply conservative groups in the Republican coalition – Faith and Flag Conservatives and Populist Right. They also are slightly more moderate than these groups on some issues related to racial and ethnic equality but still more conservative than the Democratic-oriented groups.

While nearly all voted for Donald Trump for president in 2020, and most hold positive views of him today, Committed Conservatives are less likely than Populist Right and Faith and Flag Conservatives to favor a major role for Trump in their party’s future. They are also less likely to say that they like elected officials who publicly take the (unsubstantiated) position that Trump is the “legitimate winner” of the 2020 election. And of the three largely conservative groups in the political typology, Committed Conservatives are the only one in which a significantly larger share names Ronald Reagan than Trump as the best president of the past 40 years (49% name Reagan, 35% Trump).

Political affiliation, voting and engagement

Chart shows most Committed Conservatives identify with the Republican Party
Chart shows Committed Conservatives are among the warmest toward Republicans

Most Committed Conservatives (93%) identify with or lean toward the Republican Party, including 47% who strongly identify as Republicans. Nearly three-quarters (72%) describe their own views as conservative, with 17% saying they are very conservative. A quarter describe their views as moderate, and hardly any (2%) say their views are liberal.

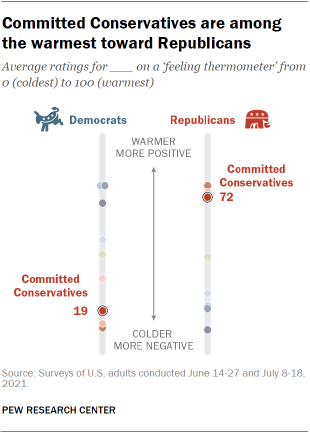
Committed Conservatives feel warmly toward the Republican Party. On a “feeling thermometer” ranging from 0-100, where 100 indicates the warmest feelings, Committed Conservatives give Republicans an average rating of 72, similar to the average rating Populist Right give to Republicans (74) and only slightly lower than the average rating from Faith and Flag Conservatives (77). Committed Conservatives feel coldly toward Democrats, though slightly less so than Populist Right or Faith and Flag Conservatives.

Chart shows Committed Conservatives are highly engaged in politics

This group is one of the most politically engaged. In the 2020 presidential election, eligible Committed Conservatives voted at a rate 12 percentage points higher than all adult citizens and 9 points higher than all eligible Republicans.

In addition, an above-average share of Committed Conservatives say they follow what’s going on in government and public affairs most of the time: 42% say this, compared with 34% of all U.S. adults.

Committed Conservatives: Key political attitudes and beliefs

Committed Conservatives express somewhat greater approval of the job Republican leaders in Congress are doing than Faith and Flag Conservatives or the Populist Right, and much greater approval than those in the Ambivalent Right. As in the other Republican-oriented groups, an overwhelming share (91%) disapprove of Joe Biden’s performance as president.

Chart shows Committed Conservatives: Conservative views on almost all issues, but key points of contrast with other Republican-aligned groups

Along with Faith and Flag Conservatives, Committed Conservatives have the highest share of any group to say that everyone has it in their own power to succeed, and nearly eight-in-ten (78%) say government aid to the poor does more harm than good.

When it comes to foreign policy, roughly half (53%) say that the best way to ensure peace is through military strength, while 45% instead say diplomacy is the best path to peace. Most (68%) say the U.S. should take the interests of allies into account in foreign policy.

Committed Conservatives differ from other Republican-oriented groups in some of their responses to the COVID-19 pandemic. Two-thirds say the statement “vaccines are the best way to protect Americans from COVID-19” describes their views very or somewhat well, a higher share than in any of the other Republican-oriented groups, including the Ambivalent Right.

Though most voted for Trump in 2020, Committed Conservatives are less likely than some other conservative typology groups to back another run

Chart shows fewer than half of Committed Conservatives say they would like to see Trump run again in 2024

Two-thirds of Committed Conservatives say they would like to see Donald Trump continue to be a major national political figure for many years to come. While this is identical to the overall share of Republicans and Republican leaners who hold this view, larger shares of Faith and Flag Conservatives (83%) and Populist Right (81%) say this (though just 35% of Ambivalent Right do).

While majorities of both Faith and Flag Conservatives (55%) and the Populist Right (57%) say Trump should run for president again in 2024, about four-in-ten Committed Conservatives say the same.

Committed Conservatives: Who they are

About eight-in-ten Committed Conservatives (82%) are White and one-in-ten are Hispanic; far smaller shares are Asian (3%) or Black (1%). Nearly six-in-ten (58%) are men and most (56%) are ages 50 and older, including 31% who are at least 65 years old.

Committed Conservatives are among the most educated of the GOP-oriented groups and are among the highest-income political typology groups. A quarter live in upper-income households, similar to Faith and Flag Conservatives and Establishment Liberals but a higher share than in most other groups.

Nearly seven-in-ten Committed Conservatives (69%) rate their personal financial situation as either excellent or good, compared with half of all U.S. adults. An identical share say they have an IRA, 401(k) or similar type of retirement account, making them the typology group most likely to have this type of account. And 53% say they have personal investments in stocks, bonds or mutual funds in addition to their retirement accounts.

Nearly two-thirds of Committed Conservatives (65%) say they had received all of the necessary shots to be fully vaccinated against COVID-19 as of late August, a smaller share than among any of the four Democratic-oriented groups but a larger share than among Faith and Flag Conservatives or Populist Right (51% each).

5. Populist Right

Immigration hard-liners with critical views of the economic system

Note: For a new and fully revised version of Pew Research Center’s political typology (published June 2026), read “Beyond Red vs. Blue: The 2026 Political Typology.”

Chart shows Populist Right are ...

Very conservative and overwhelmingly Republican, Populist Right hold highly restrictive views about immigration policy and are very critical of government. But, in contrast to other parts of the GOP coalition, their criticism extends well beyond government to views of big business and to the economic system as a whole: 82% say that large corporations are having a negative impact on the way things are going in the country, and nearly half support higher taxes on the wealthy and on large corporations.

Like the other two deeply ideologically conservative typology groups, Populist Right are overwhelmingly White (85%). However, in contrast to these groups, a majority of Populist Right are women (54%). Populist Right are also one of the least highly educated groups; just two-in-ten are college graduates.

Populist Right are among the groups most likely to say that illegal immigration is a very big problem in the country today, and nearly half (48%) say that the number of legal immigrants admitted to the U.S. should decrease. They hold very positive attitudes about former President Donald Trump. About eight-in-ten say they feel warmly toward Trump, and six-in-ten say they feel very warmly toward him. A majority (57%) also say Trump should run for president again in 2024.

Political affiliation, voting and engagement

Chart shows Populist Right overwhelmingly supported Trump in the 2020 election

Nearly two-thirds of Populist Right (66%) identify as Republicans, while roughly a quarter (26%) lean toward the Republican Party. Just 7% identify with or lean toward the Democratic Party.

Chart shows Populist Right: Warm toward Republicans, cold toward Democrats

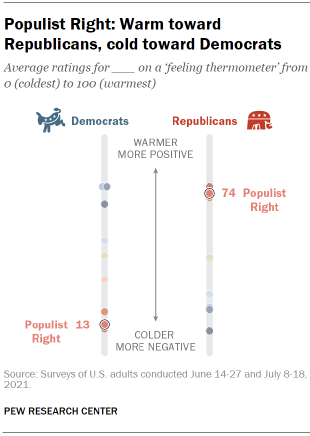
A majority of this group also say they feel warmly toward Republicans, giving them an average rating of 74 on a “feeling thermometer” ranging from 0-100, where 100 represents the warmest, most positive feelings. This is about the same as the average rating among Committed Conservatives – 72 – and only slightly lower than the average rating of 77 from Faith and Flag Conservatives.

Populist Right were nearly unanimous in their support for Trump in the 2020 presidential election. Today, most continue to incorrectly say that Trump was the legitimate winner of the election, despite official counts showing that Joe Biden was the legitimate winner. Nearly half (47%) say that Trump definitely received the most votes cast by eligible voters in enough states to win the election, and an additional 38% say that Trump probably received the most votes. Six-in-ten also say that they like political leaders who publicly assert that Trump is the legitimate winner of the election.

Chart shows Populist Right are about average on political engagement

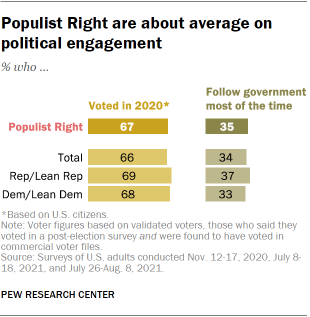
About two-thirds of eligible Populist Right (67%) voted in 2020, nearly identical to the share among adult citizens. Populist Right are also about as likely as average to say they follow what’s going on in government and public affairs most of the time: 35% say this, compared with 34% of all adults.

Populist Right: Key political attitudes and beliefs

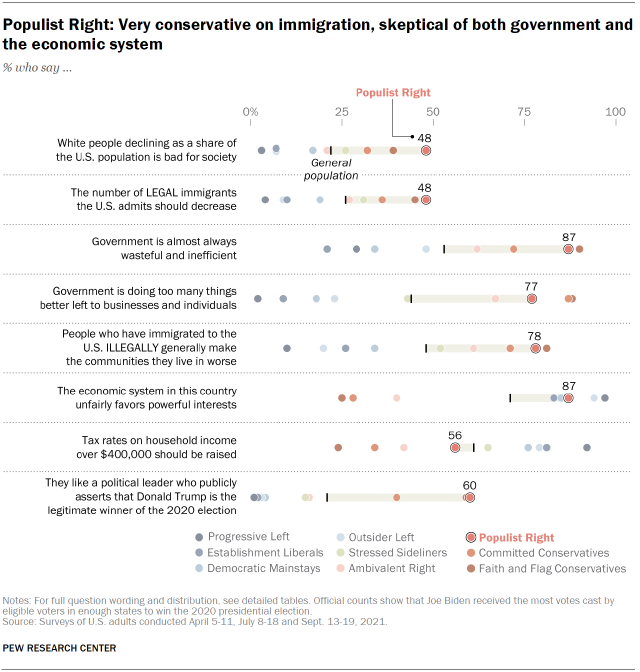
Like other Republican-oriented groups, Populist Right are highly critical of government – 87% say it is “almost always wasteful and inefficient,” while 77% say “government is doing too many things better left to businesses and individuals.”

Chart shows Populist Right: Very conservative on immigration, skeptical of both government and the economic system

But they stand out from the rest of the Republican coalition in their views about the economic system. Nearly nine-in-ten (87%) say that the economic system in this country unfairly favors powerful interests, far higher than the share in any other Republican-oriented group and more in line with groups in the Democratic coalition on this question.

A majority of Populist Right (56%) say that taxes on household income over $400,000 should be raised and that taxes on large businesses and corporations should be raised (also 56%). Fewer than half of Faith and Flag Conservatives, Committed Conservatives or the Ambivalent Right favor these tax proposals.

Nearly eight-in-ten Populist Right (78%) say that immigrants who come to the U.S. illegally generally make the communities they live in worse, including 41% who say they generally make their communities a lot worse. And about half of this group (48%) say that White people declining as a share of the U.S. population is bad for society, higher than the share saying this in any other political typology group.

Populist Right’s views of many institutions track with other GOP-oriented groups but diverge over views of corporations, financial institutions

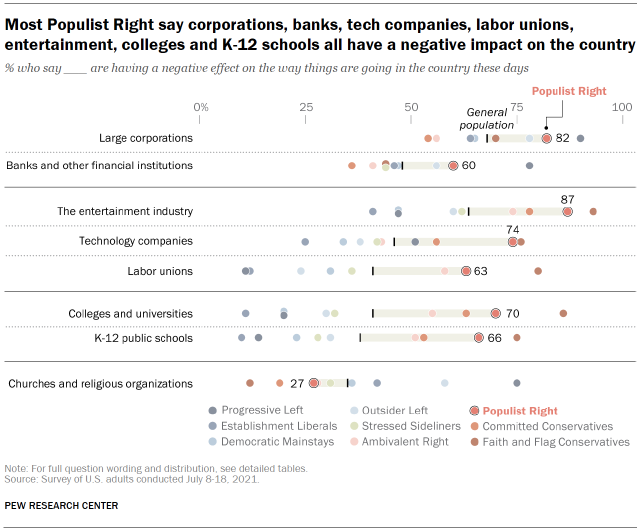
Like other Republican-oriented groups, Populist Right generally say that the entertainment industry, technology companies and labor unions are having a negative effect on the way things are going in the country today. They are also more likely to say this about both colleges and universities and K-12 public schools than any other group aside from Faith and Flag Conservatives.

However, unlike the other Republican-oriented groups, Populist Right also say that large corporations (82%) and financial institutions (60%) are having a negative impact. Progressive Left are the only group more critical of these institutions.

Chart shows Most Populist Right say corporations, banks, tech companies, labor unions, entertainment, colleges and K-12 schools all have a negative impact on the country

Populist Right: Who they are

Populist Right are – along with Faith and Flag Conservatives – more likely than those in other groups to live in rural areas (38% of Populist Right, 39% of Faith and Flag Conservatives). They are one of the typology groups with the lowest share of college graduates: Just under half (45%) have a high school diploma or less education, while 34% have some college education but not a four-year degree.

About half of Populist Right (52%) say that their personal finances are in only fair or poor shape, similar to the share of all U.S. adults (48%) saying this. Their average income level is similar to the public’s overall, though they are somewhat more likely than average to live in middle-income households (53% do so, compared with 47% of the public overall).

Roughly half of the Populist Right (53%) are Protestants, a higher share than any group besides Faith and Flag Conservatives, and 27% are White evangelical Protestants.

Like the other Republican-oriented groups, a larger share (64%) reports getting political news from Fox News than from any other outlet among 26 national news sources asked about.

As of a late-August survey, about half of Populist Right (51%) reported being fully vaccinated against COVID-19. This is identical to the share of Faith and Flag Conservatives, but lower than any other political typology group – and 19 percentage points lower than the share of all U.S. adults who reported being fully vaccinated.

6. Ambivalent Right

Note: For a new and fully revised version of Pew Research Center’s political typology (published June 2026), read “Beyond Red vs. Blue: The 2026 Political Typology.”

Chart shows Ambivalent Right are ...

On issues ranging from the size of the federal government to views about business, gender and race, Ambivalent Right hold many views that are largely consistent with core conservative values. Yet they also hold more moderate stances on several social issues and differ from some other segments of the GOP coalition in taking a more internationalist view of foreign policy and a less restrictive position on immigration.

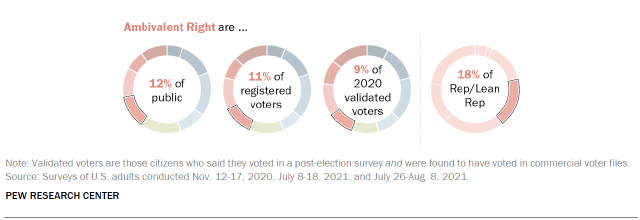
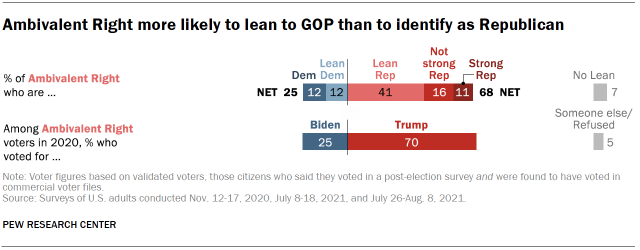
Ambivalent Right are a GOP-leaning group as a whole – 68% identify as or lean Republican – and they make up a substantial share of all Republicans and GOP leaners (18%). But this group also includes a significant number of Democrats: A quarter of Ambivalent Right either identify with or lean toward the Democratic Party, and a similar share (25%) voted for Joe Biden in the 2020 presidential election.

With 63% of Ambivalent Right adults under the age of 50, they are substantially younger than other Republican-oriented groups. About two-thirds (65%) are White, 17% are Hispanic, 8% are Black and 5% are Asian, making this group more racially and ethnically diverse than other GOP coalition groups.

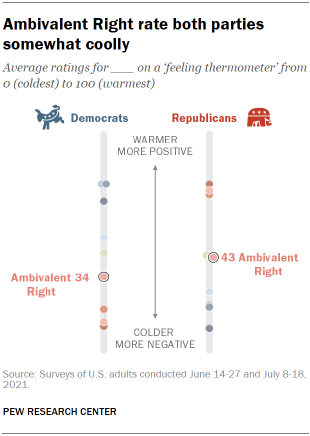
Ambivalent Right differ from other GOP-aligned groups with their support for legal abortion and less negative views of the impact of same-sex marriage. They also are distinct from other Republican-oriented groups in their views of Donald Trump. Whereas large majorities of each of the other Republican-oriented groups say they feel warmly toward Trump, Ambivalent Right are somewhat more likely to say they feel coldly toward the former president (46%) than warmly (34%). And most (63%) would not like to see Trump continue to be a major national political figure for many years to come.

Ambivalent Right have also largely rejected the unsubstantiated claim from Trump and others that Trump was the legitimate winner of the 2020 presidential election. Roughly six-in-ten say that Biden definitely or probably received the most votes cast by eligible voters in enough states to win the 2020 election – more than double the share of the Ambivalent Right who voted for Biden, and far higher than the shares in other Republican-aligned groups.

Political affiliation, voting and engagement

Chart shows Ambivalent Right more likely to lean to GOP than to identify as Republican

About two-thirds of Ambivalent Right (68%) are Republicans or Republican leaners, with a larger share saying they lean toward the Republican Party (41%) than identifying as strong (11%) or not so strong (16%) Republicans. A quarter identify with or lean toward the Democratic Party, and an additional 7% say they do not lean toward either party.

The shares of 2020 voters who voted for Trump and Biden are nearly identical to the shares who identify with or lean toward each party: 70% voted for Trump and 25% for Biden.

Chart shows Ambivalent Right rate both parties somewhat coolly

Ambivalent Right do not feel very warmly toward either Republicans or Democrats. On a “feeling thermometer” ranging from 0-100, where 100 represents the warmest feelings and 0 represents the coldest feelings, Ambivalent Right give Republicans an average rating of 43. Ambivalent Right are cooler toward Democrats, with an average rating of 34. While some of their coolness toward the GOP reflects that 25% of this group are Democrats and Democratic leaners, even Ambivalent Right who identify with or lean to the GOP give Republicans an average feeling thermometer rating of 49, similar to ratings among the group as a whole; the average rating of Democrats (30) is also similar.

Chart shows Ambivalent Right: Lower turnout, less interest in government than average

Ambivalent Right are less politically engaged than groups with stronger partisan attachments. About half of eligible Ambivalent Right (55%) voted in the 2020 election, 11 percentage points lower than the share of all adult citizens who voted. Ambivalent Right are also less likely than most other groups to say they follow what’s going on in government and politics most of the time.

Ambivalent Right’s distaste for Trump relative to other Republican-oriented groups does not mean that they are particularly warm toward Biden. Six-in-ten say they feel coldly toward Biden, and just two-in-ten approved of his job performance as president as of mid-September.

Ambivalent Right: Key political attitudes and beliefs

On core issues related to the size and role of government, Ambivalent Right hold views that are traditionally associated with the GOP: Most (63%) say that government regulation of business usually does more harm than good, and nearly three-quarters (73%) prefer a smaller government providing fewer services to a bigger government providing more services.

Chart shows Ambivalent Right: Most favor smaller government; majority supports legalization of marijuana for medical and recreational use

But they diverge from several other Republican-oriented groups on several social issues, immigration and, in some cases, foreign policy.

Just over half (54%) say abortion should be legal in all or most cases, a view held by far smaller shares of those in other GOP groups. And six-in-ten Ambivalent Right say that marijuana should be legal for both recreational and medical use by adults – identical to the share of the overall public saying this, but a view not held by most of those in other GOP-oriented groups. Ambivalent Right also are as likely to say that same-sex marriage being legal is good for society (28%) as to say that it is bad for society (29%); 43% say it is neither good nor bad. In each of the other Republican-oriented groups, more say legal same-sex marriage is bad for society than say it is good.

Three-quarters say that America’s openness to people from all over the world is “essential to who we are as a nation,” compared with no more than a third of those in other Republican-oriented groups. They are also substantially more likely than those in other GOP groups to say that good diplomacy, rather than military strength, is the best way to ensure peace.

Ambivalent Right are about evenly divided over whether the Republican Party represents them well

Chart shows half of Ambivalent Right say the GOP represents them well; fewer say Democratic Party represents them well

Ambivalent Right don’t feel entirely at home in either party. While they lean toward the GOP on many issues, they tilt more moderate to liberal on some others, and their ambivalence is expressed in their assessments of the Republican Party itself.

Half of Ambivalent Right say that the Republican Party represents them either very (4%) or somewhat (46%) well, while a quarter say that the Democratic Party represents them well. Even taking into account the partisan composition of this group, Ambivalent Right who identify as or lean Republican are substantially less likely than Republicans in other GOP-oriented groups to say the party represents them well.

Ambivalent Right: Who they are

Ambivalent Right are younger and more racially and ethnically diverse than other Republican-oriented groups. They are also somewhat less religiously affiliated: 27% are religiously unaffiliated, compared with 20% of Populist Right, 18% of Committed Conservatives and just 6% of Faith and Flag Conservatives.

They are similar to the general population on both household income and education: 28% live in lower-income households (compared with 31% of all U.S. adults), 48% live in middle-income households (vs. 47% of all adults) and 19% live in upper-income households (vs. 17% of all adults). About a third (35%) have a college degree, roughly the same share as among the adult population overall (32%).

Ambivalent Right are less likely than other Republican-oriented groups to turn to Fox News for their political news. Half report getting news from Fox News over the course of a week, compared with at least six-in-ten or more in each of the other Republican-oriented groups.

7. Stressed Sideliners

Mixed political views, low interest in politics

Note: For a new and fully revised version of Pew Research Center’s political typology (published June 2026), read “Beyond Red vs. Blue: The 2026 Political Typology.”

Chart shows Stressed Sideliner are ...

Stressed Sideliners are generally disconnected from politics and the two major parties, voting at lower rates than most other typology groups. Although Stressed Sideliners make up 15% of American adults, they were just 10% of 2020 voters due to their relatively low turnout rate. Still, they represent substantial shares of both parties’ coalitions.

Stressed Sideliners are split evenly between those who identify with or lean toward the Republican Party (45%) and those who are Democrats or Democratic leaners (an identical 45%). One-in-ten say they don’t lean toward either party. While they tend to fall close to the average American on many issues, they lean liberal on economic issues and tilt conservative on some social issues.

A large majority (83%) say the economic system in this country unfairly favors the powerful, and about three-quarters (74%) favor raising the minimum wage to $15 per hour. Roughly a third of Stressed Sideliners (35%) say that same-sex marriage being legal in the United States is bad for society, compared with 26% who say this is good (39% say it is neither good nor bad for society).

About four-in-ten Stressed Sideliners (43%) live in lower-income households, higher than most other political typology groups. And they are the group most likely to describe their personal financial situation as only fair or poor (63% say this). Stressed Sideliners are also one of the least highly educated groups.

Political affiliation, voting and engagement

Chart shows Stressed Sideliners are about equally likely to have voted for Biden and Trump

About two-in-ten Stressed Sideliners consider themselves Republican (23%), while a similar share identify as Democrats (19%), but a majority say they are either independent (34%) or identify as “something else” (20%). Taking both party identification and partisan leaning into account, they are evenly split (at 45% each) between the two major parties.

Chart shows Stressed Sideliners rate Republicans and Democrats similarly

This group also rates the parties similarly on a 0 to 100 “feeling thermometer.” Stressed Sideliners give Democrats an average rating of 45 – slightly cooler than the midpoint of 50 – and they give Republicans a nearly identical average rating of 44.

Stressed Sideliners who voted in the 2020 presidential election were about equally likely to choose Donald Trump (49%) or Joe Biden (48%). About four-in-ten (39%) say they approve of the job Biden is doing as president as of a September survey, higher than the share in any of the four Republican-oriented groups but lower than the share in any of the four Democratic-oriented groups.

Chart shows Stressed Sideliners were the least likely to vote in the 2020 presidential election

Fewer than half (45%) of Stressed Sideliners who are adult citizens voted in the 2020 presidential election. This turnout rate was 10 percentage points lower than the next lowest group (Ambivalent Right, at 55%) and 21 points lower than among all adult citizens. Few in this group express much interest in politics more generally: Just 19% say they follow what’s going on in government and public affairs most of the time.
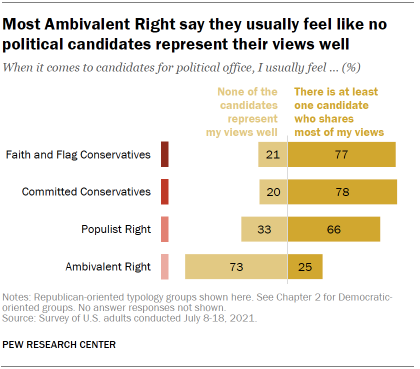
Stressed Sideliners: Key political attitudes and beliefs

Stressed Sideliners fall in between the Republican and Democratic coalitions in many of their key attitudes about government. For instance, about six-in-ten (59%) say that government regulation of business is necessary to protect the public interest, similar to the 55% of all adults who say this.

Chart shows Stressed Sideliners: Liberal economic views, more conservative on death penalty

On economic issues, this group generally leans liberal. About seven-in-ten (72%) favor making tuition at public colleges and universities free to all American students. Majorities also say that the federal government has the responsibility to provide all Americans health insurance (74%) and an adequate standard of living (64%).

Stressed Sideliners are somewhat more conservative on some social issues. Seven-in-ten favor the death penalty for people convicted of murder. And Stressed Sideliners are 11 percentage points less likely than adults overall to say that there are still significant obstacles that make it harder for women to get ahead than men.

They also express lower levels of social trust than average: About three-quarters (77%) say “you can’t be too careful dealing with people,” compared with 66% of the general public.

Low political engagement

Nearly two-thirds of Stressed Sideliners (65%) say that, when they were growing up, close family did not talk about government and politics at home much or at all. Those in this group are also more likely to express lower levels of political interest and are less certain about their political views today.

Roughly six-in-ten Stressed Sideliners (62%) say that most big issues facing the country today don’t have clear solutions, a higher share than those who say this in any of the three most Republican or the three most Democratic groups.

About a quarter (24%) of Stressed Sideliners who are registered to vote say they aren’t sure who they would vote for if the 2022 elections for the U.S. House of Representatives were held today, slightly higher than the share of registered Ambivalent Right who say this (19%) and higher than the share in any other group. Four-in-ten also didn’t have an opinion about the $1.2 trillion bipartisan infrastructure bill under consideration in Congress, a September survey found.

Chart shows nearly two-thirds of Stressed Sideliners say they did not discuss politics with their family while growing up

This group exhibits less partisan animosity than other typology groups. A majority (56%) say that, while people who supported a different candidate in the 2020 presidential election may feel differently about politics, they probably share many of the same values and goals. Only one other group, Ambivalent Right, contains a majority who say this; in all other groups, at least half say that they probably don’t share many other values and goals with those who supported a different presidential candidate.

Stressed Sideliners: Who they are

A majority of Stressed Sideliners (56%) are women. Roughly six-in-ten (57%) are White, while 21% are Hispanic, 10% are Black and 5% are Asian. They generally look similar to U.S. adults overall in terms of age: 18% are under the age of 30, 34% are between 30 and 49, 31% are 50 to 64, and 17% are 65 and older. Stressed Sideliners’ religious affiliation and practices largely parallel the population as a whole.

Stressed Sideliners have less formal educational experience and lower household incomes than other groups. Nearly half (48%) have only a high school diploma or less education, while 29% have some college experience but no degree and 22% have a college degree. About one-in-four (43%) live in lower-income households, with just 10% living in upper-income households. And Stressed Sideliners are the most likely of any group to say they don’t have a savings account; a third of this group says this.

8. Outsider Left

Note: For a new and fully revised version of Pew Research Center’s political typology (published June 2026), read “Beyond Red vs. Blue: The 2026 Political Typology.”

Chart shows Outsider Left are ...

Outsider Left are the youngest typology group, making up 10% of the public. Holding liberal views on most issues and overwhelmingly voting Democratic, they aren’t particularly enamored with the Democratic Party – though they have deeply negative views of the GOP.

Nearly half of Outsider Left (48%) describe their own political views as liberal, including 20% who say their views are very liberal. But despite their liberal tilt, only about three-in-ten identify as Democrats; about half (53%) instead say they are independents who lean toward the Democratic Party.

Like Progressive Left, Outsider Left hold liberal views on most social issues, and particularly on issues of racial and ethnic equality and on immigration. Outsider Left are somewhat more skeptical of government’s role than other Democratic-oriented groups, though far less so than those in GOP-oriented groups.

Weaker attachment to the Democratic Party than other Democratic-leaning groups does not translate into positive attitudes toward Republicans among Outsider Left: Three-quarters say they feel very coldly toward Donald Trump, and just 13% say the Republican Party represents them very or somewhat well.

Political affiliation, voting and engagement

Chart shows Outsider Left are a solidly Democratic group, but Democratic-leaning independents make up a much larger share than in other groups
Chart shows Outsider Left: Lukewarm toward Democrats, cold toward Republicans

Outsider Left don’t feel very warmly toward the Democratic Party, despite the large share who lean in its direction and the overwhelming share who vote Democratic. On a “feeling thermometer” ranging from 0-100, where 100 represents the warmest, most positive feelings, Outsider Left give Democrats an average rating of 52, indicating feelings that are almost perfectly neutral. And they are significantly colder toward Republicans, giving them an average rating of 27.

Outsider Left were – along with Progressive Left – the most likely to back Sen. Bernie Sanders in the 2020 Democratic primaries. Nearly four-in-ten (38%) supported Sanders in January 2020, compared with 18% who supported Sen. Elizabeth Warren and just 12% who backed Joe Biden.

Chart shows Outsider Left are less likely than others to vote, don’t closely follow politics

This group remains relatively cool on Biden when compared with other Democratic-oriented groups today. While a September survey found a majority (62%) approving of the president’s job performance, the share who say this is smaller than in each of the three other Democratic-oriented groups.

Outsider Left, like Stressed Sideliners and Ambivalent Right, are less politically engaged than other typology groups. Eligible Outsider Left were 9 percentage points less likely to vote in the 2020 presidential election than the average adult citizen and 11 points less likely to vote than the average Democrat or Democratic-leaning citizen. Only about two-in-ten (21%) say they follow what’s going on in government and politics most of the time.

Outsider Left: Key political attitudes and beliefs

More than nine-in-ten Outsider Left (94%) say that the economic system in this country unfairly favors powerful interests. Nearly half in this group (48%) say that government is almost always wasteful and inefficient, higher than in other Democratic-leaning groups. They are dissatisfied with national conditions: Just 26% say they are satisfied with the way things are going in the country, which is lower than other Democratic-aligned groups except Progressive Left.

Chart shows Outsider Left: Liberal, but skeptical of Democrats and the federal government

Roughly six-in-ten (63%) say that there are other countries that are better than the United States, one of only two groups in which a majority says this (majorities in other groups say the U.S. is either among a small number of the greatest countries in the world or say the U.S. stands above all other countries).

To some degree reflecting the relative youth of this group, there is widespread support for making tuition at public colleges and universities free for all American students. Outsider Left are also very liberal on issues related to race and immigration. In addition, 41% favor cutting spending on local police, similar only to Progressive Left, and 54% say that the number of legal immigrants admitted to the U.S. should increase.

Outsider Left don’t feel quite at home in the Democratic Party

Although their political values place them decidedly on the left of the political spectrum, and they overwhelmingly vote Democratic when facing a choice between Democratic and Republican candidates, Outsider Left don’t feel particularly well-represented by the Democratic Party. Just 53% say the Democratic Party represents them at least somewhat well – eight-in-ten or more in other Democratic-oriented groups say this. And an overwhelming majority (86%) say that they usually feel like none of the candidates for public office represent their views well.

Chart shows most Outsider Left say they usually feel like no candidates for political office represent their views well

Outsider Left also are the typology group least likely to say there are substantial distinctions between the two parties: Just 23% say there is a great deal of difference between what the Democratic and Republican parties stand for.

Registered voters in the Outsider Left are much less likely to say it really matters which party wins control of Congress next year than those in most other political typology groups.

Outsider Left: Who they are

Outsider Left are by far the youngest political typology group. Four-in-ten are under the age of 30 and 83% are under 50. They are racially and ethnically diverse: About half (49%) are White, 20% are Hispanic, 15% are Black and 10% are Asian. Women make up 57% of this group.

Outsider Left also have somewhat less formal education than Establishment Liberals or the Progressive Left: 35% have at least a college degree. Two-in-ten members of this group are either full-time (14%) or part-time (6%) students, similar to the share of students in the Progressive Left and higher than the shares in any other group.

About half of Outsider Left (55%) say that their personal finances are in only fair or poor shape, a somewhat higher share than the public as a whole. However, nearly half (48%) expect their financial situation to be better a year from now, compared with 36% of the public who say this.

Outsider Left are one of the least religiously affiliated groups, alongside the Progressive Left. About half (51%) are religiously unaffiliated. Outsider Left are less likely to attend religious services regularly or say that practicing their religion is one of the most important things in their lives compared with all U.S. adults.

9. Democratic Mainstays

Note: For a new and fully revised version of Pew Research Center’s political typology (published June 2026), read “Beyond Red vs. Blue: The 2026 Political Typology.”

Chart shows Democratic Mainstays are ...

Democratic Mainstays are one of the largest groups in the political typology and the largest single group as a share of the Democratic coalition. They generally favor policies that expand the social safety net and support higher taxes on corporations. But they are somewhat more hawkish than other Democratic-oriented groups on foreign policy and less liberal on immigration policy and some social issues.

Like their fellow Democratic coalition group, Establishment Liberals, they are very committed to the Democratic Party – nearly half (49%) consider themselves “strong Democrats.” Democratic Mainstays were among Joe Biden’s strongest supporters in the 2020 Democratic primaries, and 92% voted for him in the November 2020 general election. As of September 2021, nearly eight-in-ten (79%) say they approve of the president’s job performance, with roughly six-in-ten (59%) saying they strongly approve.

Democratic Mainstays are slightly older and have less formal education than other Democratic-oriented groups. They are the group with the largest share of Black non-Hispanic adults (26%), and six-in-ten are women.

They are the only Democratic-oriented typology group in which a larger share say that the decline in the share of Americans belonging to an organized religion is bad for society than say this is good for society. Democratic Mainstays also are more religiously observant than other Democratic-oriented groups.

Political affiliation, voting and engagement

Chart shows Democratic Mainstays overwhelmingly backed Biden, but small shares affiliate with the GOP and voted for Trump
Chart shows Democratic Mainstays are very warm toward the Democratic Party

Nearly seven-in-ten Democratic Mainstays identify as Democrats (69%), with 49% considering themselves strong Democrats. About two-in-ten (21%) are independents who lean toward the Democratic Party. A small share (7%) identify with or lean toward the GOP (roughly the same share – 5% – voted for Donald Trump in the 2020 presidential election).

More than half of Democratic Mainstays (58%) describe themselves as moderate. Three-in-ten say they are liberal, while 9% say they are conservative.

Chart shows two-thirds of Democratic Mainstays voted in the 2020 presidential election

Democratic Mainstays feel particularly warm toward Democrats – only Establishment Liberals rate Democrats as highly on average. They rate Republicans coolly and offer very negative evaluations of Trump (giving him an average rating of 10).

Democratic Mainstays were about as likely to vote in the 2020 presidential election as adult citizens were overall: About two-thirds of this eligible voters in this group voted (68%). They are also about as likely as the average adult to say they follow what’s going on in government and public affairs most of the time: 35% of Democratic Mainstays say this, compared with 34% of all adults.

Democratic Mainstays: Key political attitudes and beliefs

On many issues, Democratic Mainstays hold similar positions to other Democratic-oriented groups. About eight-in-ten (79%) prefer a bigger government providing more services over a smaller one providing fewer services. They overwhelmingly (85%) favor raising the minimum wage to $15 an hour, and nearly eight-in-ten (78%) say that a lot more needs to be done to ensure equal rights for all Americans regardless of their racial or ethnic backgrounds.

Chart shows Democratic Mainstays: More than half are proud of the Democratic Party, and most say the country needs to do more to address racial inequities

Still, there are some issues where Democratic Mainstays express significantly different views than those in some other Democratic-oriented groups. For example, when it comes to criminal justice, a majority of Democratic Mainstays (59%) favor the death penalty in cases of murder, and about seven-in-ten (73%) say that violent crime is a very big problem in the country today. Mainstays overwhelmingly think that funding for police in their area should either stay the same (42%) or be increased (47%); just 11% say it should be decreased.

Democratic Mainstays are also less likely to favor expansive policies on immigration than other Democratic-oriented groups: 28% think the number of legal immigrants admitted to the country should increase, compared with 44% of Establishment Liberals and majorities of Outsider Left (54%) and Progressive Left (63%). And they are the typology group most likely to say that both border security and a path to citizenship should be given equal priority in dealing with illegal immigration in the U.S. – 57% say this.

Democratic Mainstays are the sole Democratic-oriented group in which a majority (80%) say U.S. policies should try to keep it so America is the only military superpower, and 84% say the size of America’s military should either stay the same (50%) or increase (35%).

When it comes to the Democratic Party, Democratic Mainstays are consistently one of the most positive typology groups. More than half (54%) say the Democratic Party makes them feel proud, similar to the share of Establishment Liberals who say this (57%) and higher than in any other group. And about half (48%) say that they are basically content with the federal government.

People causing offense and people being too easily offended

About two-thirds of Americans (65%) say people being too easily offended by what others say is a major problem in the country today, and about half (53%) say that people saying things that are very offensive to others is a major problem. But these views differ along partisan lines: Most Republicans say people getting too easily offended is a major problem but don’t say the same about offensive speech, while Democrats are more likely to say offensive speech is a major problem than to say people being too easily offended is a major problem. For the most part, the position of the typology groups largely reflects their partisan composition.

Chart shows majorities of Democratic Mainstays say that people saying very offensive things is a major problem in the country – and so is people being too easily offended

But Democratic Mainstays are an exception. Like their fellow Democratic-oriented groups, a majority of Democratic Mainstays (76%) say that people saying offensive things to others is a major problem in the country (in fact, they are the typology group most likely to say this). Yet a similarly large share of this group – 81% – say that people being too easily offended is a major problem, making them as likely as the GOP-oriented groups to say this.

Democratic Mainstays and Stressed Sideliners are the only groups in which majorities see both offensive speech and people being too easily offended by things others say as major problems in the country.

Democratic Mainstays: Who they are

Six-in-ten Democratic Mainstays are women. A majority (55%) are ages 50 and older, including 27% who are 65 and older.

Democratic Mainstays are among the most diverse groups in terms of race and ethnicity. Fewer than half (46%) are White, 26% are Black, 20% are Hispanic and 4% are Asian.

Three-quarters of Democratic Mainstays (75%) are religiously affiliated, the highest share among the Democratic-oriented groups. A quarter of Democratic Mainstays are Catholic, while 43% are Protestant. Democratic Mainstays have the largest share of Black Protestants of the political typology groups: 20%.

Democratic Mainstays are more likely than those in other Democratic-oriented groups to say practicing their religious faith is among the most important things to them personally (35%), while 76% say spending time with family is among the most important. They also attend religious services more frequently than those in other Democratic-oriented groups.

10. Establishment Liberals

Note: For a new and fully revised version of Pew Research Center’s political typology (published June 2026), read “Beyond Red vs. Blue: The 2026 Political Typology.”

Chart shows Establishment Liberals are ...

Holding liberal positions on nearly all issues, Establishment Liberals are some of the strongest supporters of the current president and the Democratic Party of any political typology group.

While deeply liberal – roughly half describe themselves as either liberal (41%) or very liberal (12%) – Establishment Liberals are the typology group most likely to see value in political compromise and tend to be more inclined toward more measured approaches to societal change than their Progressive Left counterparts. Like other Democratic-oriented groups, most Establishment Liberals (73%) say a lot more needs to be done to ensure racial equality. Yet they are the only Democratic-aligned group in which a majority of those who say a lot more needs to be done also say this can be achieved by working within the current system.

Establishment Liberals’ gender, age and racial and ethnic profile generally parallels that of the Democratic Party as a whole: They comprise more women than men (53% vs. 46%) and more are under the age of 50 than 50 and older. About half of Establishment Liberals (51%) are White, while 18% are Black, two-in-ten are Hispanic and one-in-ten are Asian.

Establishment Liberals are one of two typology groups in which nearly half (47%) have college degrees (a quarter have postgraduate degrees). About one-in-five (23%) live in upper-income households, a higher share than in any other Democratic-oriented typology group.

Establishment Liberals stand out for their current satisfaction with the direction of the country and optimism about the future. Roughly half (51%) say they are satisfied with the way things are going in the country today, compared with 36% of Democratic Mainstays and even smaller shares in other typology groups.

Establishment Liberals: Political affiliation, voting and engagement

Chart shows fully half of Establishment Liberals identify strongly with the Democratic Party
Chart shows Establishment Liberals are very warm toward the Democratic Party

An overwhelming majority of Establishment Liberals either identify with or lean toward the Democratic Party. About half say they strongly identify with the Democratic Party (51%), 18% identify as Democrats but not strongly and about a quarter (24%) lean toward the Democratic Party.

Establishment Liberals feel quite warmly toward the Democratic Party. On a “feeling thermometer” ranging from 0 to 100, where 100 represents the warmest, most positive feelings, Establishment Liberals give Democrats an average rating of 77, identical to the average rating among Democratic Mainstays and higher than any other group. Establishment Liberals are also fairly cold toward Republicans, giving them an average rating of just 20.

Chart shows Establishment Liberals: More engaged than average

An overwhelming majority of Establishment Liberals approve of Joe Biden’s job performance as president as of mid-September, including six-in-ten who strongly approve. And about eight-in-ten Establishment Liberals (83%) say they approve of the job Democratic leaders in Congress are doing, 11 percentage points higher than the share who say this in any other group.

This group is highly politically engaged, though somewhat less so than the two most engaged groups (the Progressive Left and Faith and Flag Conservatives). Establishment Liberals vote at higher rates than many other groups: 78% of those eligible cast ballots in 2020, which is 12 percentage points higher than the general population and 10 points higher than Democrats and Democratic leaners overall.

About four-in-ten (44%) say they follow what’s going on in government and public affairs most of the time.

At the start of the 2020 Democratic primaries, Biden was the first choice of about three-in-ten Establishment Liberals, with substantial shares of Establishment Liberals also supporting Sens. Elizabeth Warren (17%) and Bernie Sanders (16%), as well as then-Mayor Pete Buttigieg (10%).

Establishment Liberals: Key political attitudes and beliefs

On many dimensions, particularly views about the role of government in society, Establishment Liberals are second only to Progressive Left in the uniformity of their liberal positions.

Chart shows Establishment Liberals: Solidly liberal, hopeful about the Democratic Party

About eight-in-ten Establishment Liberals (83%) say they favor a bigger government providing more services, though in contrast to their Progressive Left counterparts they are more likely to say that government services should be modestly – as opposed to greatly – expanded. Overwhelming majorities in this group also say that government should do more to solve problems (88%), that government regulation of business is necessary to protect the public interest (86%) and that government often does a better job than people give it credit for (75%).

Nearly nine-in-ten Establishment Liberals (89%) say that compromise is how things get done in politics, higher than the share in any other political typology group. And about eight-in-ten (82%) say the Democratic Party makes them feel hopeful, which is the highest share of any group.

Establishment Liberals are upbeat about the country

Establishment Liberals are more optimistic about the country and its future than other political typology groups. They are more likely to say they are satisfied with the way things are going and to approve of Biden, and their relatively positive views extend to other attitudes as well.

Chart shows Establishment Liberals are more satisfied with the way things are going in the country than other typology groups

Establishment Liberals are the only group in which a majority (57%) now say that life in America is better today than it was 50 years ago for people like them. Establishment Liberals also view current economic conditions more positively than those in other typology groups: 48% say that conditions are either excellent (3%) or good (45%), compared with no more than about a third of any other group. And they have a more positive economic outlook than most other groups: 55% say the economy will be better a year from now.

Establishment Liberals: Who they are

Establishment Liberals are one of the two most educated typology groups, alongside the Progressive Left. Members of this group are 15 percentage points more likely than U.S. adults overall to have a college degree, and 11 points more likely to have a postgraduate degree. They are also among the most well-traveled typology groups. Nearly two-in-ten (19%) say they have visited 10 or more countries outside the United States.

Establishment Liberals are quite similar to U.S. adults overall in terms of age: 19% of this group are between the ages of 18 and 29, 34% are ages 30 to 49, 24% are 50 to 64, and 23% are 65 and older. This typology group is roughly tied for the second highest share of Black adults of any typology group (18%, compared with 15% of Outsider Left, though both trail the 26% of Democratic Mainstays) and is tied with the Outsider Left for the highest share of Asian adults (10%). About half of this group (51%) are White adults and 20% are Hispanic adults.

Nearly nine-in-ten Establishment Liberals (88%) said they had received all of the necessary shots to be fully vaccinated against COVID-19 as of August 2021, the second-highest share of any group after the Progressive Left. And about two-thirds of Establishment Liberals (68%) report getting political news from CNN in a typical week, making the cable network their most-used source out of 26 major outlets asked about in March 2021.

11. Progressive Left

Note: For a new and fully revised version of Pew Research Center’s political typology (published June 2026), read “Beyond Red vs. Blue: The 2026 Political Typology.”

Chart shows Progressive Left are ...

Reflecting their name, Progressive Left have very liberal views across a range of issues – including the size and scope of government, foreign policy, immigration and race. A sizable majority (79%) describe their views as liberal, including 42% who say their views are very liberal – double the share of the next largest group (20% of Outsider Left).

Roughly two-thirds of Progressive Left (68%) are White, non-Hispanic, by far the largest share among Democratic-aligned groups. Progressive Left are the second youngest typology group – 71% are ages 18 to 49. Progressive Left are also highly educated, with about half (48%) holding at least a four-year college degree, making it one of the two most highly educated groups overall.

Progressive Left are more liberal than the three other Democratic-oriented groups on many issues. For example, while majorities in all four of these groups favor a bigger government providing more services, Progressive Left are most likely to express this view. When asked a follow-up question about how much bigger the government should be, 63% of Progressive Left say government services should “greatly expand” from current levels – a far higher share than any other group.

Their liberal outlook is not limited to issues related to the size and scope of government. Their views on race and racial equality also distinguish them from other typology groups: Sizable majorities say White people benefit from societal advantages that Black people do not have and that most U.S. institutions need to be completely rebuilt to ensure equal rights for all Americans regardless of race or ethnicity.

Progressive Left broadly support substantial hikes in tax rates for large corporations and high-income households. They are the only typology group in which a majority express positive views of political leaders who describe themselves as democratic socialists. And Progressive Left are more likely than any other typology group to say there are other countries that are better than the U.S.

Although they are one of the smallest political typology groups, Progressive Left are the most politically engaged group in the Democratic coalition. No other group turned out to vote at a higher rate in the 2020 general election, and those who did nearly unanimously voted for Joe Biden. They donated money to campaigns in 2020 at a higher rate than any other Democratic-oriented group.

Political affiliation, voting and engagement

Chart shows Progressive Left: Overwhelmingly Democratic and nearly unanimous in their support for Joe Biden in 2020

Nearly all Progressive Left (98%) either identify with or lean toward the Democratic Party: 46% say they strongly identify with the party. About a third (32%) are independents who lean toward the Democratic Party.

Chart shows Progressive Left have very cold feelings about Republicans

Progressive Left are defined in part by their antipathy toward the Republican Party. On a “feeling thermometer” ranging from 0-100, where 100 represents the warmest, most positive feelings, Progressive Left give Republicans an average rating of just 10 – by far the lowest of any group. Their feelings toward Democrats are significantly warmer, though they are somewhat less warm on average than Establishment Liberals and Democratic Mainstays.

This group is also one of the most politically engaged typology groups: 86% of eligible Progressive Left voted in the 2020 election. Among typology groups, that is only rivaled by Faith and Flag Conservatives. Slightly fewer than half (44%) say they follow what’s going on in government and public affairs most of the time, 10 percentage points higher than among all adults.

Chart shows Progressive Left highly engaged with politics

In the days leading up to the start of the 2020 Democratic primaries, 35% of Progressive Left Democratic voters supported Sen. Bernie Sanders, while nearly as many (28%)  supported Sen. Elizabeth Warren; far fewer backed Biden (15%). They were more likely to support Warren than those in any other political typology group and expressed support for Sanders at a level similar to the Outsider Left (38% of whom favored Sanders).

While Progressive Left largely backed candidates other than Biden during the 2020 Democratic primaries, they overwhelmingly voted for him in the general election and now solidly support him. A September survey found a large majority approves of Biden’s job performance (82%), and majorities express confidence in his handling of most issues.

Progressive Left: Key political attitudes and beliefs

Progressive Left are the only typology group in which a majority (62%) says that success in life is largely outside of an individual’s control. And when asked to compare the U.S. to other countries – whether the U.S. is better than all other countries, is among the best countries, or there are other countries that are better – 75% of Progressive Left say there are other countries better than the U.S., the highest share among typology groups.

Chart shows Progressive Left: Very liberal across a broad spectrum of issues

While Progressive Left overwhelmingly favor an expanded social safety net, they also broadly support raising tax rates on large businesses and corporations as well as on household incomes above $400,000. They are also far more likely than any other typology group to say that the fact that there are some people with personal fortunes in the billions is bad for society.

A large majority of Progressive Left (86%) say that people who have immigrated to the United States illegally generally make the communities they live in better. They also are more supportive than other political typology groups of increasing the number of legal immigrants coming to the U.S. Progressive Left also are particularly likely to say that greater social acceptance of people who are transgender is a good thing for the U.S. – 88% say this, including 75% who say this has been very good for the country.

Progressive Left stand out for support for Black Lives Matter, perceptions of White advantage and on other racial attitudes

While Progressive Left hold more liberal views than the other political typology groups on a range of topics, this is particularly evident when it comes to their attitudes on issues relating to race and racial equality.

Overall, Democrats generally are far more likely than Republicans to express a positive view of the Black Lives Matter movement. More than eight-in-ten Democrats and Democratic-leaning independents (85%) say they support the movement, compared with just 19% of Republicans and Republican leaners. However, three-quarters of Progressive Left say they strongly support the Black Lives Matter movement, substantially higher than the other Democratic-oriented typology groups.

Chart shows in their opinions about race in America, Progressive Left stand out

A similar pattern is evident in opinions about whether White people benefit a lot from advantages that Black people do not have and whether most U.S. laws and institutions need to be completely rebuilt because they are fundamentally biased against some races and ethnicities.

Progressive Left also diverge from some other Democratic-oriented groups on the issue of funding for police departments. Nearly half of Progressive Left (48%) say spending on police in their area should be decreased a lot or a little, a view held by just 22% of Establishment Liberals and 11% of Democratic Mainstays.

Progressive Left: Who they are

Nearly seven-in-ten Progressive Left (68%) are White adults, making this group less racially and ethnically diverse than the other Democratic-oriented groups – though still more diverse than the three most conservative groups in the typology.

Progressive Left are the second youngest political typology group (Outsider Left are the youngest), and they are substantially younger than the overall population. About a third (34%) are under the age of 30 and 71% are under the age of 50. They also are one of the two groups (along with Establishment Liberals) with the highest share of college graduates: About half of Progressive Left (48%) have a college degree.

Roughly half of Progressive Left (52%) are religiously unaffiliated, which is comparable to the share among Outsider Left and higher than other political typology groups.

Progressive Left have been particularly cautious when it comes to the coronavirus pandemic: In late August, 79% reported wearing a mask all or most of the time when in stores and other businesses. And, as of that same period, 94% said they had received all of the required shots to be fully vaccinated – the highest share of any group.

Roughly two-thirds (68%) say they would prefer to live in a community with smaller houses that are closer together, also the highest of any typology group. And members of this group are particularly likely to get political news from NPR and The New York Times in a typical week.

12. Political engagement among typology groups

Note: For a new and fully revised version of Pew Research Center’s political typology (published June 2026), read “Beyond Red vs. Blue: The 2026 Political Typology.”

The typology groups at either end of the political spectrum, Faith and Flag Conservatives and Progressive Left, are also the most politically engaged – that is, they voted at the highest rates in the 2020 presidential election, and they are most likely to say they post about politics on social media and that they donated to campaigns. The groups in the middle of the ideological spectrum have much lower levels of political engagement.

Chart shows Faith and Flag Conservatives, Progressive Left turned out to vote at higher rates than other typology groups

This pattern is not new. Pew Research Center’s 2014 study of partisan polarization found that “many of those in the center remain on the edges of the political playing field, relatively distant and disengaged, while the most ideologically oriented and politically rancorous Americans make their voices heard through greater participation in every stage of the political process.”

This is often referred to as the “U shape” in political engagement. Voter turnout of the typology groups in the 2020 election largely fits this pattern: About 85% of citizens in these more ideological groups were validated voters in 2020 (86% for Progressive Left and 85% for Faith and Flag Conservatives).

Moving from either of end of the typology toward slightly more ideologically mixed groups shows a gradual decrease in turnout. Establishment Liberals and Committed Conservatives turned out at slightly lower rates (78% each), though both groups still participated at substantially higher rates than the overall population. Democratic Mainstays and Populist Right were somewhat lower still (68% and 67%, respectively). Outsider Left diverge slightly from this pattern – while they are notably more liberal than conservative, and more liberal than Democratic Mainstays, they voted at a lower rate (57%).

Ambivalent Right, a relatively mixed group ideologically, also had lower turnout (55%), while the very politically mixed Stressed and Sidelined turned out at the lowest rate (45%) of all the groups.

Chart shows political interest and attention lower among groups in the middle of the political typology

While there are demographic differences between the groups that are also associated with political participation, different rates of participation between the groups persist even after accounting for demographic composition. For example, Progressive Left are among the groups with the highest levels of formal education. Nearly half of this group (48%) has a bachelor’s degree or more education, and education is strongly associated with turnout. Yet Progressive Left without a bachelor’s degree voted at rates higher or as high as members of other groups with college degrees, and the same can be said about Faith and Flag Conservatives without a college degree.

The more ideological groups are most likely to have reported contributing money to candidates and political organizations in 2020, to post support for a candidate or campaign on social media, and to attend political rallies in person or virtually (for more examples of this pattern, see the detailed tables).

The generally U-shaped pattern also shows up across other measures of political engagement and interest. The more ideological groups register much higher levels of interest in politics. More than half of Faith and Flag Conservatives (55%) say they follow what is going on in government most of the time, followed by Progressive Left (44%), Establishment Liberals (41%) and Committed Conservatives (42%). By comparison, only 19% of Stressed Sideliners say they keep such close tabs on politics and government.

Chart shows civic involvement varies only modestly across political typology groups

As with political participation, this pattern shows up across a range of different measures. For instance, Progressive Left and Faith and Flag Conservatives are generally more likely than other groups to talk about politics frequently.

However, this U-shaped pattern seems to be largely confined to political engagement. By comparison, there are only modest differences across typology groups in the shares saying it is important for them to be involved in their local communities. There is also not the same discernable pattern when it comes to reports of volunteering. About 25% to 35% in each group say they have spent time volunteering at some point over the past year.

13. How the political typology groups view major issues

Note: For a new and fully revised version of Pew Research Center’s political typology (published June 2026), read “Beyond Red vs. Blue: The 2026 Political Typology.”

On nearly every issue – including the economy, role of government, voting and elections, race and immigration policy – there are differences in opinions among the nine groups in the political typology. While most differences break down along partisan lines, the typology also reveals several issues where there are notable cleavages within the partisan coalitions, not simply between them.

This generally is not the case when it comes to opinions about the size and scope of government; on these issues, there are wide differences between Republicans and Democrats, but relatively modest differences within each partisan coalition. Sizable majorities in the Democratic-oriented typology groups say that the government should do more to solve problems and that it has a responsibility to make sure all Americans have health coverage. Democrats also widely reject the view that “it is not the government’s job to protect people from themselves.” Note: For full question wording and distribution on each question, see detailed tables.

Chart shows views of government’s role and performance mostly are divided along partisan lines

Republican-oriented groups largely say it is not the government’s job to protect people from themselves and that it should not do more to solve problems. Majorities across GOP-aligned groups also say the government does not have a responsibility to provide health coverage, although nearly four-in-ten Ambivalent Right (38%) say it has this responsibility.

In views of government performance, majorities across Republican-oriented groups say government is “almost always wasteful and inefficient.” Democratic-oriented groups mostly take the opposite view, that government “often does a better job than people give it credit for.” However, nearly half of Outsider Left (48%) say government is almost always inefficient, the highest among Democratic groups. Note: For full question wording and distribution on each question, see detailed tables.

Within the GOP, divides over the fairness of the economic system

The Republican coalition generally has a conservative outlook on taxes, the impact of large corporations and the fairness of the U.S. economic system, with one notable exception: On several issues, the views of Populist Right are closer to Democratic-aligned groups than to other Republican groups.

An overwhelming share of Populist Right (87%) say the U.S. economic system unfairly favors powerful interests; that is more than 40 percentage points higher than any other GOP-aligned group. And Populist Right is the only Republican-oriented group in which a majority (56%) favors raising tax rates on large businesses and corporations.

Republican groups are more in agreement with their negative opinions of labor unions. In this case, however, Faith and Flag Conservatives stand out for their highly critical view (80% say labor unions have a negative impact on the way things are going in the country).

In general, when it comes to economic issues, Democratic-oriented groups are largely united in their skepticism toward corporate power and the fairness of the U.S. economic system. Overwhelming shares in all Democratic-oriented groups say that tax rates on large businesses and corporations, as well as on household incomes over $400,000, should be raised. The Democratic coalition – especially Progressive Left and Establishment Liberals – also express very positive views of unions and broadly support for raising the federal minimum wage to $15 an hour.

Chart shows Populist Right diverge from others in the GOP coalition with support for higher taxes on corporations, belief that U.S. economic system unfairly favors powerful interests

While Stressed Sideliners have more mixed views of business and labor than those of partisan typology groups, a large share (83%) say that the economic system in this country unfairly favors powerful interests – an attitude that more closely aligns with views expressed by those in Democratic-oriented groups. Similarly, a 58% majority say labor unions have a positive effect on the way things are going in the country. Note: For full question wording and distribution on each question, see detailed tables.

Views on race underscore deep partisan divisions, intraparty differences

Perhaps no issue area highlights the deep divide between the partisan coalitions – and within them – more clearly than attitudes about race and racial justice.

Among Democratic-oriented groups, Progressive Left stand out for their firm belief that a lot more needs to be done to ensure equal rights for all, regardless of race or ethnicity, and that Black people face a lot of discrimination, as well as for their strong support of the Black Lives Matter movement.

Chart shows Faith and Flag Conservatives, Committed Conservatives and Populist Right more likely to see ‘a lot’ of discrimination against White people than Black people

Conversely, Faith and Flag Conservatives diverge from Democratic groups – and other Republican-aligned groups – with their attitudes on race. For example, while small shares across Republican groups say there is a lot of discrimination against Black people, only 4% of Faith and Flag Conservatives say this; far more say there is only a little discrimination (40%), or no discrimination at all (14%), against Black people. As a point of comparison, 88% of Progressive Left see a great deal of discrimination against Black people, highest among all typology groups.

Faith and Flag Conservatives are one of three GOP-aligned groups in which significantly larger shares say there is a lot of discrimination against White people than Black people. Ambivalent Right are about as likely to see a lot of discrimination against Black people as White people. Among Democratic-aligned groups – as well as Stressed Sideliners – much larger shares see a lot of discrimination against Black people. Note: For full question wording and distribution on each question, see detailed tables.

Differences within both partisan coalitions in views of immigration

Opinions on immigration – like views on race – are mostly divided along partisan lines, though there also are differences within the coalitions.

Chart shows Faith and Flag Conservatives, Populist Right stand out for highly negative views of immigrants, support for restrictive immigration policies

Among Democratic-aligned groups, majorities say that the nation’s openness to people from all over the world is essential to who we are as a nation and that people who have immigrated illegally generally make their communities better. Yet Democratic Mainstays are more likely than other Democratic groups to say illegal immigration is a very big national problem; a slightly larger share of Democratic Mainstays also say it would bother them to hear a language other than English spoken in their community.

Immigration attitudes are also one of the key areas that distinguish Faith and Flag Conservatives and Populist Right from other Republican groups. Both hold particularly negative views of immigrants and their impacts on the country.

At least eight-in-ten in each group say that illegal immigration is a very big national problem – and sizable shares in both say that the number of legal immigrants admitted to the U.S. should be reduced. Moreover, nearly half of Populist Right (48%) say that White people declining as a share of the U.S. population is bad for society, the highest share of any political typology group. Note: For full question wording and distribution on each question, see detailed tables.

Divisions among GOP-oriented groups on cooperation with U.S. allies

In views of foreign policy, there are illuminating divides among Republican groups, particularly when it comes to U.S. cooperation with key allies. Committed Conservatives stand out for their view that the U.S. should consider its allies’ interests – a view that is more closely aligned with some Democratic groups than with those on the right.

Nearly seven-in-ten Committed Conservatives (68%) say the U.S. should take into account the interests of key allies, even if it means making compromises with them. That is somewhat higher than Ambivalent Right – and much higher than the other two conservative groups in the typology, Faith and Flag Conservatives and Populist Right.

Chart shows Committed Conservatives more likely than other GOP-aligned groups to favor cooperation with U.S. allies

Republican-oriented typology groups also are divided over the Reagan-era approach of “peace through strength.” A sizable majority of Faith and Flag conservatives (75%) say the best way to ensure peace is through military strength, as do at least half of Committed Conservatives and Populist Right. But only about four-in-ten Ambivalent Right agree, with a majority (61%) saying peace is better secured through good diplomacy.

While Democratic groups mostly view diplomacy as the best way to secure peace and favor U.S. cooperation with allies, they differ over the optimal size of the U.S. military. Sizable shares of Progressive Left (65%) and Outsider Left (48%) say that the size of America’s military should be reduced. This compares with just 29% of Establishment Liberals and 12% of Democratic Mainstays. Note: For full question wording and distribution on each question, see detailed tables.

Most Faith and Flag Conservatives say belief in God is essential for morality

Faith and Flag Conservatives are considerably more religious than other typology groups, including other groups on the right. For example, they are only typology group in which a majority say practicing their faith is very important to them personally.

This is reflected in other attitudes of Faith and Flag Conservatives toward religion and whether religion should influence government policy. 

Chart shows Democratic Mainstays stand out from other groups in Democratic coalition on importance of belief in God

A sizable majority (83%) says it is important for a person to believe in God in order to be good and moral; a similar majority also says that cities and towns should be able to display religious symbols in public places. Other Republican-oriented groups stress the importance of religious values, but to a lesser degree.

Faith and Flag Conservatives also place a particular emphasis on traditional family structures: About two-thirds (68%) say society is better off if people make marriage and having children a priority. They also are the only political typology group in which a majority say government policies should support religious values and beliefs.

On the left, Democratic Mainstays stand out from the other left-oriented groups for the importance they place on belief in God: They are the only Democratic group for which a majority (56%) say it is essential or important for a person to believe in God in order to be considered good and moral.

In a very different way, Progressive Left also have distinctive views on religion. Nearly three-quarters (74%) say it is not important at all to believe in God in order to be considered good and moral. And they are more likely than other typology groups to say the decline in the share of Americans belonging to an organized religion is good for society (51%). Note: For full question wording and distribution on each question, see detailed tables.

Deep divides between partisan coalitions on access to voting

In the wake of the contested 2020 election, views on voting access have become deeply partisan issues.

Chart shows Democratic-aligned typology groups far more likely to say voting is a ‘fundamental right’ for all citizens

This is reflected in the opinions of political typology groups: Sizable majorities in all four Democratic-oriented groups view voting as a fundamental right for all citizens that should not be restricted; fewer than half of those in Republican-aligned groups say the same. 
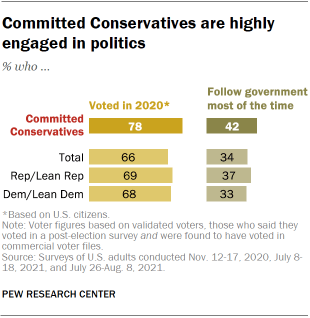
There are comparable differences between the partisan coalitions on whether everything possible should be done to make it easy to vote and in support for such policies as mail voting and automatic voter registration.

However, there is less consensus on changing the current system for electing presidents in the U.S.: A near-unanimous majority of Progressive Left say the country should change the current way the president is elected so that the candidate who receives the most total votes nationwide wins the election. Establishment Liberals, Democratic Mainstays and Outsider Left are more divided. Note: For full question wording and distribution on each question, see detailed tables.

How typology groups view other issues: Abortion, gun policies, marijuana, police funding and the environment

On several other key issues that are prominent in politics, there are meaningful divisions within the Democratic and Republican coalitions – particularly when it comes to abortion, the death penalty and police funding.

Chart shows views on abortion divide GOP-aligned typology groups; Democratic groups are split over police funding, death penalty

On several issues, like climate change and gun policies, there are familiar partisan divides. But other issues break the traditional partisan mold. For example, Ambivalent Right stand against other Republican-oriented groups in their majority view that abortion should be legal in all or most cases, and their view that marijuana should be legal for medical and recreational use. They also are more likely than their Republican counterparts to oppose the death penalty for people convicted of murder and to say that stricter environmental laws and regulations are worth the cost.
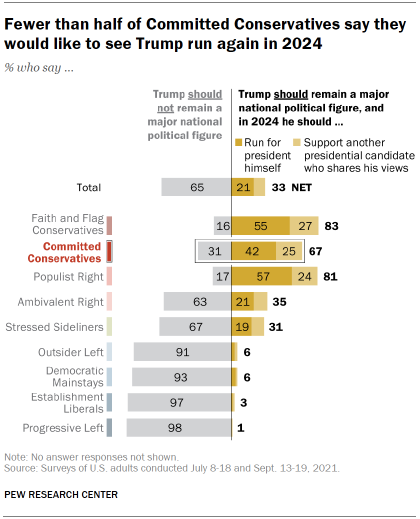
There also are several issues that distinguish Democratic groups from each other. Progressive Left and Outsider Left are both more likely than other Democratic-oriented groups to say they oppose the death penalty and that spending on funding for police departments should be decreased.

Progressive Left are particularly likely to take strong liberal stances on a number of social issues and policies. Near-unanimous majorities in this group say abortion should be legal in all or most cases; that stricter environmental laws and regulations are worth the cost; and that marijuana should be legal for medical and recreational use. Other Democratic groups also generally support these measures, but less consistently than Progressive Left.
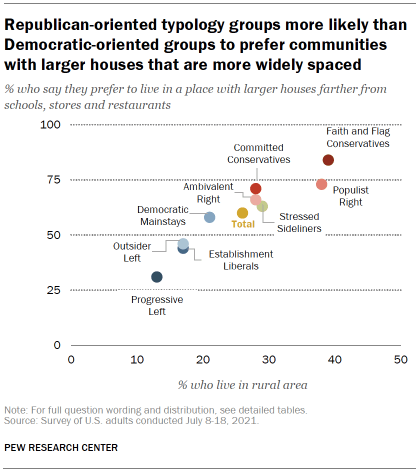
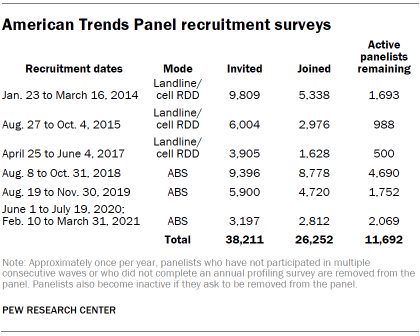
Stressed Sideliners hold a mix of views on many social issues, but on abortion, banning assault style weapons, favoring legal marijuana and making public tuition free at colleges and universities, they are more aligned with Democrats than with Republicans. However, they are less likely to oppose the death penalty than those on the left – and are considerably less likely than these groups to say spending on funding for police departments in their area should be decreased. Note: For full question wording and distribution on each question, see detailed tables.

14. Demographics and lifestyle differences among typology groups

Note: For a new and fully revised version of Pew Research Center’s political typology (published June 2026), read “Beyond Red vs. Blue: The 2026 Political Typology.”

As the United States has grown more demographically diverse, the differences in the racial and ethnic composition of the Republican and Democratic coalitions have widened. These differences are clearly evident in the political typology.

While White adults constitute the majority in all four Republican-oriented groups, they make up a majority in only one of the four Democratic-oriented groups – Progressive Left (68% non-Hispanic White).

Chart shows GOP-oriented groups are largely White; Democratic-oriented groups are far more ethnically diverse

Democratic Mainstays have the largest share of Black adults among the nine typology groups (26%), with the next two largest shares among Establishment Liberals (18%) and Outsider Left (15%). The share of Black adults in each of the remaining groups is around 10%, except for the three most conservative groups: Black adults make up 1% or fewer of Faith and Flag Conservatives, Committed Conservatives and Populist Right.

Hispanics constitute about 20% of three of the four Democratic-oriented groups (all except Progressive Left), as well as 21% of Stressed Sideliners and 17% of Ambivalent Right. Hispanics make up smaller shares (roughly 10% or less) of the three most conservative typology groups. While Asian adults make up about 5% of the public, they constitute larger shares of Establishment Liberals and Outsider Left (10% each).

Wide gaps across political typology groups in age, education and income

Age, education and income vary widely across the political typology groups. The youngest group by far is Outsider Left; fully 83% are under age 50, while 40% are ages 18 to 29. The second youngest group, Progressive Left, also is relatively young; 71% are younger than age 50.

The youngest Republican-oriented group is Ambivalent Right (63% are under age 50). The oldest group is also on the right: Only 32% of Faith and Flag Conservatives are ages 18 to 49, and just 8% in this group are younger than 30.

Chart shows Faith and Flag Conservatives are the oldest group in the political typology; Outsider Left are youngest

Populist Right stands out for having the largest share without a college degree. About eight-in-ten Populist Right (79%) have some college or less education. Among Democratic-oriented groups, Democratic Mainstays have the least formal education (74% have less than a college degree). Stressed Sideliners have an approximately similar share without a college degree (77%).

In addition to lower education levels, Stressed Sideliners (43%) and Democratic Mainstays (36%) are two of the three groups most likely to have lower family incomes. Though they also have lower education levels, only 26% of Populist Right have lower incomes. The two groups with the fewest adults with lower family incomes are Faith and Flag Conservatives and Committed Conservatives (in both, 15% are lower income).

Religious affiliation varies greatly across political typology groups

The share of Americans who identify as Christian has declined in recent years, while the share who describe their religious identity as atheist, agnostic or “nothing in particular” has grown. The decline in Christian identification has been particularly pronounced among Democrats: In 2019, Christians made up about half of Democratic voters (52%); in 2008, about three-quarters of Democrats (73%) were Christians.

While about a quarter of all Americans (28%) claim no religious affiliation, religiously unaffiliated adults make up about half of Progressive Left (52%) and Outsider Left (51%) and a third of Establishment Liberals.

Chart shows about half of Progressive Left and Outsider Left are religiously unaffiliated; Faith and Flag Conservatives have the largest share of White evangelicals

Faith and Flag Conservatives, in contrast, have the highest share of White evangelical Protestants (43%) of any political typology group. Committed Conservatives (28%) and Populist Right (27%) also have a higher share of White evangelical Protestants than other groups. Fewer than 10% in any of the Democratic-oriented groups are White evangelicals, though 20% of Democratic Mainstays are Black Protestants.

Catholics make up fairly similar shares of the political typology groups (between 20% to 25%), except for among Progressive Left and Outsider Left (13% each).

See additional demographic breaks, such as gender and age, in the detailed tables of the report.

Partisan identification and the typology groups

Most of the political typology groups have a clear partisan imprint: At least nine-in-ten Faith and Flag Conservatives (97%), Committed Conservatives (93%) and Populist Right (92%) identify as Republicans or lean toward the Republican Party, as do 68% of Ambivalent Right. Similarly, Progressive Left (98%), Establishment Liberals (93%), Democratic Mainstays (90%) and Outsider Left (84%) overwhelmingly identify as Democrats or Democratic leaners. Only Stressed Sideliners are evenly split between Republicans and Democrats.

Chart shows partisan identification of the political typology groups

Faith and Flag Conservatives have the greatest share of strong Republicans (59%), while strong Republicans make up about half of both Committed Conservatives (47%) and Populist Right (51%). Strong Democrats make up about half of Progressive Left (46%), Establishment Liberals (51%) and Democratic Mainstays (49%). There are relatively few strong partisans among Ambivalent Right, Stressed Sideliners or Outsider Left.

Outsider Left and Ambivalent Right stand out for being less likely to identify with a party. Roughly two-thirds of Outsider Left call themselves political independents (37%) or say they are “something else” other than Republican or Democrat (29%), though most of those who don’t identify with a party lean toward the Democratic Party (Democratic leaners make up 53% of all Outsider Left). Similarly, six-in-ten Ambivalent Right do not claim a partisan identification, though a majority of these (41% of all Ambivalent Right) lean toward the GOP. Most Stressed Sideliners also do not identify with a party, and those who do not are roughly equally split between those who lean to the Democratic Party (26% of all Stressed Sideliners) and those who lean Republican (22% of all Stressed Sideliners).

Majorities in all political typology groups value spending time with family

Despite their many political differences, there are relatively few gaps between the typology groups in what they value most in their personal lives.

The largest share in every group – and 72% of Americans overall – say spending time with family is one of the most important things in their personal lives, from a high of 79% among Faith and Flag Conservatives to a low of 60% among Progressive Left.

Chart shows majorities in all nine political groups say spending time with family is ‘one of the most important things’

There are modest differences in views of the personal importance of other things – with one notable exception. Faith and Flag Conservatives are more likely than other typology groups to say practicing their religious faith is one of the most important things in their personal life (58% say this). Just 12% of Progressive Left say the same, the lowest share of any group.

Progressive Left (27%) also stand out from the other eight groups in the share who say participating in creative arts is one of the most important things in their life. The share saying this is 9 percentage points higher than the next closest group (18% of Outsider Left).

Where people would like to live; where they actually live

The political typology groups are divided over the types of communities where they would like to live – and where they actually live.

Chart shows Republican-oriented typology groups more likely than Democratic-oriented groups to prefer communities with larger houses that are more widely spaced

Overall, Republicans (73%) are more likely than Democrats (49%) to say they prefer communities where the “houses are larger and farther apart, but schools, stores and restaurants are several miles away.”

The groups with the largest shares of rural residents – Faith and Flag Conservatives (39% live in rural areas) and Populist Right (38% rural) – also are among the most likely to stay they prefer living in less-dense communities (84% and 73%, respectively).

Democratic-oriented groups are less likely than the average American to live in a rural area (26% of U.S. adults live in rural areas, compared with 21% or fewer among the Democratic groups). However, their preferences for larger houses vary. More Democratic Mainstays prefer communities with large houses (58%) than more walkable communities (41%), while Outsider Left (46% bigger vs. 54% walkable) and Establishment Liberals (44% vs. 55%) are more divided. Progressive Left are overwhelmingly in favor of more walkable communities (68% prefer this to 31% who want to live in communities with larger houses).

Acknowledgments

This report was made possible by The Pew Charitable Trusts. Pew Research Center is a subsidiary of The Pew Charitable Trusts, its primary funder.

This report is a collaborative effort based on the input and analysis of the following individuals:

Research team

Carroll Doherty, Director, Political Research
Jocelyn Kiley, Associate Director, Political Research
Brad Jones, Senior Researcher
Baxter Oliphant, Senior Researcher
Andrew Daniller, Research Associate
Hannah Hartig, Research Associate
Amina Dunn, Research Analyst
Ted Van Green, Research Analyst
Vianney Gomez, Research Assistant

Methodology

Andrew Mercer, Senior Research Methodologist
Nick Bertoni, Senior Panel Manager
Dorene Asare-Marfo, Research Methodologist
Arnold Lau, Research Methodologist

Communications and editorial

Rachel Weisel, Senior Communications Manager
Nida Asheer, Communications Manager
Calvin Jordan Communications Associate
David Kent, Senior Copy Editor

Graphic design and web publishing

Peter Bell, Design Director
Alissa Scheller, Information Graphics Designer
Reem Nadeem, Assistant Digital Producer

Interactives

Michael Piccorossi Director, Digital Strategy
Stacy Rosenberg, Associate Director, Digital
Seth Rubinstein, Lead Web Developer
Shajia Abidi, Associate Web Developer

We appreciate the contributions of many others at Pew Research Center who gave valuable feedback on this project, including: Claudia Deane, Vice President of Research; Scott Keeter, Senior Survey Advisor; Directors of Research Lee Rainie and Mark Lopez; Associate Directors Juliana Horowitz and Greg Smith; Senior Researcher Besheer Mohamed; and Research Associate Khadijah Edwards.

Appendix A: Survey methodology

The American Trends Panel survey methodology

Overview

The American Trends Panel (ATP), created by Pew Research Center, is a nationally representative panel of randomly selected U.S. adults. Panelists participate via self-administered web surveys. Panelists who do not have internet access at home are provided with a tablet and wireless internet connection. Interviews are conducted in both English and Spanish. The panel is being managed by Ipsos.

Data in this report is drawn from the panel wave conducted July 8 to July 18, 2021, as well as from other interviews from prior and subsequent waves with this same set of respondents (see “Combining multiple waves” for additional details). A total of 10,221 panelists responded out of 11,692 who were sampled, for a response rate of 87%. The cumulative response rate accounting for nonresponse to the recruitment surveys and attrition is 3%. The break-off rate among panelists who logged on to the survey and completed at least one item is 1%. The margin of sampling error for the full sample of 10,221 respondents is plus or minus 1.5 percentage points.

Panel recruitment

The ATP was created in 2014, with the first cohort of panelists invited to join the panel at the end of a large, national, landline and cellphone random-digit-dial survey that was conducted in both English and Spanish. Two additional recruitments were conducted using the same method in 2015 and 2017, respectively. Across these three surveys, a total of 19,718 adults were invited to join the ATP, of whom 9,942 (50%) agreed to participate.

Table shows American Trends Panel recruitment surveys

In August 2018, the ATP switched from telephone to address-based recruitment. Invitations were sent to a random, address-based sample of households selected from the U.S. Postal Service’s Delivery Sequence File. Two additional recruitments were conducted using the same method in 2019 and 2020, respectively. Across these three address-based recruitments, a total of 18,493 adults were invited to join the ATP, of whom 16,310 (88%) agreed to join the panel and completed an initial profile survey. In each household, the adult with the next birthday was asked to go online to complete a survey, at the end of which they were invited to join the panel. Of the 26,252 individuals who have ever joined the ATP, 11,692 remained active panelists and continued to receive survey invitations at the time this survey was conducted.

The Postal Service’s Delivery Sequence File has been estimated to cover as much as 98% of the population, although some studies suggest that the coverage could be in the low 90% range.1 The ATP never uses breakout routers or chains that direct respondents to additional surveys.

Sample design

The overall target population for this survey was non-institutionalized persons ages 18 and older, living in the U.S., including Alaska and Hawaii.

Questionnaire development and testing

The questionnaire was developed by Pew Research Center in consultation with Ipsos. The web program was rigorously tested on both PC and mobile devices by the Ipsos project management team and Pew Research Center researchers. The Ipsos project management team also populated test data which was analyzed in SPSS to ensure the logic and randomizations were working as intended before launching the survey.

Incentives

All respondents were offered a post-paid incentive for their participation. Respondents could choose to receive the post-paid incentive in the form of a check or a gift code to Amazon.com or could choose to decline the incentive. Incentive amounts ranged from $5 to $20 depending on whether the respondent belongs to a part of the population that is harder or easier to reach. Differential incentive amounts were designed to increase panel survey participation among groups that traditionally have low survey response propensities.

Data collection protocol

The data collection field period for the primary survey was July 8 to July 18, 2021. Postcard notifications were mailed to all ATP panelists with a known residential address on July 8. 

Invitations were sent out in two separate launches: Soft Launch and Full Launch. Sixty panelists were included in the soft launch, which began with an initial invitation sent on July 8, 2021. The ATP panelists chosen for the initial soft launch were known responders who had completed previous ATP surveys within one day of receiving their invitation. All remaining English- and Spanish-speaking panelists were included in the full launch and were sent an invitation on July 9.

All panelists with an email address received an email invitation and up to three email reminders if they did not respond to the survey. All ATP panelists that consented to SMS messages received an SMS invitation and up to three SMS reminders.

Table shows invitation and reminder dates

Data quality checks

To ensure high-quality data, the Center’s researchers performed data quality checks to identify any respondents showing clear patterns of satisficing. This includes checking for very high rates of leaving questions blank, as well as always selecting the first or last answer presented. As a result of this checking, three ATP respondents were removed from the survey dataset prior to weighting and analysis.

Weighting

The ATP data was weighted in a multistep process that accounts for multiple stages of sampling and nonresponse that occur at different points in the survey process. First, each panelist begins with a base weight that reflects their probability of selection for their initial recruitment survey (and the probability of being invited to participate in the panel in cases where only a subsample of respondents were invited). The base weights for panelists recruited in different years are scaled to be proportionate to the effective sample size for all active panelists in their cohort. To correct for nonresponse to the initial recruitment surveys and gradual panel attrition, the base weights for all active panelists are calibrated to align with the population benchmarks identified in the accompanying table to create a full-panel weight.

Table shows weighting dimensions

For ATP waves in which only a subsample of panelists are invited to participate, a wave-specific base weight is created by adjusting the full-panel weights for subsampled panelists to account for any differential probabilities of selection for the particular panel wave. For waves in which all active panelists are invited to participate, the wave-specific base weight is identical to the full-panel weight.

In the final weighting step, the wave-specific base weights for panelists who completed the survey are again calibrated to match the population benchmarks specified above. These weights are trimmed (typically at about the 1st and 99th percentiles) to reduce the loss in precision stemming from variance in the weights. Sampling errors and tests of statistical significance take into account the effect of weighting.

Some analysis in this report is based on questions that were asked on other ATP waves. In these instances, data for the respondents who participated in both waves was weighted following the same procedure as for the full sample. For more details, see “Combining multiple waves” section.

Sample sizes and margins of error

The following table shows the unweighted sample sizes and the error attributable to sampling that would be expected at the 95% level of confidence for different groups in the July 8-18, 2021, survey. The error attributable to sampling may be larger than the values shown in the table for analysis involving questions that were asked in other ATP waves.

Table shows sample sizes and margins of error

Sample sizes and sampling errors for other subgroups are available upon request. In addition to sampling error, one should bear in mind that question wording and practical difficulties in conducting surveys can introduce error or bias into the findings of opinion polls.

Dispositions and response rates

Table shows dispositions
Table shows response rates

Appendix B: Typology group creation and analysis

The 2021 political typology divides the public into nine groups. The assignment of individuals to one of the nine groups is based on their responses to 27 questions about social and political values.

The table below lists the items used in the construction of the typology groups. Items included in the typology construction measure a variety of different political values. Many of these values items are similar to those used in past typology studies.

The typology groups are created with a statistical procedure that uses respondents’ scores on all 27 items to sort them into relatively homogeneous groups. The specific statistical technique used to calculate group membership is weighted clustering around medoids (using the WeightedCluster package version 1.4-1 in R version 4.1.1). The items selected for inclusion in the clustering were chosen based on extensive testing to find the model that fit the data best and produced groups that were substantively meaningful. Most prior Pew Research Center typologies used a closely related method, cluster analysis via the k-means algorithm, to identify groups.

Table shows questions used in the 2021 typology

Decisions made at different points in the analysis can have a dramatic impact on the ultimate results of any data partitioning exercise. Different solutions are possible using the same data depending on the algorithm used for partitioning, the ways in which the variables are coded, and even the order in which respondents are sorted. For more details on decisions made during the cluster analysis, see “Behind Pew Research Center’s 2021 Political Typology.”

Missing data imputation

Most of the variables used in the clustering solution were from the W92 ATP survey, but the two party “feeling thermometers” were from the previous wave (W91). There were a small number of respondents (310 in total) who responded to W92 but not W91. There was also a small amount (ranging from 24 cases to 354 cases) of item nonresponse in the measures used. To account for the missingness in the measures, multiple imputation (via the mice package version 3.13.0 in R) using predictive mean matching was used. This resulted in 10 copies of the dataset to account for uncertainty in the imputation. For the clustering algorithm, these 10 imputed datasets were stacked and the algorithm partitioned the stacked dataset. In rare cases where a single respondent was classified into multiple groups because of variation in the multiply imputed data, the assignment from one of the 10 imputed datasets was selected at random. This means that if a respondent with missing data was classified eight times as a Faith and Flag Conservative and twice as a Committed Conservative, they had an 80% chance of being assigned to the Faith and Flag group and a 20% chance of being assigned to the Committed Conservative group.

Coding of input variables

Many data partitioning methods are sensitive to the scaling of the variables. For this project, variables were standardized by subtracting their means and dividing by their standard deviations. This has the effect of equalizing the impact of each variable and putting more weight on responses to each question that are distinctive. In several cases, question sets that were filtered (for example, the GOVSIZE set) were combined into a single ordinal measure that was treated as continuous for the purposes of the partitioning.

Selecting the number of groups

Solutions with different numbers of groups were examined, and the results evaluated for their effectiveness in producing cohesive groups that were sufficiently distinct from one another and large enough in size to be analytically practical and substantively meaningful.

Other methodological decisions

To address the potential sensitivity of cluster analysis to the order in which cases are entered, each model was run several times. The k-medoids algorithm was robust to different initial conditions and consistently returned the same results even with different random starts.

While each model differed somewhat from the others, all of them shared certain key features. The final model selected to produce the political typology was judged to be strong from a statistical point of view, most persuasive from a substantive point of view, and was representative of the general patterns seen across the various models run.

In past political typologies, so-called “Bystanders” (politically disengaged Americans) were identified and excluded from the analysis out the outset. For the 2021 typology, the clustering was performed using only data from registered voters. Less politically engaged Americans tend to have less common patterns of attitudes, and excluding those who are not registered to vote from the clustering had the effect of sharpening the distinctions between the groups. Although they were not used in the modeling, unregistered respondents were assigned to the group to which they were most similar and are included in the analysis.

Adjusting income and defining income tiers

To create upper-, middle- and lower-income tiers, respondents’ 2020 family incomes were adjusted for differences in purchasing power by geographic region and household size. “Middle-income” adults live in families with annual incomes that are two-thirds to double the median family income in the panel (after incomes have been adjusted for the local cost of living and household size). The middle-income range for the American Trends Panel is about $42,000 to $125,900 annually for an average family of three. Lower-income families have incomes less than roughly $42,000, and upper-income families have incomes greater than roughly $125,900 (all figures expressed in 2020 dollars).

Based on these adjustments, 31% of respondents are lower income, 47% are middle income and 17% fall into the upper-income tier. An additional 6% either didn’t offer a response to the income question or the household size question.

For more information about how the income tiers were determined, please see here.

Combining multiple waves

The 2021 Typology is the first time Pew Research Center has conducted its typology analysis on the American Trends Panel. The move to our online panel presents a number of advantages chief among them being the ability to use multiple surveys together for analysis. This report uses responses from 12 separate surveys, as well as records from commercial voter files previously matched to members of the panel (see Survey Methodology for more details about the surveys and their methodologies).

This depth of data is unprecedented for the political typology (and most other Pew Research Center reports). For example, the 2017 typology report was based on two telephone surveys: an initial survey to collect the typology measures, and a “call back” survey that was used for some additional content. The 2021 typology has both one of the largest sample sizes we have had for a political typology (more than 10,000 interviews in 2021) and a much wider selection of data attached to each case in the data than in past years (in theory, anything asked over the seven years of the ATP’s existence could have been used, but because of both methodologically practical reasons and a plethora of data, analysis is restricted to surveys conducted since January 2020). Having access to so much additional data also created some challenges. Beyond just narrowing our attention to what we felt were the key factors to focus on, using data from linked surveys required addressing nonresponse to a given panel wave and the recruitment of new panelists (as well as retirement of some prior panelists).

ATP wave Survey field dates
W59 Jan 6-19, 2020
W78 Nov 12-17, 2020
W80 Jan 8-12, 2021
W84 Mar 1-7, 2021
W85 Mar 8-14, 2021
W87 Apr 5-11, 2021
W89 Apr 20-29, 2021
W91 Jun 14-27, 2021
W92 Jul 8-18, 2021
W93 Jul 26-Aug 8, 2021
W94 Aug 23-29, 2021
W95 Sept 13-19, 2021

“Beyond Red vs. Blue: The Political Typology”

ATP participants are asked to complete surveys every few weeks, but not all participants respond to every survey invitation. Additionally, new panelists are recruited to the panel every year, so when doing any analysis that spans more than one wave of the panel there is inevitably some missing data. For this project, custom cross-wave weights were created to deal with this issue. Each analysis in the report uses data from W92 (where the questions used to construct the typology were asked), and in cases where responses from another wave were needed a weight using the cases that were present in both waves was used.

Media measures

Measures of media use come from ATP W85 as a part of a larger study of media use and perceptions. Respondents were asked to identify the news outlets that they had used in the previous week to get political news. For more on how Pew Research Center measures media consumption see “Measuring News Consumption in a Digital Era.”

Validated voting measures

Voter turnout and vote choice in the 2020 election is based on two different sources. First, self-reports of candidate choice were collected immediately after the general election in November 2020 (ATP W78). Secondly, ATP panelists were matched to commercial voter file databases to verify that they had indeed voted in the election. For more details, see “Behind Biden’s 2020 Victory.”

Measuring partisan identification

In every case where partisanship is discussed in this report, the latest measures of party identification were used. These were collected in late July and early August 2021 (ATP W93). In some cases, this created small conflicts with earlier questions that were filtered on an earlier ask of partisanship. For example, panelists were asked about their Democratic presidential primary preference in January 2020 (ATP W59). These questions were not asked of those who identified with or leaned toward the Republican Party (e.g., they were asked only of those who identified or leaned toward the Democratic Party or expressed no partisan leaning). Partisanship is a very stable identity, but it does change. In the rare cases where respondents have changed their partisan identification between waves and so were not asked a previous question that may have been filtered on a prior measure of partisanship, the analysis of these items was restricted to those who received the question.