Pew Research Center

FOR RELEASE APRIL 15, 2021

Biden Nears 100-Day Mark With Strong Approval, Positive Rating for Vaccine Rollout

Share of Americans viewing illegal immigration as a 'very big' problem grows

FOR MEDIA OR OTHER INQUIRIES:

Communications Department
202.419.4372
www.pewresearch.org

RECOMMENDED CITATION

Pew Research Center, April 2021, "Biden Nears 100-Day Mark With Strong Approval, Positive Rating for Vaccine Rollout"

About Pew Research Center

Pew Research Center is a nonpartisan, nonadvocacy fact tank that informs the public about the issues, attitudes and trends shaping the world. It does not take policy positions. The Center conducts public opinion polling, demographic research, computational social science research and other data-driven research. It studies politics and policy; news habits and media; the internet and technology; religion; race and ethnicity; international affairs; social, demographic and economic trends; science; research methodology and data science; and immigration and migration. Pew Research Center is a subsidiary of The Pew Charitable Trusts, its primary funder.

© Pew Research Center 2026

Table of contents

  • About Pew Research Center
  • Biden Nears 100-Day Mark With Strong Approval, Positive Rating for Vaccine Rollout
  • 1. Views of Biden, the administration and congressional leaders
  • 2. COVID-19 policies: The U.S. economy and the vaccine rollout
  • 3. Americans’ views of the problems facing the nation
  • Acknowledgments
  • Appendix: Defining income tiers
  • Methodology

Biden Nears 100-Day Mark With Strong Approval, Positive Rating for Vaccine Rollout

Share of Americans viewing illegal immigration as a 'very big' problem grows

How we did this

Pew Research Center conducted this study to better understand the public’s views on how the Biden administration has addressed national issues in the first 100 days of its presidency, including evaluations of the coronavirus economic aid package and COVID-19 vaccine distribution. For this analysis, we surveyed 5,109 U.S. adults in April 2021. Everyone who took part in this survey is a member of Pew Research Center’s American Trends Panel (ATP), an online survey panel that is recruited through national, random sampling of residential addresses. This way nearly all U.S. adults have a chance of selection. The survey is weighted to be representative of the U.S. adult population by gender, race, ethnicity, partisan affiliation, education and other categories. Read more about the ATP’s methodology.

Here are the questions used for the report, along with responses, and its methodology.

Joe Biden approaches the 100-day mark of his presidency with a relatively strong job approval rating and the public continuing to express positive views of the coronavirus aid package passed by Congress last month. Moreover, nearly three-quarters of Americans (72%) say the Biden administration has done an excellent or good job managing the manufacture and distribution of COVID-19 vaccines to Americans.
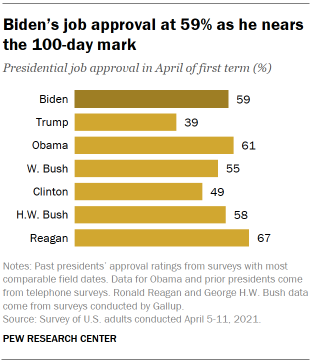
Chart shows Biden’s job approval at 59% as he nears the 100-day mark

Currently, 59% approve of the way Biden is handling his job as president, while 39% disapprove. Biden’s job approval rating has increased modestly from 54% in March. Biden’s job approval is comparable to several of his predecessors – including Barack Obama and George H. W. Bush – and much higher than Donald Trump’s in April 2017.

Views of Biden and his administration highlight several stark contrasts with opinions of his predecessor. Far more Americans say they like the way Biden conducts himself as president (46%) than say they don’t (27%), while another 27% have mixed feelings about his conduct. Similarly, 44% say he has changed the tone of political debate for the better, while 29% say he has made the tone of debate worse (27% say he has not changed it much).

On both questions, there are sizable differences in views of Biden and Trump. Last year, just 15% said they liked the way Trump conducted himself as president, which was little changed from telephone surveys dating to 2017. In both 2020 and 2019, majorities (55% on each occasion) said Trump had changed political debate in the U.S. for the worse.

However, the share of the public saying they agree with Biden on important issues is little different from the share saying that about Trump last year. Fewer than half of Americans (44%) say they agree with Biden on all or nearly all (13%) or on many (31%) of the important issues facing the country; 25% say they agree with Biden on a few issues, while 29% say they agree with him on almost no issues. Last year, 42% of Americans said they agreed with Trump on nearly all (19%) or many issues (23%).

The new national survey by Pew Research Center, conducted on the Center’s nationally representative American Trends Panel from April 5-11, 2021 among 5,109 adults, finds that the administration gets high marks for handling the manufacture and distribution of the COVID-19 vaccines. Note, the survey was conducted prior to the FDA and CDC April 13 recommendation to pause the administration of the Johnson & Johnson vaccine.
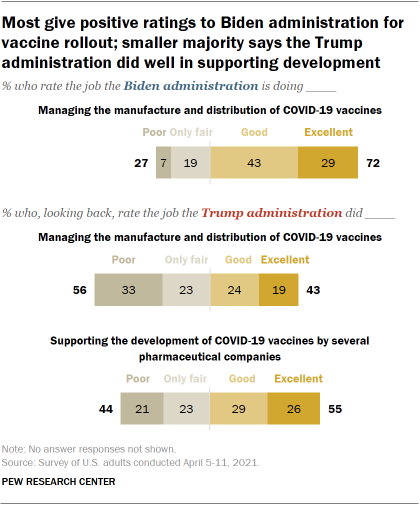
Chart shows most give positive ratings to Biden administration for vaccine rollout; smaller majority says the Trump administration did well in supporting development

While an overwhelming share of Democrats and Democratic-leaning independents (88%) say the administration has done an excellent or good job in managing the vaccine rollout, so too does a much smaller majority (55%) of Republicans and Republican leaners.

The Trump administration receives far lower ratings for how it managed the manufacture and development of COVID-19 vaccines (43% say they did an excellent or good job). However, a 55% majority of the public – including 86% of Republicans and nearly a third (31%) of Democrats – express positive views of the Trump administration’s support for the development of COVID-19 vaccines by several pharmaceutical companies.
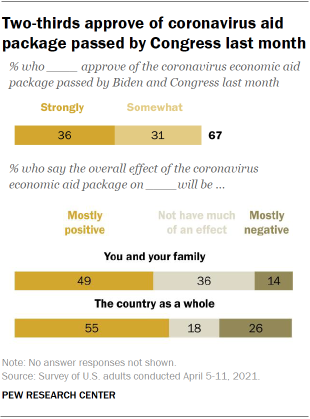
Chart shows two-thirds approve of coronavirus aid package passed by Congress last month

Public support for the coronavirus aid package, which Biden signed into law a little more than a month ago, remains robust. More than twice as many Americans approve (67%) than disapprove (32%) of the $1.9 trillion aid bill. That is little different from the 70% who favored the economic aid package in March, shortly before it was enacted.

More Americans expect the economic aid bill will benefit the country than themselves: 55% say the aid package will have a mostly positive effect on the country as a whole. Fewer than half as many (26%) say it will have a negative effect, while 18% say it will not have much of an effect. About half (49%) expect that the aid bill will have a mostly positive impact on themselves and their families.

While the coronavirus legislation has gotten a positive response from the public, the public has somewhat mixed views of whether Biden’s economic policies are making the economy better when compared with Trump’s. About four-in-ten (43%) say the policies of the Biden administration are making the economy stronger than it was during Trump’s presidency; 36% say his administration’s policies are making the economy weaker, while 20% say they are not making much of a difference.

As is the case with the public’s overall views of the U.S. economy, assessments of how Biden’s policies have affected the economy are deeply divided along partisan lines. About three-quarters of Republicans (76%) say Biden’s policies are making the economy weaker compared with the policies of his predecessor, while nearly an identical share of Democrats (74%) say Biden’s policies are strengthening the economy.

The survey finds that, for the most part, the public’s views of major problems facing the U.S. are little changed from about a year ago. However, the share of Americans saying the coronavirus is a very big problem has declined 11 percentage points since last June (from 58% to 47%), while the share citing illegal immigration has increased 20 points (from 28% to 48%).
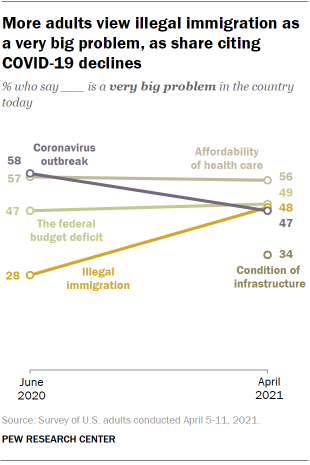
Chart shows more adults view illegal immigration as a very big problem, as share citing COVID-19 declines

While views of most national problems are divided along partisan lines, including illegal immigration, increasing shares of both Republicans and Democrats rate illegal immigration as a very big problem. Nearly three-quarters of Republicans (72%) say illegal immigration is a major problem, up 29 points since last June. The share of Democrats who say this is a major problem is now 29%, compared with 15% nearly a year ago.

Over this period, Republicans and Democrats have moved in opposite directions in concerns about the federal budget deficit. Currently, 71% of Republicans say the budget deficit is a very big problem; about half of Republicans (49%) said this in June 2020. By contrast, just 31% of Democrats rate the deficit as a major problem, down from 45% last year.
1. Views of Biden, the administration and congressional leaders

About six-in-ten Americans say they approve of the way Joe Biden is handling his job as president, while 39% say they disapprove. Biden’s overall approval ratings have ticked up since March, when 54% of the public said they approved of his job performance.

Majorities of most demographic groups approve of Biden’s job performance, with the exception of White Americans, who are roughly as likely to disapprove (51%) of Biden’s performance as to approve (48%). By comparison, nearly nine-in-ten Black Americans (89%) approve of Biden’s performance, as do 74% of Hispanic Americans and 72% of Asian Americans.

Women continue to view Biden’s performance more positively than men (62% vs. 56% approve, respectively), while Biden is seen more positively among college graduates – particularly those with postgraduate degrees – than among those with some college or less education. Adults under 50 are somewhat more approving of Biden’s job performance than those 50 and older.

Only about a quarter of Americans say they don’t like how Biden conducts himself as president

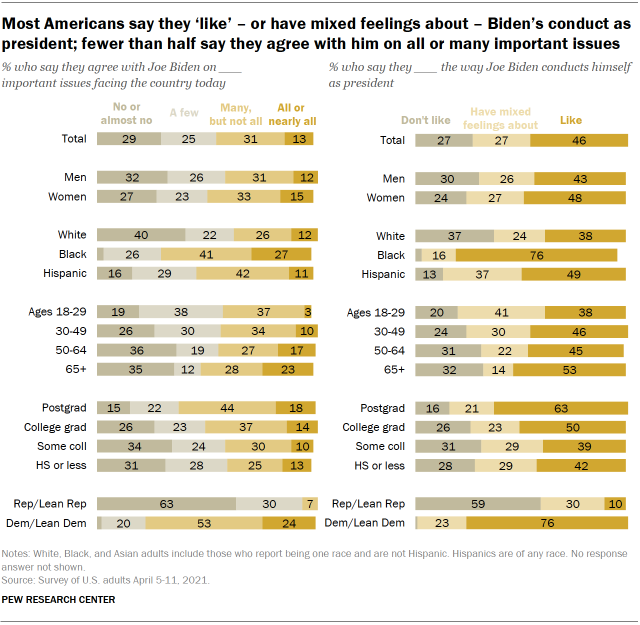
As Biden approaches the 100-day mark of his presidency, relatively few Americans express negative views of the way he conducts himself as president. However, fewer than half say they agree with him on all, nearly all, or many of the important issues facing the country.

Chart shows most Americans say they ‘like’ – or have mixed feelings about – Biden’s conduct as president; fewer than half say they agree with him on all or many important issues

There are wide partisan and demographic differences in views of Biden’s conduct as president and in agreement with him on key issues. About three quarters of Democrats and Democratic-leaning independents (76%) say they like how Biden conducts himself in office, while 23% say they have mixed feelings. A smaller majority of Republicans and Republican leaners (59%) say they do not like Biden’s conduct as president; 30% say they have mixed feelings about his conduct, and 10% say they like how he is conducting himself.

Black adults stand out for their positive views of Biden’s conduct as president: 76% say they like the way Biden is conducting himself as president, compared with 49% of Hispanic adults and 38% of White adults.

There also are sizable educational and age differences in views of Biden’s conduct as president. Adults with at least a four-year college degree are more likely than those with less formal education to say they like Biden’s conduct as president. Older people express more positive – and negative – views of Biden’s conduct than do younger people; younger adults are more likely to say they have mixed feelings.

Just over half of the public says they agree with Biden on few (25%) or none of the important issues facing the country (29%). Another 44% say they agree with Biden on many (31%) or nearly all issues (13%).

Biden draws the greatest agreement on issues from the same groups that have the most positive views of his conduct – Democrats, Black adults and people with at least a four-year college degree.

About eight-in-ten Democrats (77%) say they are in agreement with Biden on all (or nearly all) or many of the major issues facing the country. Still, only about a quarter of Democrats (24%) say they agree with Biden on “all or nearly all issues.”

Republicans are far more uniform in their disagreement with Biden on issues. About six-in-ten Republicans (63%) say they agree with Biden on “no or almost no issues” – more than double the share of Democrats who agree with him on all or virtually all issues. Another 30% of Republicans agree with Biden on a few issues.

Two-thirds of Black adults say they agree with Biden on many or nearly all issues, compared with 53% of Hispanic adults and 37% of White adults.

Adults with more formal education are also more likely to say they agree with Biden on most issues. A majority of adults with at least a college degree say they agree with Biden on most or nearly all issues, compared with 39% of those with some college experience or less education.

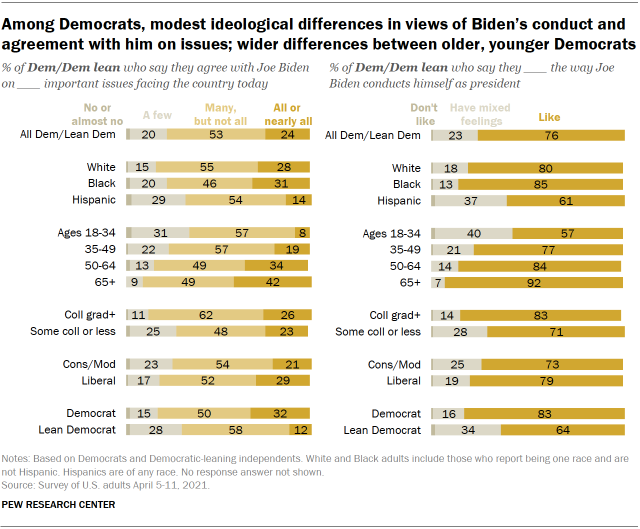
Democrats’ views of Biden’s conduct and agreement with him on major issues

At this point in his presidency, there are only modest ideological differences among Democrats in views of Biden. Large shares of both liberal Democrats (79%) and moderate and conservative Democrats (73%) like the way he conducts himself as president. And sizable majorities of both agree with Biden on all (or nearly all) or many major issues (81% of liberal Democrats, 75% of conservative and moderate Democrats).

Chart shows among Democrats, modest ideological differences in views of Biden’s conduct and agreement with him on issues; wider differences between older, younger Democrats

However, there are demographic differences among Democrats in views of the president. Younger Democrats are less likely to agree with Biden on most or many major issues and to express positive views of his conduct than are older Democrats.

For example, while 91% of Democrats ages 65 and older agree with Biden on all (or nearly all) or many issues, a smaller majority (65%) of those under age 35 say the same.

Older Democrats also are more likely to say they like how Biden conducts himself in office. Fully 92% of those over 65 say they like how Biden conducts himself, compared with smaller shares of adults aged 50 t0 64 (84%), 36 to 49 (77%) and those under age 35 (57%).

Still, most younger Democrats do not express negative views of Biden’s conduct. Rather, 40% of Democrats ages 18-34 say they have mixed views of his conduct, the highest share of any age group.

While Black (85%) and White (81%) Democrats have largely positive views of Biden’s conduct, a narrower majority of Hispanic Democrats (61%) say they like the way he conducts himself as president. Hispanic Democrats are more likely than White and Black Democrats to have mixed views of Biden’s conduct.

And while there are only modest ideological differences in these views, there are wider gaps between partisans and independents who lean toward the Democratic party. Those who identify as members of the Democratic Party are more likely than those who lean toward the party to say they agree with Biden on most or nearly all issues (82% v. 70%) or say they like how he is conducting himself in office (83% vs. 64%).

Biden’s conduct is viewed far more positively than Trump’s was in 2020

Chart shows contrasting views of Biden’s and Trump’s conduct; smaller differences in shares agreeing with each president on issues

Overall, the share of the public who say they agree with Biden on important issues is little different from the share who said they agreed with Trump in February 2020, at the beginning of his fourth year in office. Then, 42% of the public said they agreed with Trump on most or nearly all issues. Today, a similar share (44%) says they agree with Biden on most or nearly all issues.

Just as in 2020, few members of the opposing party say they agree with the president on important issues facing the country. In 2020, 62% of Democrats said they agreed with Trump on no or almost no issues. Similarly, today, about six-in-ten (63%) Republicans say they do not agree with Biden on any issues.

However, while members of the president’s party largely express agreement with him on major issues facing the country, Republicans in 2020 were more likely to say they agreed with Trump on all or nearly all issues (38%), than Democrats (24%) are to say this today.

Overall views of Biden’s conduct in office are more positive than they were for Trump last year: 46% of Americans say they like how Biden conducts himself in office. In February of 2020, just 15% said this of Trump.

About three-quarters of Democrats (76%) say they like how Biden is conducting himself in office. Last year, just 31% of Republicans said they liked Trump’s conduct (half said they had mixed feelings about Trump’s conduct).

And while Democrats were overwhelmingly critical of Trump’s conduct in 2020 (85% said they did not like the way he conducted himself in office), a smaller majority of Republicans (59%) says this of Biden today (30% say they have mixed feelings).

Biden’s impact on the tone of political debate in the U.S.

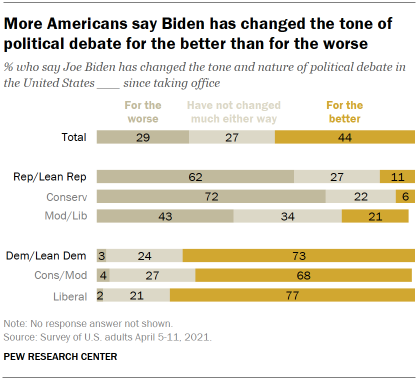
Approaching the 100-day mark of his presidency, 44% of the public says that Biden has changed the tone and nature of political debate in the United States “for the better.” Fewer (29%) say he has changed political discourse for the worse, while 27% say he has not changed the tone of political debate much either way.

About seven-in-ten Democrats (73%) say that Biden has changed the tone and nature of debate for the better. A quarter of Democrats say Biden has not affected the tone of political debate much, while only 3% said he has made it worse.

Views among Republicans are far more negative: About six-in-ten (62%) say that Biden has made political debate worse in the country, while 11% said he has made it better and 27% say he has not changed debate much either way.

Chart shows more Americans say Biden has changed the tone of political debate for the better than for the worse

Views among Republican differ by ideology: About seven-in-ten conservative Republicans (72%) say Biden has changed the tone of debate for the worse, while moderate and liberal Republicans are more divided on this question: 43% say Biden has changed the tone of debate for the worse, 34% say he has not changed debate much, while 21% say he has changed it for the better.

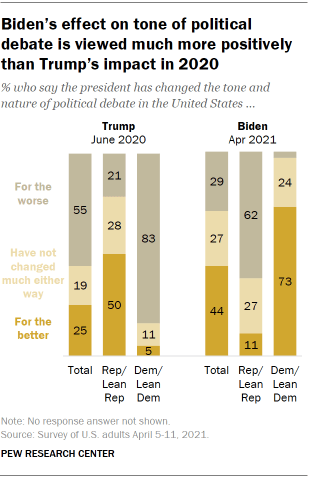
Overall, views of Biden’s impact on the tone and nature are more positive than they were for Trump during the final year of his presidency.

In June 2020, a majority of the public (55%) believed that Trump had changed the tone and nature of political debate in the country for the worse. Just 29% say that about Biden’s impact on debate today.

Chart shows Biden’s effect on tone of political debate is viewed much more positively than Trump’s impact in 2020

While most members of the president’s party express positive views of how their leader has changed political debate in the country, the share of Democrats (73%) who now say that Biden has changed public debate for the better is substantially greater than the share of Republicans (50%) who said Trump had a positive impact on debate last year.

Republicans have more positive views of Biden’s effect on the tone of national political debate than Democrats had of Trump last year. In 2020, about eight-in-ten Democrats (83%) said that Trump made the tone of political debate worse; today, 62% of Republicans say this about Biden.

Public views of ethical standards of the Biden administration

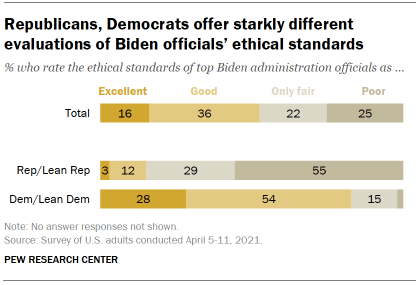
About half of Americans (52%) say top officials in the Biden administration have excellent (16%) or good (36%) ethical standards, while 47% say their ethics are only fair (22%) or poor (25%).

Chart shows Republicans, Democrats offer starkly different evaluations of Biden officials’ ethical standards

Partisans have very different views of the ethical standards of Biden administration officials. About eight-in-ten Democrats and independents who lean toward the Democratic Party (83%) say top Biden administration officials have excellent (28%) or good (54%) ethical standards, while a similar share of Republicans and Republican-leaning independents (85%) say these officials have poor (55%) or fair (29%) standards.

About half of Americans approve of Democratic congressional leaders’ performance, while 32% approve of GOP leaders

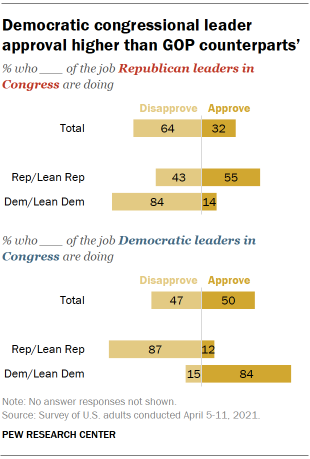
Chart shows Democratic congressional leader approval higher than GOP counterparts’

Half of Americans say they approve of the job Democratic leaders are doing today, while about a third (32%) say the same about Republican congressional leaders. Nearly two-thirds (64%) say they disapprove of the job Republicans have done in Congress, while 47% say that about Democratic leaders.

Democrats are more approving of their party’s leaders in Congress than Republicans are of theirs. Fully 84% of Democrats and Democratic-leaning independents say they approve of the job their party’s leaders are doing in Congress; 55% of Republicans and Republican leaners say the same about GOP leaders.

The share of the public saying they approve of the job Democratic congressional leaders are doing is nine percentage points higher now than in the spring 2019, when 41% of the public said they approved. This increase is largely driven by higher approval ratings among Democrats (84% approve now vs. 69% then).

2. COVID-19 policies: The U.S. economy and the vaccine rollout

Since Biden took office in January, he and his administration have received positive marks for their handling of the coronavirus. In the current survey, 72% of Americans say the Biden administration has done an excellent or good job in managing the manufacture and distribution of COVID-19 vaccines.

Chart shows Biden administration gets positive marks for vaccine rollout, including from a majority of Republicans

Last month, 65% of the public expressed confidence in Biden to handle the public health impact of the coronavirus outbreak, his highest rating among seven issues included on the survey.

While a sizable majority says the Biden administration has done well in managing the manufacture and distribution of vaccines, far fewer (43%) give the Trump administration positive ratings for how it handled this while in office.

However, the Trump administration receives more positive ratings for its support of the development of the COVID-19 vaccines by pharmaceutical companies, with over half of Americans (55%) saying the Trump administration did an excellent or good job.

Opinions about how the Biden and Trump administrations have handled the vaccine rollout differ by party. Nearly nine-in-ten Democrats (88%) give positive marks for the job the Biden administration is doing; 46% say it has done an excellent job, while 42% say it has done a good job. Republicans offer less positive evaluations; still, a 55% majority says the Biden administration has done an excellent or good job in managing the manufacture and distribution of the vaccine.

In their retrospective views of the Trump administration’s handling of the vaccines, both Republicans and Democrats offer more positive evaluations for how the administration supported the development of vaccines than for how it managed their manufacture and distribution.

Large majorities of Republicans (86% and 83%, respectively) give the Trump administration positive ratings for both supporting the vaccine development and managing its distribution. Yet while a majority of Republicans (54%) say the Trump administration did an excellent job supporting vaccine development, fewer (41%) say it did an excellent job managing the manufacture and distribution of vaccines.

Nearly a third of Democrats (31%) say the Trump administration did an excellent or good job in supporting the development of vaccines by pharmaceutical companies. Just 12% of Democrats say the same about the administration’s management of the vaccine rollout.

Broad public support for coronavirus aid package

Americans approve of the $2 trillion coronavirus economic aid package by a margin of about two-to-one. Two-thirds of the public (67%) approve of the bill, with 36% saying they strongly approve. About one-in-three (32%) of Americans disapprove of the bill (17% strongly).

Chart shows two-thirds of Americans approve of the coronavirus economic aid package

The legislation draws overwhelming support from Democrats and Democratic-leaning independents (93% favor). A smaller majority of Republicans and Republican leaners (65%) oppose the coronavirus aid package. Roughly a third of Republicans (35%) favor the aid package, which received no support from congressional Republicans.

Overall, the demographic divides in support for the aid package are modest and track with the partisan leanings of each group: Women are somewhat more likely than men to say they approve of the bill. Among racial and ethnic groups, White Americans support the bill at lower rates than Black, Hispanic and Asian adults. And young people are more likely to approve of the aid package than older people.

Lower income Republicans view the aid package much more positively than do Republicans with higher incomes. A majority of lower income Republicans and Republican leaners (55%) approve of the bill, compared with just 18% of those with the highest family incomes.

Chart shows lower-income Republicans far more likely than those with higher incomes to approve of coronavirus aid bill and say it will benefit them

Similarly, lower income Republicans are much more likely than other Republicans to say the bill will have a positive impact on their family (43%) and the country as a whole (42%) than those Republicans with the highest incomes (12% and 16% respectively).

Lower income Democrats are somewhat less likely than those with higher incomes to say that the bill will have  a positive impact on their families or the country as a whole – though the income divides on the Democratic side are less pronounced than those among Republicans.

Most Americans say they understand how the coronavirus aid package may affect them

Chart shows most Americans say they understand the aid package at least somewhat well

A majority of Americans (79%) say feel like they understand how the coronavirus aid package will affect them very or somewhat well, while three-in-ten say they understand its effects very well.

Unlike Americans’ approval of the bill, their reported understanding of the bill is not marked by large partisan divisions. About three-quarters (74%) of Republicans and Republican leaners say they understand the bill at least somewhat well. A slightly larger share of Democrats and Democratic-leaning independents say the same (84%).

Public split over how Biden’s economic policies compare with Trump’s

Chart shows partisans are divided over the impact of Biden’s policies on U.S. economy

Three months into the new administration, 43% of Americans say that, compared with the Trump administration, the Biden administration’s policies are making the country’s economy stronger, while 36% say Biden’s policies are making the economy weaker and 20% say they are not making much of a difference.

About three-quarters of Republicans (76%) say Biden’s policies are making the country’s economy weaker than the policies of his predecessor. In contrast, about the same share of Democrats (74%) say the new administration’s policies are making the economy stronger when compared with the policies of the previous administration. About two-in-ten in both parties say Biden’s policies aren’t having much of a different effect on the economy than Trump’s did (17% of Republicans and 21% of Democrats say this).

3. Americans’ views of the problems facing the nation

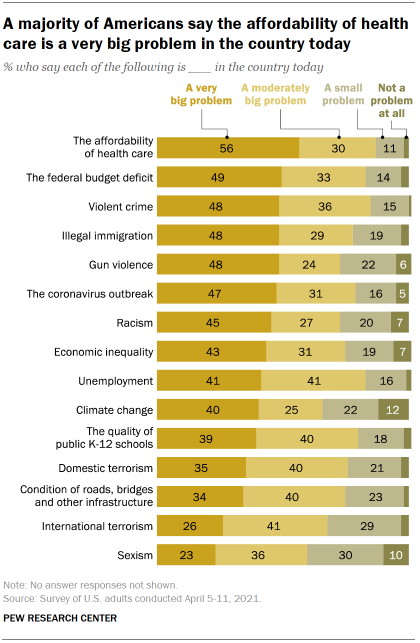
The affordability of health care is high on the public’s list of the biggest problems in the country today, with 56% of adults describing this as “a very big problem” and an additional 30% rating it “a moderately big problem.”

Chart shows a majority of Americans say the affordability of health care is a very big problem in the country today

Health care costs is the only issue of the 15 asked on the survey seen as a very big problem by a majority of Americans, though about half say that the federal budget deficit (49%), violent crime (48%), illegal immigration (48%) and gun violence (48%) are very big problems. A similar share (47%) name the coronavirus outbreak as a very big problem – though that is down significantly from last summer, when nearly six-in-ten (58%) said this.

All of the 15 problems in the survey are seen as at least moderately big problems by a majority of the public. However, Americans differ over the severity of these problems.

For example, nearly a quarter of adults (23%) say sexism is a very big problem – the lowest share of any issue asked about –while 36% view sexism as a moderately big problem. Just one-in-ten say that sexism is not a problem at all, while 30% say it is a small problem.

As the Biden administration makes the case for massive new investment in the nation’s infrastructure, the condition of roads, bridges and other infrastructure ranks relatively low on the list of major problems facing the country. About a third of adults (34%) say the condition of infrastructure is a very big problem, four-in-ten say it is a moderately big problem, and a quarter say it is either a small problem (23%) or not a problem (2%).

Though neither domestic nor international terrorism ranks among the public’s top problems, roughly a third of Americans (35%) say domestic terrorism is a very big problem in the country today, while a smaller share (26%) says the same about international terrorism.

Republicans and Democrats far apart on biggest problems facing the country

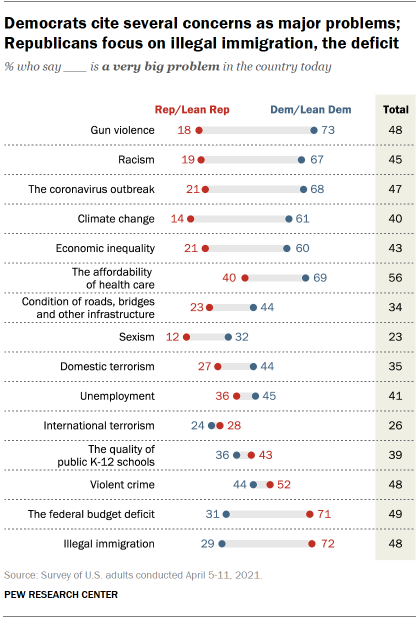
Gun violence, the affordability of health care, the coronavirus outbreak and racism are each seen as very big problems facing the country today by two-thirds or more Democrats and Democratic leaners.

Chart shows Democrats cite several concerns as major problems; Republicans focus on illegal immigration, the deficit

By contrast, far fewer Republicans say these are major problems in the country. Four-in-ten say health care affordability is a very big problem, and only about two-in-ten rate the coronavirus and gun violence as very big problems.

The extent to which climate change and economic inequality are viewed as very big problems is similarly split along partisan lines. About six-in-ten Democrats say each of these are very big problems, while just 21% of Republicans say economic inequality is a very big problem and even fewer (14%) say this about climate change.

By contrast, illegal immigration and the federal budget deficit are the top problems identified by Republicans. About seven-in-ten say both of these are very big problems for the country. Only about three-in-ten Democrats identify these issues as very big problems.

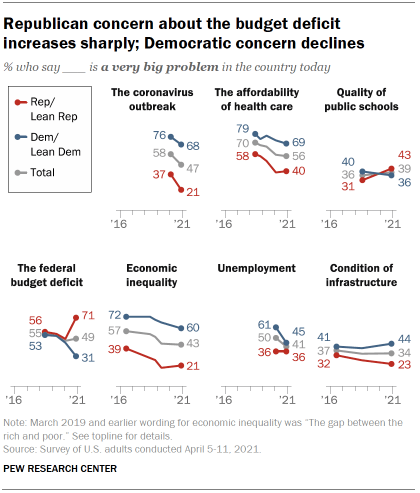
Chart shows Republican concern about the budget deficit increases sharply; Democratic concern declines

Since last summer, Republicans and Democrats have diverged sharply in their views of whether the federal budget deficit represents a very big problem. Today, 71% of Republicans say the federal budget deficit is a very big problem – 22 percentage points higher than the share saying this in June 2020. By comparison, about three-in-ten Democrats (31%) now say the deficit is a very big problem – 14 points lower than the share saying this last summer.

As a result, Republicans are now 40 percentage points more likely than Democrats to say the deficit is a very big problem, a stark contrast to the lack of a substantial partisan gap in these views 10 months ago.

The shares of both Republicans and Democrats who say the coronavirus outbreak is a very big problem have decreased since June, though this decline has been steeper among Republicans (a 16 percentage point change) than among Democrats (8 points).

The share of the public viewing unemployment as a very big problem for the country has declined since last June from 50% to 41% (when national unemployment was substantially higher than it is today). The share of Democrats who say unemployment is a very big problem has fallen from 61% to 45% over this period, while the share of Republicans saying this is unchanged (36% then and now).

Since 2018, the share of Democrats who say the affordability of health care is a very big problem has decreased by 10 percentage points, while the share of Republicans who say this has decreased by 18 points. The shares who say economic inequality is a very big problem have also decreased among members of both parties in recent years.

A similar share of Democrats say that the condition of infrastructure is a very big problem (44%) as said this in 2016 (41%). Republicans have become somewhat less likely to describe the condition of infrastructure as a very big problem (23% in 2021 vs. 32% in 2016).

Acknowledgments

This report is a collaborative effort based on the input and analysis of the following individuals:

Research team

Carroll Doherty, Director, Political Research
Jocelyn Kiley, Associate Director, Political Research
Baxter Oliphant, Senior Researcher
Andrew Daniller, Research Associate
Bradley Jones, Research Associate
Hannah Hartig, Research Associate
Amina Dunn, Research Analyst
Ted Van Green, Research Assistant
Vianney Gomez, Research Assistant

Communications and editorial

Nida Asheer, Communications Manager
Calvin Jordan, Communications Associate
Travis Mitchell, Copy Editor

Graphic design and web publishing

Alissa Scheller, Information Graphics Designer
Reem Nadeem, Associate Digital Producer

Methodology

Andrew Mercer, Senior Research Methodologist
Nick Bertoni, Senior Panel Manager
Dorene Asare-Marfo, Research Methodologist
Arnold Lau, Research Analyst

Appendix: Defining income tiers

To create upper-, middle- and lower-income tiers, respondents’ 2019 family incomes were adjusted for differences in purchasing power by geographic region and for household size. “Middle-income” adults live in families with annual incomes that are two-thirds to double the median family income in the panel (after incomes have been adjusted for the local cost of living and for household size). The middle-income range for the American Trends Panel is about $38,900 to $116,800 annually for an average family of three. Lower-income families have incomes less than roughly $38,900, and upper-income families have incomes greater than roughly $116,800 (all figures expressed in 2019 dollars).

Based on these adjustments, 32% are lower income, 45% are middle income and 19% fall into the upper-income tier. An additional 4% either didn’t offer a response to the income question or the household size question.

For more information about how the income tiers were determined, please see here.

Methodology

Overview

The American Trends Panel (ATP), created by Pew Research Center, is a nationally representative panel of randomly selected U.S. adults. Panelists participate via self-administered web surveys. Panelists who do not have internet access at home are provided with a tablet and wireless internet connection. Interviews are conducted in both English and Spanish. The panel is being managed by Ipsos.

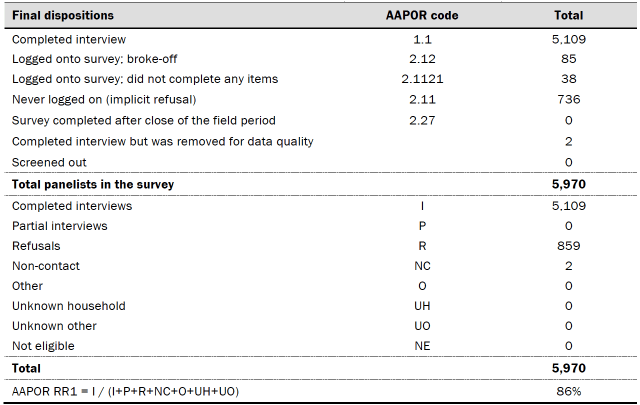
Data in this report is drawn from the panel wave conducted April 5 to April 11, 2021. A total of 5,109 panelists responded out of 5,970 who were sampled, for a response rate of 86%. This does not include two panelists who were removed from the data due to extremely high rates of refusal or straightlining. The cumulative response rate accounting for nonresponse to the recruitment surveys and attrition is 4%. The break-off rate among panelists who logged on to the survey and completed at least one item is 2%. The margin of sampling error for the full sample of 5,109 respondents is plus or minus 2.1 percentage points.

Panel recruitment

The ATP was created in 2014, with the first cohort of panelists invited to join the panel at the end of a large, national, landline and cellphone random-digit-dial survey that was conducted in both English and Spanish. Two additional recruitments were conducted using the same method in 2015 and 2017, respectively. Across these three surveys, a total of 19,718 adults were invited to join the ATP, of whom 9,942 (50%) agreed to participate.

Table shows American Trends Panel recruitment surveys

In August 2018, the ATP switched from telephone to address-based recruitment. Invitations were sent to a random, address-based sample of households selected from the U.S. Postal Service’s Delivery Sequence File. Two additional recruitments were conducted using the same method in 2019 and 2020, respectively. Across these three address-based recruitments, a total of 17,161 adults were invited to join the ATP, of whom 15,134 (88%) agreed to join the panel and completed an initial profile survey. In each household, the adult with the next birthday was asked to go online to complete a survey, at the end of which they were invited to join the panel. Of the 25,076 individuals who have ever joined the ATP, 13,537 remained active panelists and continued to receive survey invitations at the time this survey was conducted.

The U.S. Postal Service’s Delivery Sequence File has been estimated to cover as much as 98% of the population, although some studies suggest that the coverage could be in the low 90% range.1 The American Trends Panel never uses breakout routers or chains that direct respondents to additional surveys.

Sample design

The overall target population for this survey was non-institutionalized persons ages 18 and older, living in the U.S., including Alaska and Hawaii.

This study featured a stratified random sample from the ATP. The sample was allocated according to the following strata, in order: Asian Americans (including those who identify as Asian in combination with another race), Black Americans (including those who identify as Black in combination with another race), U.S.-born Hispanics, foreign-born Hispanics, tablet households, high school education or less, not registered to vote, people ages 18 to 34, uses internet weekly or less, nonvolunteers, and all other categories not already falling into any of the above.

Questionnaire development and testing

The questionnaire was developed by Pew Research Center in consultation with Ipsos. The web program was rigorously tested on both PC and mobile devices by the Ipsos project management team and Pew Research Center researchers. The Ipsos project management team also populated test data which was analyzed in SPSS to ensure the logic and randomizations were working as intended before launching the survey.

Incentives

All respondents were offered a post-paid incentive for their participation. Respondents could choose to receive the post-paid incentive in the form of a check or a gift code to Amazon.com or could choose to decline the incentive. Incentive amounts ranged from $5 to $20 depending on whether the respondent belongs to a part of the population that is harder or easier to reach. Differential incentive amounts were designed to increase panel survey participation among groups that traditionally have low survey response propensities.

Data collection protocol

The data collection field period for this survey was April 5 to April 11, 2021. Postcard notifications were mailed to all ATP panelists with a known residential address on April 5, 2021. 

Table shows invitation and reminder dates

On April 5 and April 6, invitations were sent out in two separate launches: Soft launch and Full launch. Sixty panelists were included in the soft launch, which began with an initial invitation sent on April 5, 2021. The ATP panelists chosen for the initial soft launch were known responders who had completed previous ATP surveys within one day of receiving their invitation. All remaining English- and Spanish-speaking panelists were included in the full launch and were sent an invitation on April 6, 2021.

All panelists with an email address received an email invitation and up to two email reminders if they did not respond to the survey. All ATP panelists that consented to SMS messages received an SMS invitation and up to two SMS reminders.

Data quality checks

To ensure high-quality data, the Center’s researchers performed data quality checks to identify any respondents showing clear patterns of satisficing. This includes checking for very high rates of leaving questions blank as well as always selecting the first or last answer presented. As a result of this checking, two ATP respondents were removed from the survey dataset prior to weighting and analysis.

Weighting

Table shows weighting dimensions

The ATP data was weighted in a multistep process that accounts for multiple stages of sampling and nonresponse that occur at different points in the survey process. First, each panelist begins with a base weight that reflects their probability of selection for their initial recruitment survey (and the probability of being invited to participate in the panel in cases where only a subsample of respondents were invited). The base weights for panelists recruited in different years are scaled to be proportionate to the effective sample size for all active panelists in their cohort. To correct for nonresponse to the initial recruitment surveys and gradual panel attrition, the base weights for all active panelists are calibrated to align with the population benchmarks identified in the accompanying table to create a full-panel weight.

For ATP waves in which only a subsample of panelists are invited to participate, a wave-specific base weight is created by adjusting the full-panel weights for subsampled panelists to account for any differential probabilities of selection for the particular panel wave. For waves in which all active panelists are invited to participate, the wave-specific base weight is identical to the full-panel weight.

In the final weighting step, the wave-specific base weights for panelists who completed the survey are again calibrated to match the population benchmarks specified above. These weights are trimmed (typically at about the 1st and 99th percentiles) to reduce the loss in precision stemming from variance in the weights. Sampling errors and test of statistical significance take into account the effect of weighting.

The following table shows the unweighted sample sizes and the error attributable to sampling that would be expected at the 95% level of confidence for different groups in the survey.

Table shows unweighted sample sizes and the error attributable

Sample sizes and sampling errors for other subgroups are available upon request. In addition to sampling error, one should bear in mind that question wording and practical difficulties in conducting surveys can introduce error or bias into the findings of opinion polls.

Dispositions and response rates

Table shows dispositions
Table shows response rates

Note: This methodology statement was updated April 20, 2021 to include additional detail on the sampling design, specifically on the oversampling of Asian, Black, and Hispanic adults in this survey.