Sharp Divisions on Vote Counts, as Biden Gets High Marks for His Post-Election Conduct
Large majority of Americans say additional COVID-19 aid is needed – and want Congress to pass it as soon as possible
About Pew Research Center
Pew Research Center is a nonpartisan, nonadvocacy fact tank that informs the public about the issues, attitudes and trends shaping the world. It does not take policy positions. The Center conducts public opinion polling, demographic research, computational social science research and other data-driven research. It studies politics and policy; news habits and media; the internet and technology; religion; race and ethnicity; international affairs; social, demographic and economic trends; science; research methodology and data science; and immigration and migration. Pew Research Center is a subsidiary of The Pew Charitable Trusts, its primary funder.
Sharp Divisions on Vote Counts, as Biden Gets High Marks for His Post-Election Conduct
Large majority of Americans say additional COVID-19 aid is needed – and want Congress to pass it as soon as possible
How we did this
Pew Research Center conducted this study to understand how Americans view the 2020 presidential election and the voting process. For this analysis, we surveyed 11,818 U.S. adults in November 2020, including 10,399 U.S. citizens who reported having voted in the November election.
Everyone who took part in this survey is a member of Pew Research Center’s American Trends Panel (ATP), an online survey panel that is recruited through national, random sampling of residential addresses. This way nearly all U.S. adults have a chance of selection. The survey is weighted to be representative of the U.S. adult population by gender, race, ethnicity, partisan affiliation, education and other categories. Read more about the ATP’s methodology.
More than two weeks after the presidential election, there are sharp divisions between voters who supported Joe Biden and Donald Trump over nearly all aspects of the election and voting process, including whether their own votes were counted accurately.
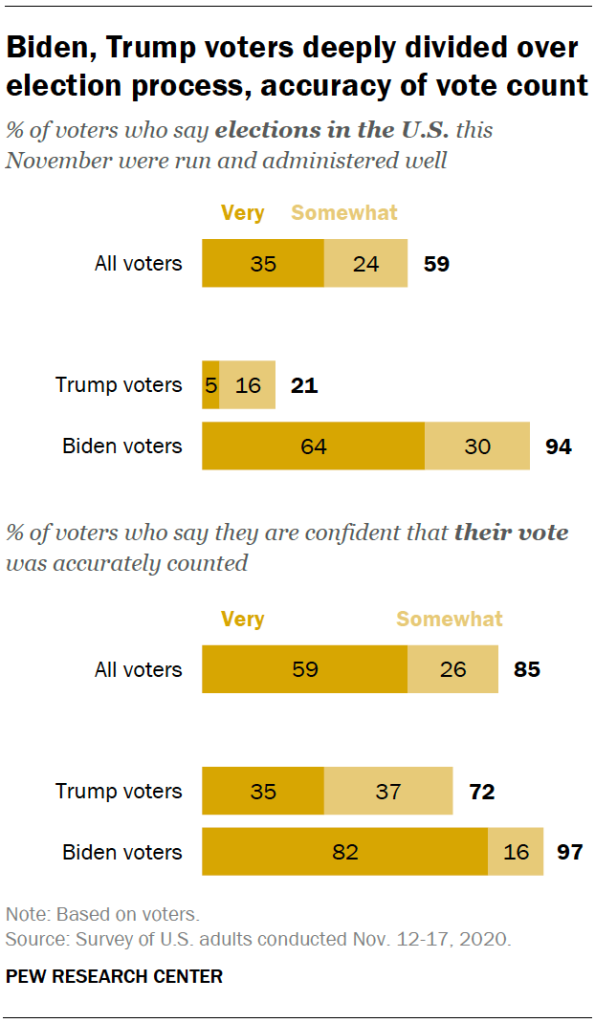
Trump voters, who already were skeptical of the electoral process and prospects for an accurate vote count before the election in October, have become much more so since Biden’s victory. While a 59% majority of all voters say elections in the United States were run and administered well, just 21% of Trump supporters have a positive view of how elections were administered nationally. Among Biden supporters, 94% say the elections were run and administered well.
Disagreements between supporters of the winning and losing candidates over the accuracy of presidential vote counts are not unusual, but the magnitude of the differences between Trump and Biden voters is striking. While 82% of Biden supporters are very confident their own vote was counted accurately, just 35% of Trump supporters say the same.
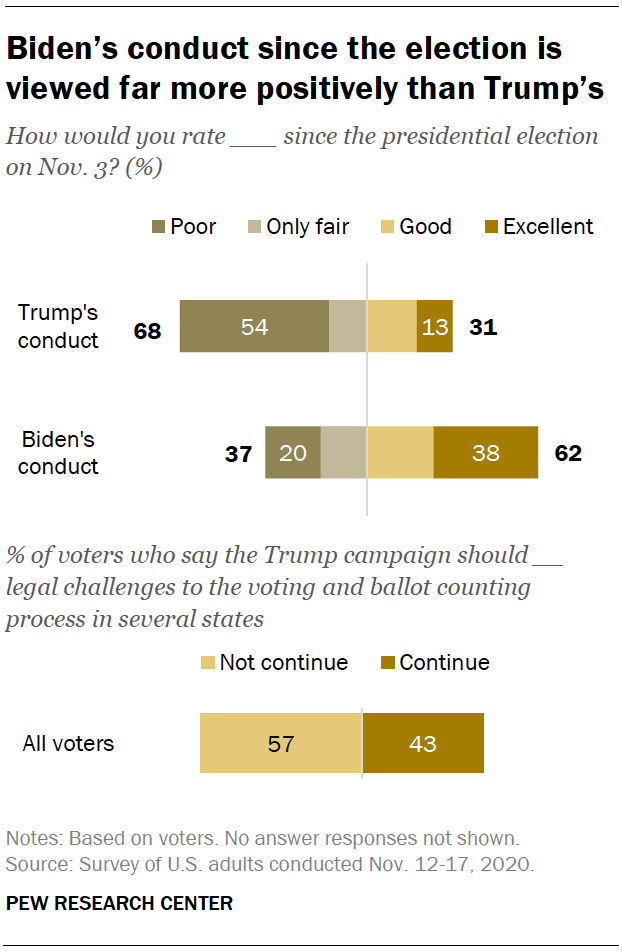
The weeks since Biden’s victory have been marked by the Trump campaign’s frantic and thus far unsuccessful attempts to challenge the election results in several states. Voters express much more positive views of Biden’s conduct since the election than Trump’s – and 57% say the Trump campaign’s legal challenges to the voting and ballot counting process should end.
A majority of voters (62%) say Biden’s post-election conduct has been excellent or good, while just half as many (31%) give Trump positive ratings for his conduct since the election. About seven-in-ten (68%) view Trump’s conduct as only fair or poor, with a 54% majority rating it poor.
Both Biden and Trump, unsurprisingly, get largely positive ratings from their own supporters. However, about a third of Trump voters (34%) rate his conduct since the election as only fair or poor, compared with just 4% of Biden voters who give the former vice president low marks.
Still, while a majority of all voters say the Trump campaign should halt efforts to challenge the election, Trump voters are overwhelmingly supportive of these challenges: 85% say they should continue. Biden voters overwhelmingly say they should end (96% express this view).
As disputes over the election continue, the nation has been struggling with a record surge in coronavirus cases. And, as with views of the election process, Biden and Trump supporters are far apart on how to address the COVID-19 surge. Most Biden voters (66%) favor tighter restrictions on public activity in their communities. But just 16% of Trump voters say the same; more than twice as many (44%) say there should be fewer restrictions, while 40% say they should remain about the same as they are currently.
The new survey by Pew Research Center, conducted Nov. 12-17 on the nationally representative American Trends Panel among 11,818 U.S. adults, including 10,399 who say they voted in the presidential election, finds far greater agreement about the need for additional governmental assistance in response to the coronavirus outbreak.
A large majority of Americans (80%) say it is necessary for the president and Congress to pass more coronavirus aid, on top of the $2 trillion package enacted in March.
And an overwhelming majority of those who view more assistance as necessary think Congress and the president should act on it as soon as possible, rather than waiting until after the presidential inauguration in January. About two-thirds of Americans (68%) say a new aid package is necessary and that it be acted upon by the president and current Congress.
Other key findings:
Biden continues to engender more confidence on coronavirus. The survey finds only modest changes in confidence in Biden and Trump on key issues since the election. As was the case before the election, Biden draws far more public confidence than Trump to handle the public health impact of the coronavirus; 58% are very or somewhat confident in Biden, compared with 39% who express confidence in Trump. Comparable shares of Americans have confidence in Biden (52%) and Trump (53%) to make good decisions about economic policy.
Partisans diverge in views of future trajectory of nation’s economy. Views of the economy, which have been highly partisan for many years, have begun to shift following the election. While Republicans remain more positive than Democrats about current economic conditions, Democrats have become much more bullish in their views about the economy over the next year. Six-in-ten Democrats and Democratic-leaning independents say economic conditions will be better a year from now, compared with just 23% of Republicans and Republicans leaners. Last month, Republicans were far more likely than Democrats to say the economy would improve over the next year (65% of Republicans, 42% of Democrats).
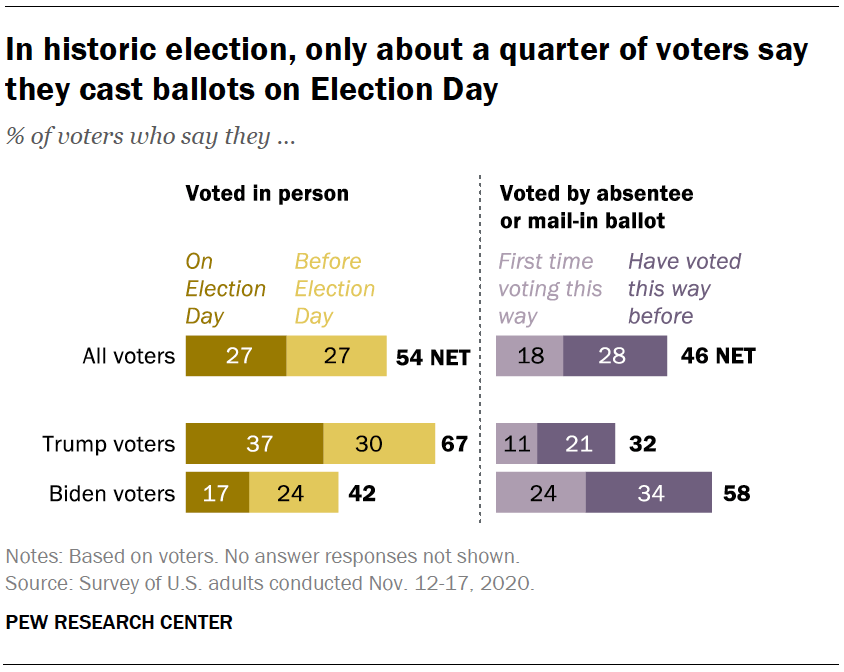
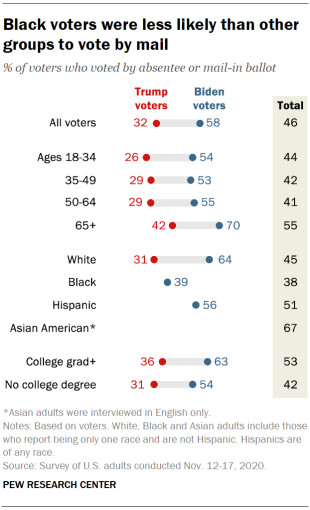
Nearly half of voters say they voted by mail or absentee. Largely because of concerns over the pandemic, mail and absentee voting increased dramatically in 2020. Nearly half of voters (46%) say they voted by absentee or mail – including 18% who report casting ballots by mail for the first time. A 54% majority say they voted in person, with equal shares voting on Election Day or before the election.
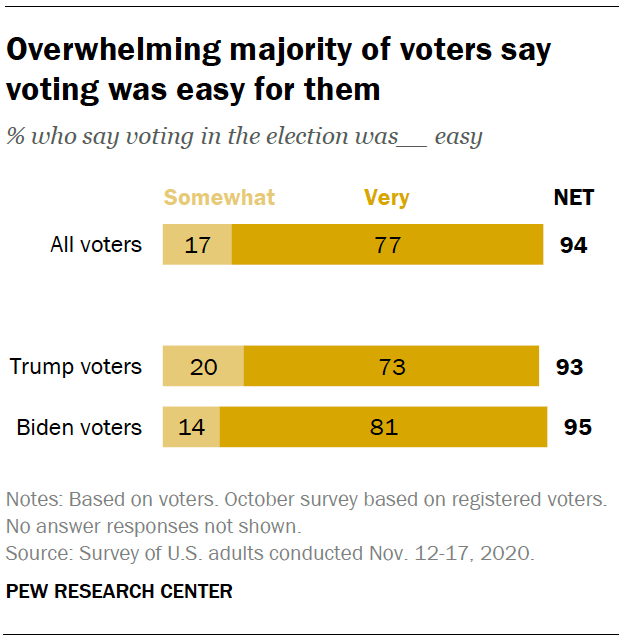
For most voters, casting ballots was “very easy.” Despite the dramatic changes in how Americans voted this year, a sizable majority (77%) say voting in the election was very easy. These views differ only modestly among those who voted by mail or absentee, and in person before Election Day or on Election Day itself. And while Trump and Biden supporters have substantial disagreements over the accuracy of the vote count and how the elections were administered, 81% of Biden voters and 73% of Trump supporters found it very easy to vote.
1. Biden, Trump and the post-election period
As states continue to certify vote results from the 2020 election in the coming weeks, Trump receives highly negative ratings for his conduct since the Nov. 3 election. Nearly seven-in-ten voters (68%) say Trump’s conduct has been only fair or poor, including a majority of voters who say it has been poor (54%).
In contrast, Biden gets positive marks for his conduct since the 2020 presidential election. Overall, 62% of voters say it has been good or excellent, while 37% say it has been only fair or poor. Nearly three times as many voters say Biden’s conduct has been excellent as say this about Trump’s (38% vs. 13%, respectively).
The overwhelming majority of Biden voters (96%) rate Biden’s post-election conduct as excellent or good, as do a quarter of Trump voters.
As the Trump campaign continues to mount legal challenges to the vote and ballot counting process in several states, 57% of voters say that these legal challenges should not continue. A smaller share (43%) says the Trump campaign should continue the legal challenges.
Biden’s supporters are remarkably united in their views of Trump’s post-election conduct and whether his presidential campaign should continue legal challenges to the vote and ballot counting process. Virtually all Biden voters (99%) say Trump’s conduct since the election has been fair or poor, with 94% rating it as poor.
Similarly, 96% of Biden voters say the Trump campaign’s legal challenges to the vote counting process should not continue.
Nearly two-thirds of Trump voters (65%) view his post-election conduct positively, while 34% say it has been only fair or poor.
Trump’s ratings are much more positive among those who said they supported him strongly in Pew Research Center’s October survey. At that time, a 68% majority of registered voters backed him strongly, while 32% supported him moderately or leaned toward voting for him.
Those who supported Trump strongly last month are more than twice as likely as those who backed him less strongly to endorse his post-election conduct; 79% of Trump’s strong supporters say it has been excellent or good, compared with just 35% of the smaller subset of his supporters who backed him less strongly.
However, sizable majorities of Trump voters – those who supported him strongly and not as strongly – say his campaign’s legal challenges should continue. An overwhelming share of strong Trump supporters (94%) say this, as do a smaller majority of voters (71%) who backed Trump less strongly.
Among Trump voters, opposition to Trump’s continued legal challenges is largely limited to those who rate his post-election conduct as poor. Among the 10% of Trump voters who express this view, 62% say his campaign’s election challenges should not continue. But only about a quarter (24%) of Trump supporters who rate his conduct as only fair agree, as do very small shares of those who view his post-election conduct as good (5%) or excellent (1%).
Few are confident presidential transition would go smoothly
With the transition from a Trump presidency to a Biden administration stalled because of the president’s continuing legal challenges, voters are widely pessimistic that a transition would go smoothly.
Nearly three-quarters of voters (73%) say they are not too or not at all confident that the transition from the Trump administration to the Biden administration will go smoothly. This includes a majority of both Biden and Trump voters.
Trump voters are slightly more confident than Biden voters that the transition will go smoothly (35% vs. 16%, respectively). Still, majorities of each group lack confidence in a smooth presidential transition (62% of Trump voters vs. 83% of Biden voters).
Warm ratings toward Biden rise following his election as president
When asked to rate Biden on a “feeling thermometer” between 0 and 100 – where 0 is the coldest, most negative rating and 100 represents the warmest, most positive – voters give Biden an average score of 48, up from 45 in October.
Overall, each of the four major 2020 candidates received a minor uptick in their average thermometer scores since October. Today, Biden’s average thermometer rating (48) is the highest of all four political leaders asked about on the survey: Trump’s overall average was 41, while ratings for Kamala Harris and Mike Pence were 45 and 44, respectively.
Biden’s boost in mean thermometer score comes from Biden and Trump voters alike. Biden voters give the president-elect an average rating of 79. This is up 5 points since October, when Biden’s average thermometer rating among his supporters was 74. And while Trump voters give Biden an average rating of just 15, this is up from an average score of 11 just two months prior.
Biden voters also view Harris more warmly than they did in October. Then, her average thermometer rating was 71. Today, her average is 78.
At the same time, Trump’s and Pence’s mean ratings among Trump voters are little changed from October (Trump’s average score was 82 then and 80 now; Pence’s were 78 in October and 79 today).
2. Voters’ evaluations of the 2020 election process
About six-in-ten voters (59%) say the elections this November in the U.S. were run and administered well, including 35% who say they were run very well. About four-in-ten (41%) say the elections were not run well. In October, a similar share (62%) of registered voters said they thought the November elections across the country would be run and administered well, though the share expecting they would be run very well (15%) was lower than the share of voters who now say the elections were run well (35%).
A month before the election, registered voters who supported Biden were more likely than Trump supporters to say they thought the elections across the nation would be run well. The gap in evaluations after the election is now even wider. Just 21% of Trump voters now say the elections in the U.S. were run and administered well; by comparison, nearly all Biden voters (94%) say they were run well, including more than six-in-ten (64%) who say they were run very well.
Prior to the election, half of registered voters who backed Trump expected that, nationally, the elections would be run and administered well – fully 30 percentage points higher than the share of Trump voters who now say they were run well (21%). The pattern is reversed among those backing Biden: About seven-in-ten (72%) registered voters who supported Biden expected the elections to be run well when asked in October – 22 points lower than the share of Biden voters who now say this (94%).
An overwhelming majority of voters (90%) think the November elections in their community were run and administered well. An identical share thought this would be the case when asked in October. Just 10% say they were not run well – a view also unchanged from before the election.
Overall, voters give higher ratings to the way elections were administered in their community than they give to elections across the country: Nine-in-ten voters say the elections in their community were run and administered well, and 62% say these were run very well.
Still, Biden voters offer more positive ratings than Trump voters of their community’s administration of elections. Nearly all Biden voters (98%) say the elections in their community were run and administered well, including 81% who say they were run very well. About eight-in-ten Trump voters (81%) say the elections were run and administered well in their community, with 42% saying they were administered very well.
Voters have more confidence in counts of votes cast at in person polling places than by mail or absentee
A majority of voters say that votes cast in this past presidential election in November were counted as voters intended, both those cast in person at polling places and those cast by absentee or mail-in ballots. However, confidence is higher in the counts of in-person votes than in votes cast by mail: About eight-in-ten voters (82%) say that they are confident that votes cast in person were counted as voters intended, while about six-in-ten (59%) say the same for votes cast by absentee or mail.
Overall, those who voted for Biden are much more likely than those who for voted Trump to have confidence that votes were counted as intended.
For votes cast in person at polling places, nearly all Biden voters (98%) say that they are confident that votes were counted as intended, compared with 64% of Trump voters. For votes cast by absentee or mail, 95% of Biden voters say they are confident in vote counts — just two-in-ten Trump voters (19%) say this.
Generally, voters’ confidence in vote counts – both in person and absentee ballots – is higher among those with more educational attainment.
Overall, Black and Hispanic voters are more likely than White voters to have confidence in vote counts, both in person votes and absentee. Fully 94% of Black voters they are confident that votes cast in person were counted as intended; 87% of Hispanic voters and 79% of white voters say this. And while 87% of Black voters say absentee ballots were counted as voters intended, 70% of Hispanic voters say this, along with only about half of white voters (53%). In large part, these differences by race and ethnicity reflect underlying partisan differences. In fact, the overall pattern in these views is somewhat reversed among Biden voters: White Biden voters are more likely than Black and Hispanic Biden voters to say they are very confident votes were cast as intended (83% of White Biden voters, compared with 68% of Black Biden voters and 70% of Hispanic Biden voters say this about in person votes, with a similar pattern seen in views about mail-in ballots).
Trump voters’ confidence in vote counts drops after the election, Biden voters’ confidence rises
Biden voters’ confidence that votes – both in person and absentee – were counted as voters intended is higher than it was that votes would be counted as intended in a survey conducted a month before Election Day. By contrast, Trump voters’ confidence in vote counts is now lower than it was in the pre-election survey. This pattern is consistent with pastelections, supporters of the winning candidate tend to express higher levels of confidence in vote counts than supporters of the losing candidate.
Currently, 98% of Biden voters say that they are confident in-person votes were counted as intended; 90% of Biden supporters had expressed confidence these votes would be counted as intended in the October survey. And Biden voters’ confidence that mail ballots were counted as intended is considerably higher than it was in October: 95% now say they are confident these ballots were counted as intended; in October, 77% of Biden supporters were confident this would happen.
By contrast, Trump voters’ confidence in the count of in person votes is 29 percentage points lower than Trump supporters’ confidence in October (92% then, 63% now), while their confidence in the count of mail in ballots is 17 percentage points lower (36% then, 19% now).
Confidence one’s ballot was accurately counted is higher among Biden voters than Trump voters
More than eight-in-ten voters (85%) are either very (59%) or somewhat (26%) confident that their vote was counted as they intended.
Those who voted for Biden are much more likely than those who cast their ballot for Trump to have confidence that their votes were counted accurately. Nearly all Biden voters (97%) say they are at least somewhat confident their vote was accurately counted, with 82% of Biden voters saying that they are very confident of this. By comparison, about seven-in-ten Trump voters say they are at least somewhat confident their vote was counted as intended, and just 35% say they are very confident of this.
Overall, Black voters (95%) are more likely than White (84%) and Hispanic (85%) voters to think their votes were accurately counted.
These views vary only modestly by age, with voters ages 65 and older somewhat more likely than other voters to say they are very confident their vote was accurately counted (65% vs. 57%).
Voters with higher levels of education are more confident that their vote was counted accurately: 91% of college graduates say they are confident their ballot was accurately counted, 82% of those with less education say the same.
Overall, in-person voters (83%) are somewhat less likely than mail in voters (88%) to say they are confident that their vote was counted accurately. However, this modest difference is attributable to Biden voters making up a larger share of mail-in voters and Trump voters making up a larger share of in person voters. Within supporters of each candidate there are no significant differences between in-person and mail voters in the confidence one’s vote was accurately counted.
CORRECTION (November 20, 2020): Several NET confident numbers in the chart “College grads, Black voters most confident their vote was counted” were incorrect and have now been updated. This update did not affect the report’s substantive findings.
3. The voting experience in 2020
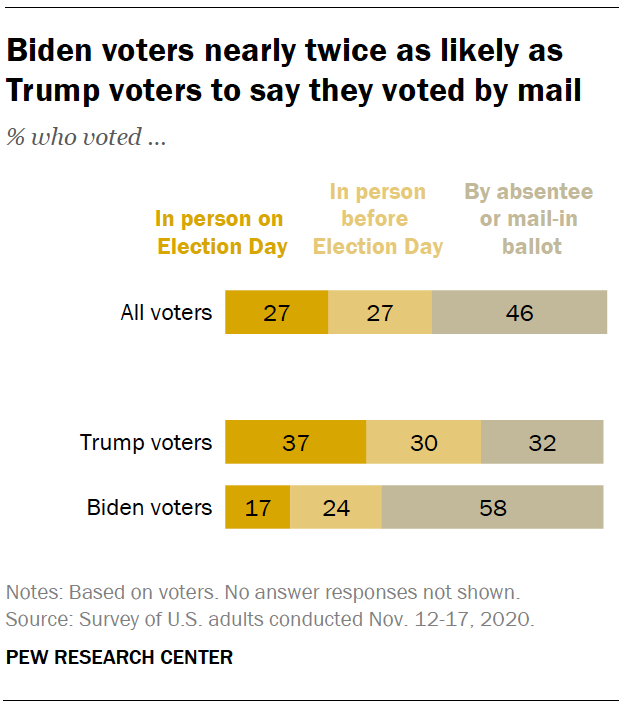
A slim majority of voters (54%) say they voted in person this November, compared with 46% who voted by absentee or mail-in ballot. About one-quarter (27%) report having voted in person on Election Day, and an identical share say they voted in person before Election Day.
Two-thirds of Trump voters say they voted in person, compared with 42% of Biden voters. Nearly four-in-ten Trump voters (37%) say they voted in person on Election Day, while just 17% of Biden voters say they cast their ballot at a polling place on Nov. 3.
Trump voters are also slightly more likely than Biden voters to say they voted in person before Election Day. Three-in-ten Trump voters report voting this way, compared with 24% of Biden voters.
Black voters were less likely to vote by absentee or mail-in ballot than white, Hispanic and Asian American voters. About four-in-ten Black voters (38%) say they voted by mail, compared with 45% of white voters, 51% of Hispanic voters and two-thirds of Asian American voters.
Among those who voted for Biden, these gaps are even larger. While 64% of White voters who supported Biden say they voted by absentee or mail-in ballot, smaller shares of Biden’s Hispanic supporters (56%) and Black supporters (39%) voted this way.
Voters ages 65 and older are more likely to say they voted by mail than younger voters. Similar shares of voters ages 18 to 34 (44%), 35 to 49 (42%) and 50 to 64 (41%) say they voted by mail. Among those 65 and older, a majority (55%) say they voted this way.
Within each age group, Biden voters are much more likely than Trump voters to say they voted by mail, with the size of this gap largely the same across groups.
College graduates are more likely than those without a college degree to say they voted by mail (53% vs. 42%).
Among absentee voters, Biden voters more likely than Trump voters to say they returned ballots early
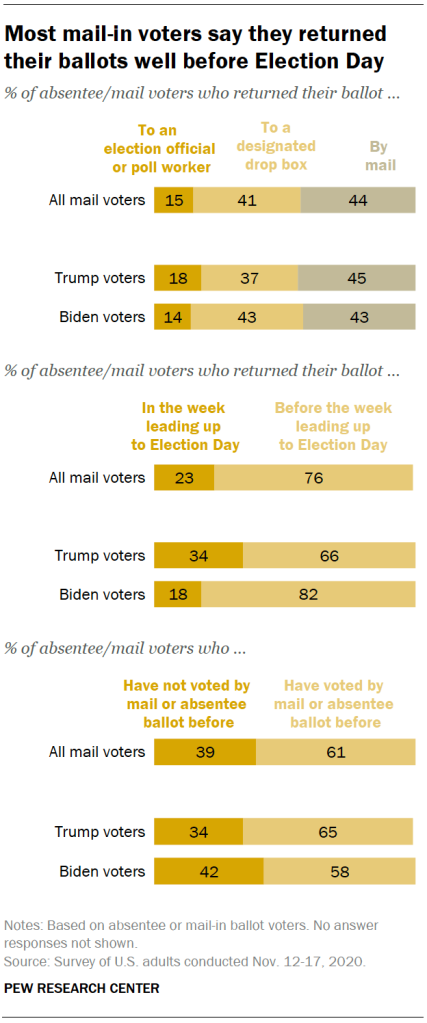
Those who voted by absentee or mail-in ballot were about equally likely to return their ballots to a designated drop box as they were to return their ballots by mail. About four-in-ten (41%) say they returned their ballots to a drop box, while 44% say they returned their ballots by mail; 15% say they returned their ballots in person to an election official or poll worker.
This pattern was largely the same among both Trump and Biden absentee voters.
Overall, about three-quarters of absentee or mail-in ballot voters (76%) report having returned their ballots at least a week before Election Day, while 23% say they returned their ballots in the final week leading up to Election Day. Biden voters were more likely than Trump voters to report having returned their absentee ballots in early: 82% of Biden voters who voted by absentee or mail ballot returned their ballots at least a week before Election Day, compared with 66% of Trump voters who voted this way.
Nearly four-in-ten absentee or mail voters (39%) say they had never voted by this method prior to this November’s election. Biden absentee or mail-in voters were slightly more likely than Trump absentee voters to report not having voted this way in the past (42% vs. 34%).
Nearly one-in-five in-person voters waited more than 30 minutes to vote
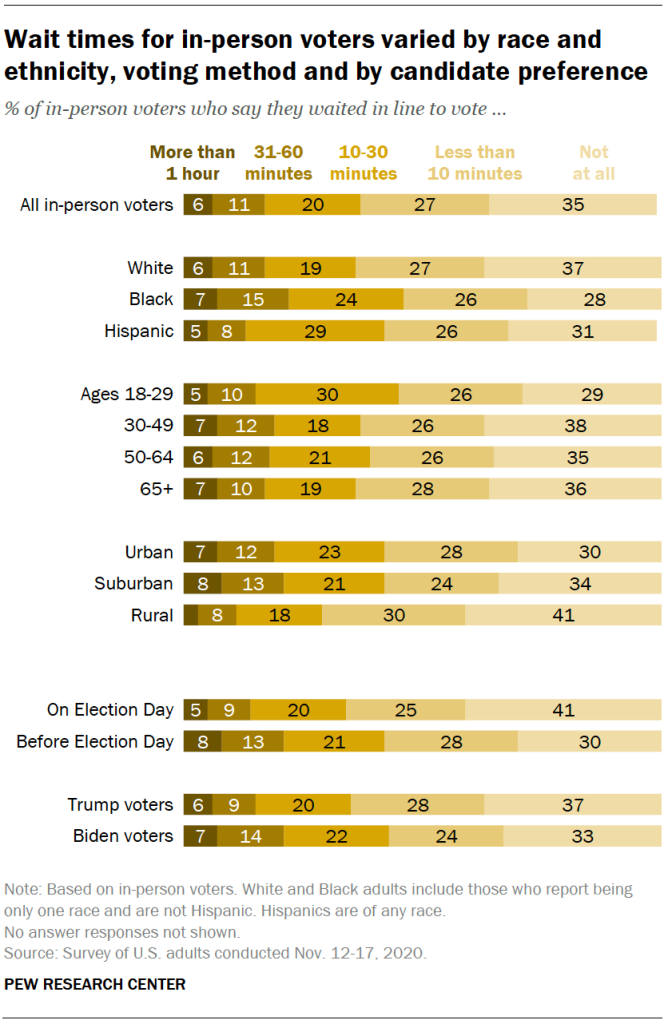
Among voters who voted in person in this election, 35% say they did not wait in line to vote at all. An additional 27% say they waited for less than 10 minutes. One-in-five waited for 10 to 30 minutes, 11% waited for 31 minutes to an hour, and 6% say they waited in line for more than an hour to vote.
Those who voted early waited longer than those who voted on Election Day: 21% of early in-person voters waited more than half an hour, compared with 14% of Election Day voters.
Black in-person voters also waited longer to vote than White or Hispanic in-person voters. Black voters are 5 percentage points slightly more likely than white voters to say they waited more than 30 minutes to vote and 9 points more likely than Hispanic voters to say this.
Those who voted for Biden waited longer to vote, on average, than those who voted for Trump. About two-in-ten in-person Biden voters (21%) waited more than half an hour to vote, compared with 15% of in-person Trump voters.
These differences are partly related to the longer wait times faced by those living in more densely populated areas. Voters living in rural areas were much less likely to face a wait of more than half an hour (11% of rural voters) than those living in urban (19%) or suburban (21%) areas.
Most voters say it was easy to vote in the election
More than nine-in-ten voters (94%) say that voting in the election this November was either very easy (77%) or somewhat easy (17%), while just 6% say that voting was very or somewhat difficult.
A month before the election, about a third of registered voters (35%) expected voting would be at least somewhat difficult, compared with 36% who expected it to be somewhat easy and 29% who expected it to be very easy.
Biden supporters had been somewhat more likely than Trump supporters to say they expected voting to be at least somewhat difficult in the preelection survey, with 38% of Biden supporters and three-in-ten Trump supporters saying this.
However, nearly identical shares of those who voted for Biden (95%) and those who voted for Trump (93%) now say that voting this November was easy. And Biden voters are now somewhat more likely than Trump voters to say that voting was very easy (81% vs. 73%).
In their own words: Why some voters faced difficulties casting ballots
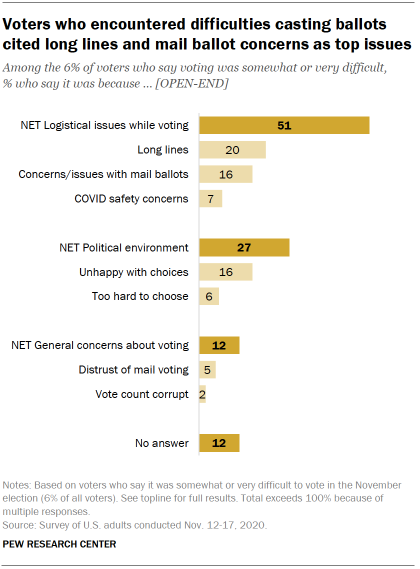
While most voters who cast ballots in the November election say voting was very or somewhat easy for them personally (94%), about 6% of voters say they encountered difficulties when casting their ballot.
For about half of these voters (51%), logistical issues like long lines or safety concerns amid the coronavirus pandemic made voting difficult. One-in-five pointed to long voting lines, and many cited unusually long wait times at polling places. One 58-year-old woman voter said, “I had to stand in the cold and rain for approximately an hour and a half. Never had to stand in line for more than 10-15 minutes inside before.”
For 16% of these voters, issues with submitting absentee or mail ballots made voting difficult. While some pointed to confusion about rules and requirements surrounding vote by mail, others mentioned delays in receiving or tracking their mail ballots in time. A 26-year-old man said, “I requested a mail in ballot, didn’t receive it, contacted my county and they said to wait 10 more business days. I contacted them again, then they finally sent a new one to me the week before the election. I made the choice to drop it off rather than mail it in because it was so close to Election Day.”
Some voters also noted that safety concerns about voting during the pandemic led to hurdles while making voting plans. One woman noted, “People in my family tested positive for COVID-19 on October 26, so instead of voting in person, we had to request a mail in ballot at the last minute.”
Nearly three-in-ten of those who say that voting was difficult say it is because they could not decide who to vote for – or did not like any of their choices in candidate: 16% say they were unhappy with their choices while 6% say they could not make up their mind about who to vote for.
About one-in-ten cited general concerns and suspicions about the voting system in general. This includes uncertainty about the vote counting process as a whole or concerns that states were tampering with the voting process, as well as specific concerns about more widespread use of mail-in voting. As one 60-year-old man put it, “I didn’t like mail-in ballots. It encourages voter fraud.”
Convenience was top factor in voters’ decisions about which way to vote
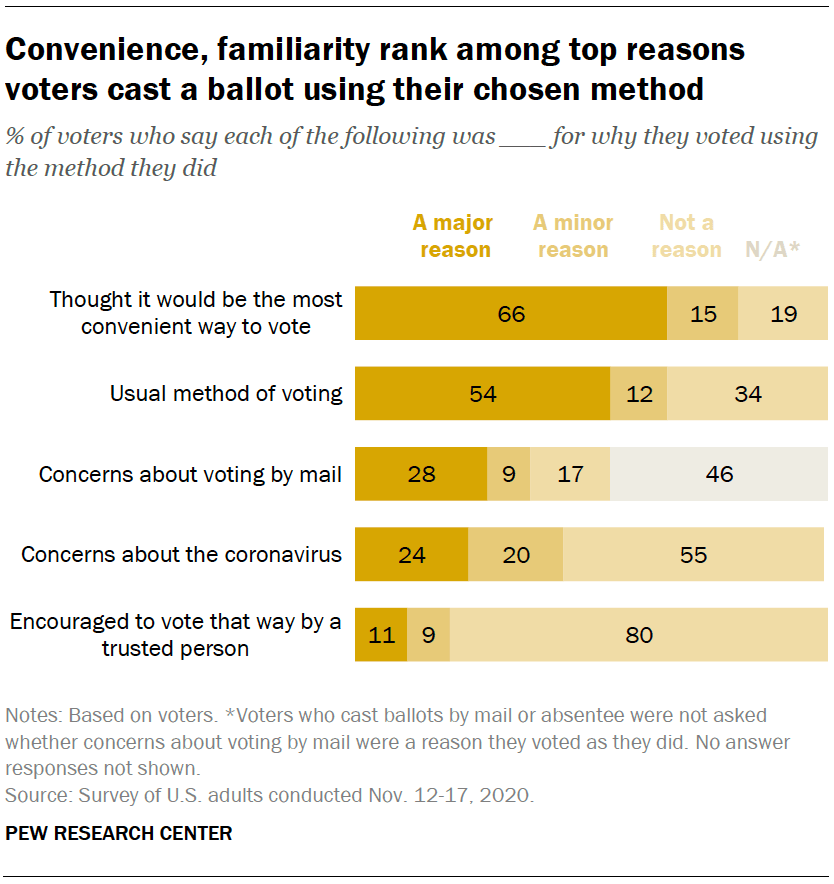
Nearly two-thirds of voters (66%) say that convenience was a major reason why they chose to vote in person on Election Day, in person before Election Day, or by mail or absentee ballot. Another 15% say that this was a minor reason for voting the way they did, while 19% say that this was not a reason.
Just over half of voters (54%) say that voting the way they usually do was a major reason for their choice of method, and about one-in-ten (12%) say this was a minor reason.
Smaller shares of voters say that concerns about voting by mail (28%) or concerns about catching or spreading the coronavirus (24%) were major reasons why they voted as they did. And despite widespread expectations earlier this year that the pandemic would disrupt the November election, a majority of voters (55%) say that concerns about the coronavirus were not a factor in their decision about how to cast their ballot.
Just two-in-ten voters say that being encouraged to vote a certain way by someone they trust was either a major reason (11%) or a minor reason (9%) for the vote method they chose.
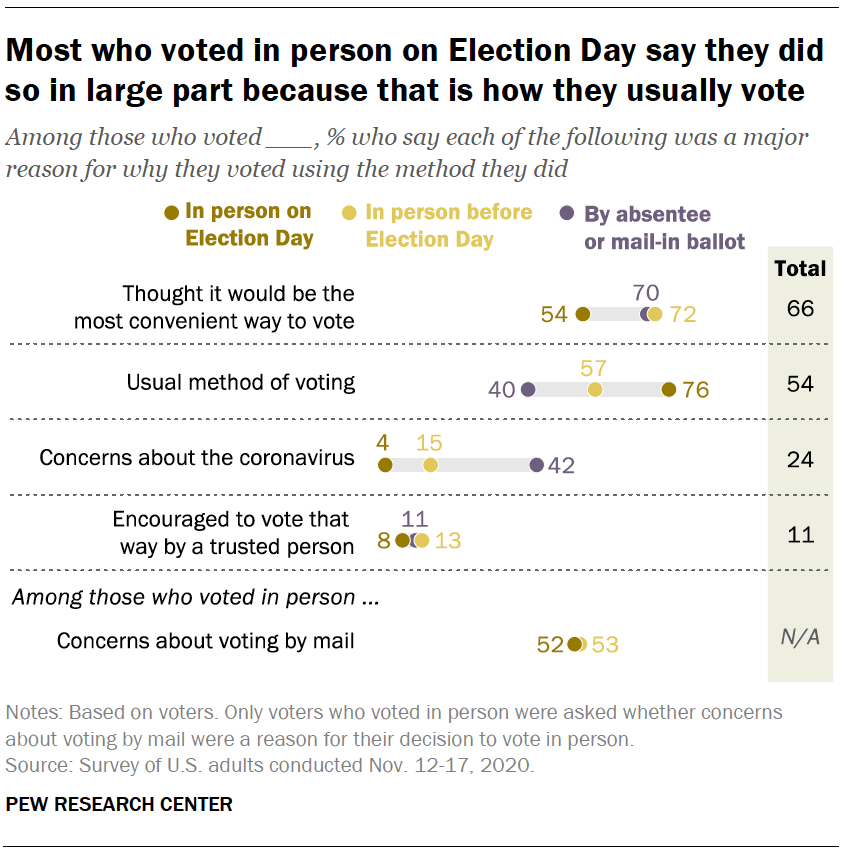
Those who voted using different methods this November point to somewhat different reasons for doing so. Among voters who voted at a polling place on Election Day, 76% say that a major reason for doing so was that they usually vote that way. In-person early voters are 19 percentage points less likely to say that this was a major reason for voting the way they did, and absentee or mail-in voters are 36 points less likely to say this.
Seven-in-ten mail voters (70%) and a similar share of in-person early voters (72%) say convenience was a major reason they voted the way they did. A much narrower majority (54%) of in-person Election Day voters cited convenience as a major reason for doing so.
About half of in-person voters, (53% among in-person early voters, 52% among in-person Election Day voters) say that a major reason for voting in person was their concerns about voting by mail.
About four-in-ten mail voters (42%) cite concerns about catching or spreading the coronavirus as a major reason for voting by absentee or mail-in ballot. Just 15% of in-person early voters and 4% of in-person Election Day voters say that concerns about the coronavirus were a major reason why they voted using the method they chose.
Similar shares of in-person early voters (13%), mail voters (11%) and in-person Election Day voters (8%) say that encouragement from a person they trusted was a major reason for choosing to vote as they did.
Among in-person voters, 68% of those who voted for Trump say that concerns about voting by mail were a major reason why they voted in person. By comparison, a far smaller share of in-person Biden voters (32% ) cite this as a major reason why they voted in person.
This gap is somewhat larger among in-person Election Day voters than among in-person early voters. Among early in-person voters, Trump voters are 32 percentage points more likely than Biden voters to say concerns about voting by mail were a major reason for voting as they did. Among in-person Election Day voters, Trump voters are 42 points more likely than Biden voters to say this.
By comparison, Biden voters are more likely than Trump voters to say that concerns about the coronavirus were a major reason for voting as they did. Overall, 39% of Biden voters cited this as a major reason, compared with just 9% of Trump voters.
About half of Biden voters who voted absentee or by mail (53%) say that concerns about the coronavirus were a major reason they voted by mail, while just 20% of Trump voters who voted this way cited this as a major reason why.
About a quarter of Biden voters who voted in person before Election Day (27%) also pointed to COVID-19 concerns as a major reason for doing so, while just 6% of in person Trump early voters said the same. Few Biden Election Day voters (8%) and almost no Trump Election Day voters (1%) considered concerns about the pandemic as a major reason for voting the way they did.
Researching voting methods, checking registration, tracking wait times and absentee ballots
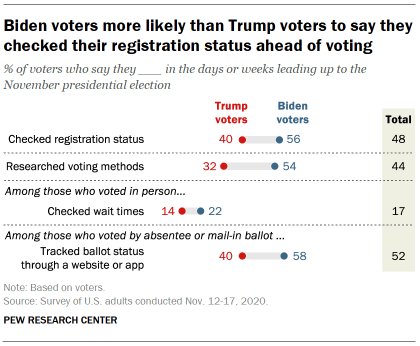
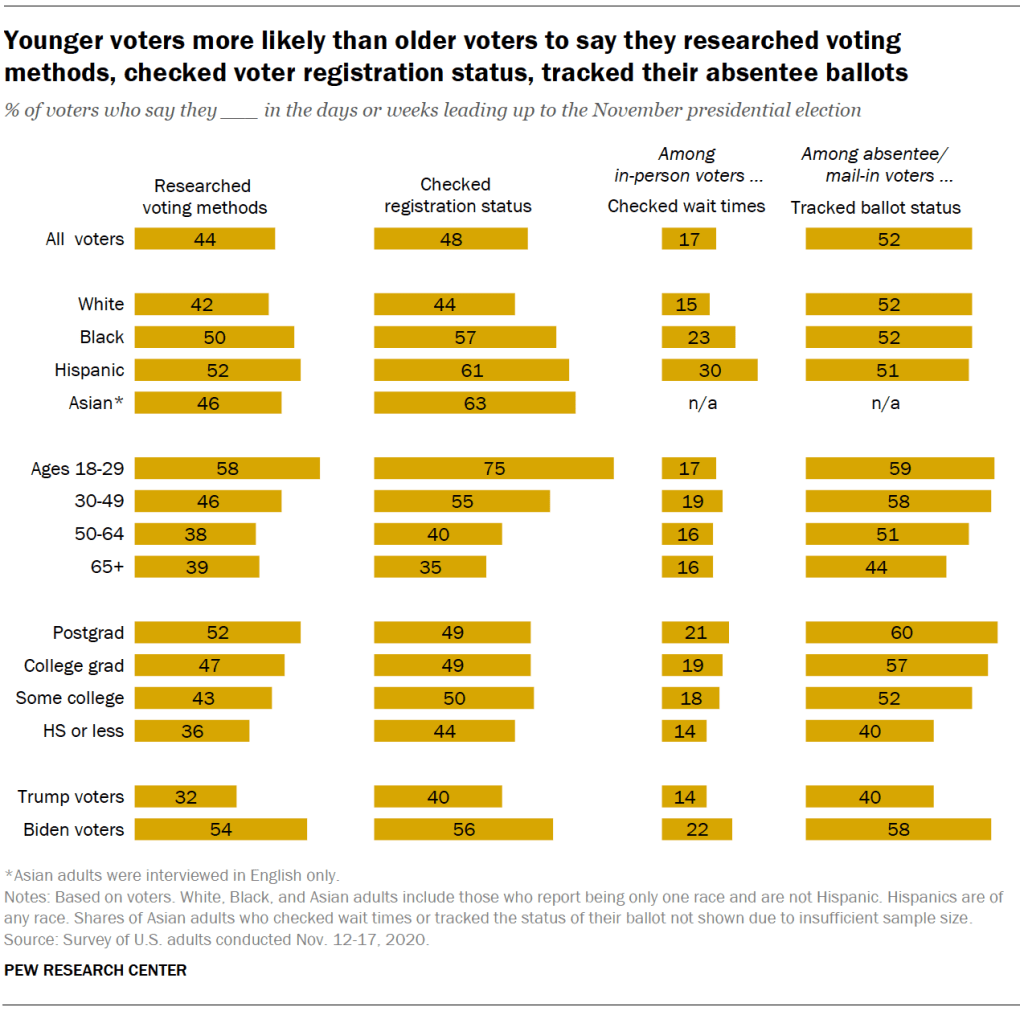
Biden voters are more likely than Trump voters to say they took a variety of steps to ensure they would be able to cast a ballot in the days and weeks leading up to Election Day. Nearly half of voters (48%) say they checked their voter registration status prior to the election – including 56% of Biden voters and 40% of Trump voters. And a majority of Biden voters (54%) also say they researched their options for how to vote in person or by mail this year, compared with 32% of Trump voters.
Among those who voted in person in the November election, 17% say they checked wait times at an in-person polling place before going to vote: 22% of Biden voters and 14% of Trump voters say they did this.
About half of absentee or mail-in ballot voters (52%) say they tracked their ballot’s status through a website or app: Nearly six-in-ten Biden voters (58%) say they did this, compared with 40% of Trump voters.
Black voters, Hispanic voters and Asian voters are somewhat more likely than White voters to say they checked their registration status, though these differences are closely related to levels of support for the two candidates within different racial and ethnic groups.
About six-in-ten Black (57%), Hispanic (61%) and Asian (63%) voters say they checked their registration status in the days and weeks prior to voting; a smaller share (44%) of White voters report having done this. And among in-person voters, Hispanic (30%) and Black (23%) voters are both more likely than White voters (15%) to say they checked the wait time at a polling place before going to vote.
Younger voters and those with more years of formal education are also more likely to say they took several of these steps than older voters or those with fewer years of education, respectively.
Three-quarters of voters ages 18 to 29 say they checked their voter registration status in the days or weeks leading up to the election, compared with 55% of voters ages 30 to 49, 40% of those 50 to 64 and 35% of those 65 and older. A majority of voters ages 18 to 29 (58%) say they researched their options for voting, compared with 46% of 30 to 49 year-olds and 39% of those 50 and older. And 58% of mail voters under 50 tracked their ballot’s status online while 51% of those ages 50 to 64 and 44% of those 65 years-old or older say they did the same.
Voters with a college degree are more likely to say they researched their options for voting than those without a degree (49% vs. 40%). And among mail voters, nearly six-in-ten college graduates (58%) reported tracking their ballot online, compared with 46% of those without a degree.
4. Voters’ reflections on the campaign
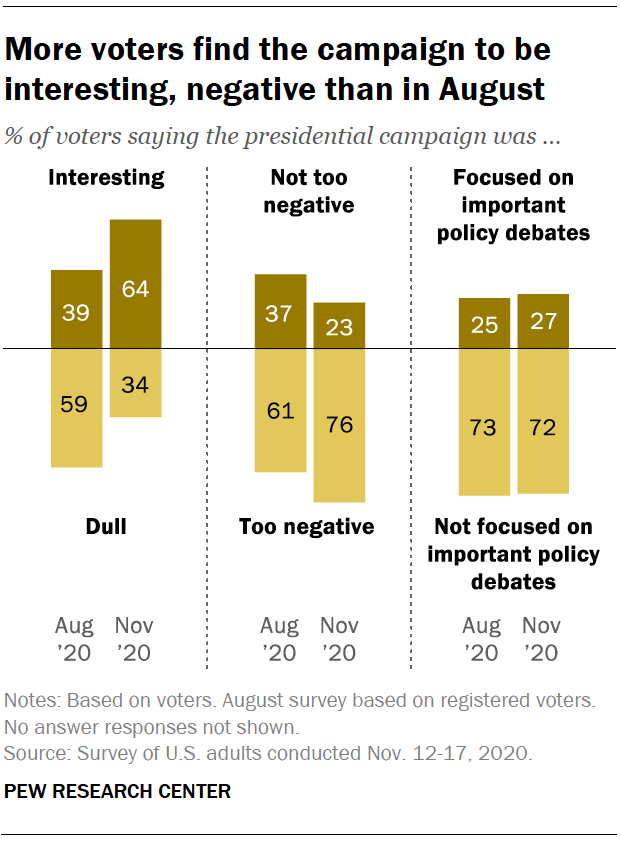
Reflecting on the 2020 presidential campaign, most voters find it was interesting rather than dull (64% vs. 34%), but also say it was too negative (76%) and not focused on important policy debates (72%).
Nearly two-thirds of voters (64%) say, in retrospect, they thought the campaign was interesting. This is a significant shift of opinion since August, when just 39% of registered voters said the campaign was interesting and most (59%) said they found the campaign dull.
Today, roughly three-quarters of voters (76%) say the campaign was too negative. In August, 61% of registered voters said they thought the campaign was too negative.
Only about a quarter of voters (27%) say the 2020 campaign was focused on important policy debates, little different than the share of registered voters who said this in August (25%).
Biden voters (72%) are more likely than Trump voters (56%) to say the campaign was interesting, though majorities in both groups now say this. In August, only about four-in-ten supporters of each candidate said the campaign was interesting.
Both Biden and Trump voters are also more likely to say the campaign was too negative than they were earlier in the year. More than seven-in-ten Biden (73%) and Trump voters (78%) say the campaign was too negative. About six-in-ten (59% and 62%, respectively) said this in August.
Just a third of Biden voters and an even smaller share of Trump voters (21%) say the 2020 campaign was focused on important policy debates. However, Biden voters are somewhat more likely to say this today than they were in August, while the share of Trump voters saying this is slightly lower than the share of his supporters who said this in August (25% now, 21% then).
Most were satisfied with the choice of candidates
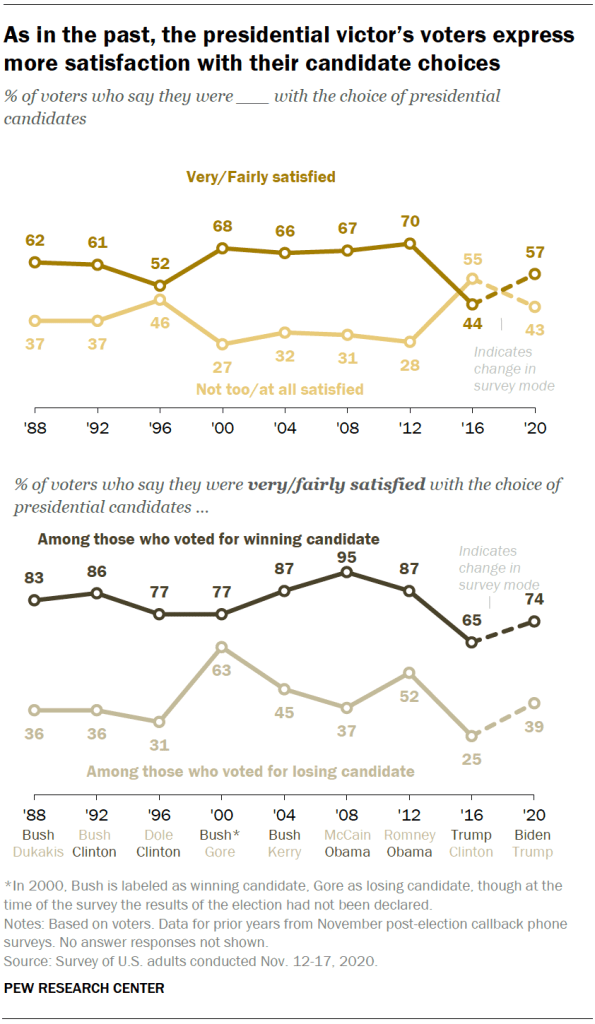
Overall, 57% of voters say they were very or fairly satisfied with the choice of presidential candidates this year, while 43% say they were not too or not at all satisfied with the choice of presidential candidates.
Four years ago, just 44% said they were very or fairly satisfied with the choice of candidates. (Note: Post-election surveys from 1988-2016 were conducted by phone, while the latest survey was conducted online; there may be modest mode differences on this question.)
Among those who voted for Biden, nearly three-quarters (74%) say they were very or fairly satisfied with the choice of presidential candidates, compared with 39% of Trump voters who say they were satisfied.
Just over half of Biden voters said their vote was more ‘against Trump’ than ‘for Biden’
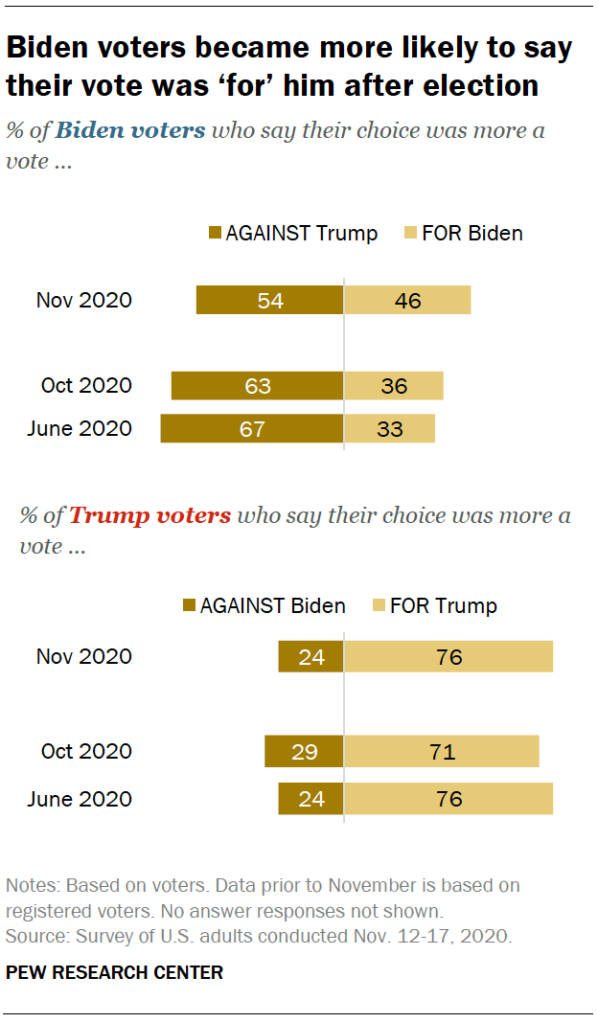
As was the case in surveys conducted before the election, Trump voters remain more likely than Biden voters to consider their vote more of a vote “for” their preferred candidate. About three-quarters of Trump voters (76%) say their choice was more a vote for Trump, while 24% say their choice was more a vote against Biden.
Biden voters are more divided. A narrow majority (54%) say their choice was more a vote against Trump, while 46% say their choice was more a vote for Biden.
This general pattern is consistent with previous presidential elections involving incumbent presidents, with supporters of the challenger more likely to say their choice is more a vote against the incumbent than supporters of the incumbent were to view their support as against the challenger.
Slightly larger majorities of Biden supporters in June (67%) and October (63%) said their choice was more a vote against Trump than say this in the post-election survey (54%).
The share of Trump voters saying their vote was more a vote of support for Trump than against Biden is little different than it was in preelection surveys.
More than eight-in-ten voters (84%) say they made up their mind about who they were going to vote for in the 2020 presidential election before September. By comparison, in the wake of the 2016 election, a smaller – though still substantial – majority of 2016 voters (67%) reported having made their mind up before September.
This year, just 5% of voters say they made up their mind about their vote in the last week before Election Day. In 2016, 13% said they had made their mind up in the last week.
Trump voters are slightly more likely than Biden voters to report having made up their mind about their vote in the last week before Election Day (6% vs. 4%).
5. Key post-election issues: The pandemic and the economy
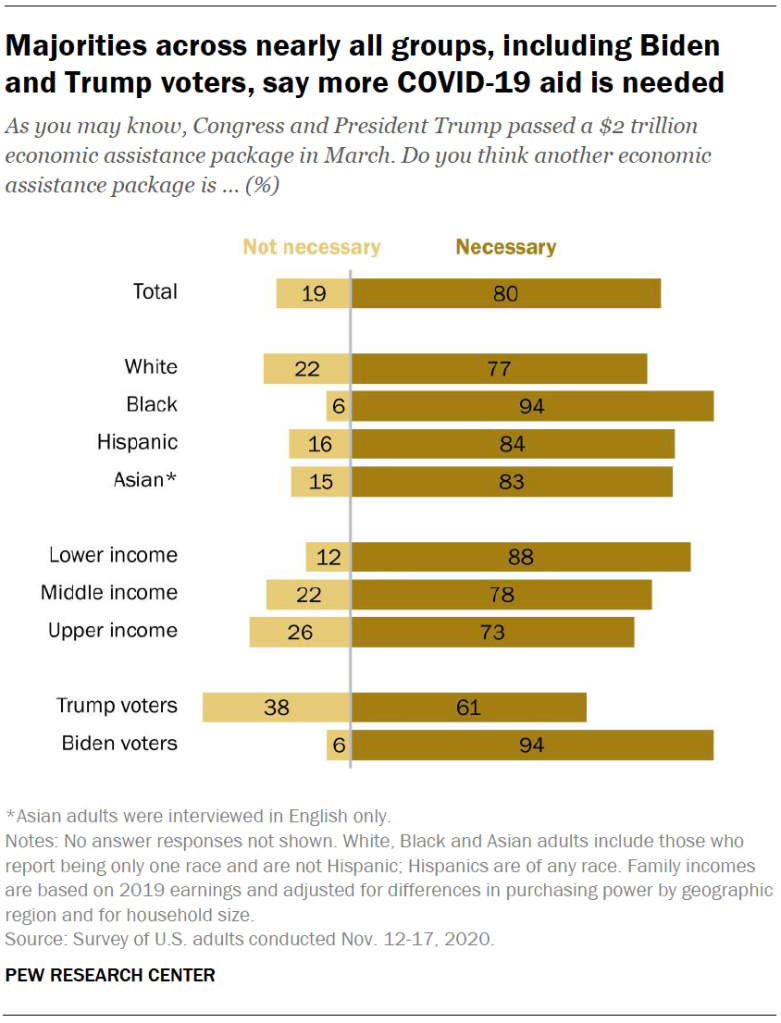
As Congress and the White House continue to wrangle over the size and necessity of a new coronavirus assistance bill, an overwhelming majority of Americans (80%) say they believe more aid is necessary. Only about one-in-five (19%) say that a second major relief package is not necessary. This is comparable to the share who said in April that another bill would be necessary.
When asked if President Trump and the current Congress should pass a new economic aid package as soon as possible or if the package can wait until after the presidential inauguration in January, 85% of those who think additional aid is needed say it should be passed as soon as possible.
Overall, 68% of the public say a new economic aid package is needed in response to the coronavirus and that it should be passed as soon as possible.
Sizable majorities across nearly all demographic and income categories say more economic assistance is needed. However, while an overwhelming share of those who voted for Joe Biden (94%) say a new aid package is needed, a smaller majority of Trump supporters (61%) say additional assistance is necessary.
There also are differences by household income in views of the necessity of a new aid package, with larger shares of lower income adults saying such assistance is needed.
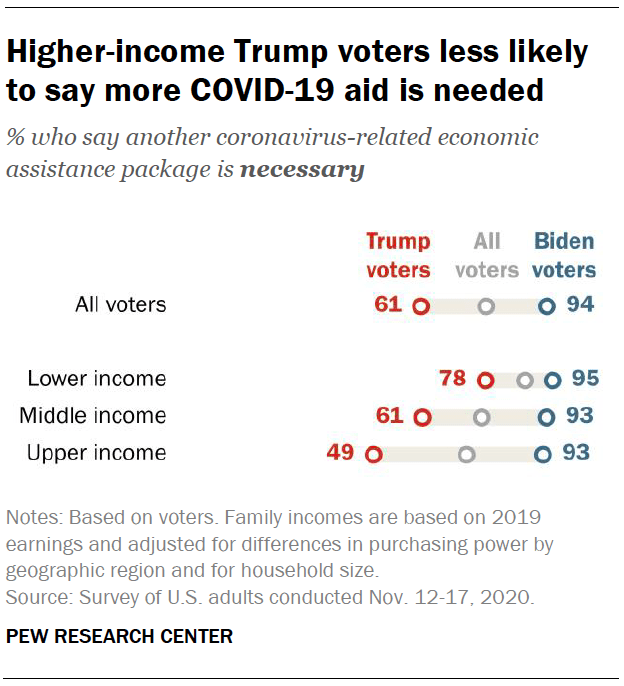
However, the relationship between household income and support for a second major relief bill is only seen among Trump voters. About half (49%) of Trump voters in upper-income households say that another relief bill is necessary; larger shares of Trump voters in middle- (61%) and lower-income households (78%) say an additional aid package is needed.
Majorities of more than 90% of Biden voters, regardless of household income, say that a second major assistance package is necessary.
Deep divides between Biden and Trump supporters on new coronavirus restrictions
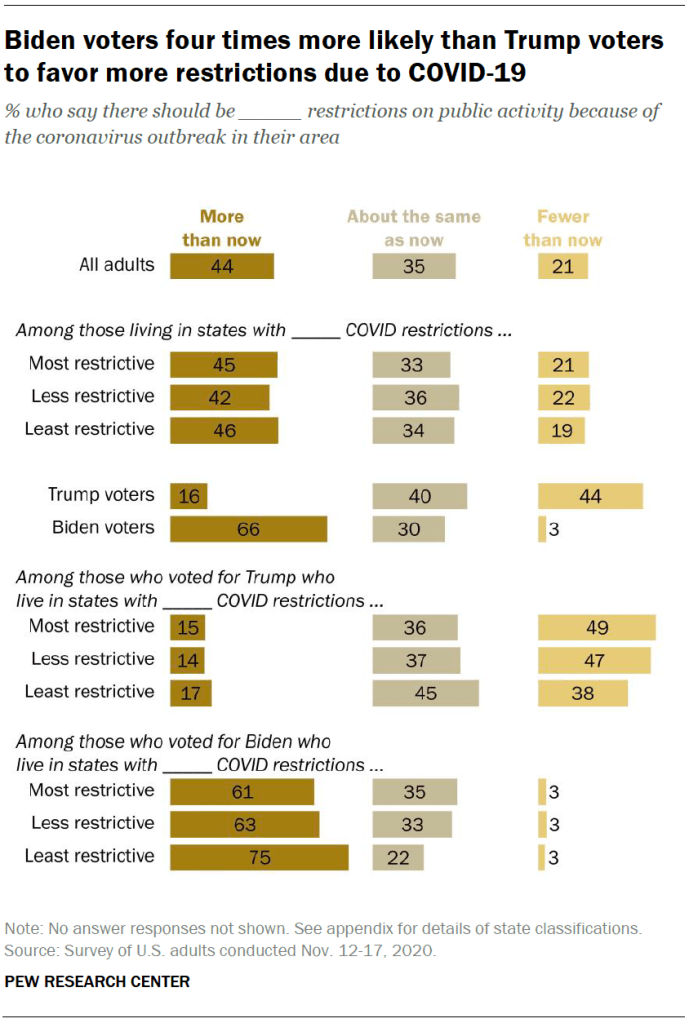
As the nation struggles with a sharp rise in coronavirus cases, more than four-in-ten Americans (44%) say there should be more restrictions on public activity in their area, 35% say the limits on activity should stay about the same as they are now and 21% favor fewer restrictions.
Voters’ candidate preferences are a much bigger factor than the level of current coronavirus restrictions in their states or the impact the coronavirus has had on the states where they live.
Two-thirds of Biden voters say there should be more restrictions on public activity in their area because of the coronavirus outbreak, while only half as many say that restrictions should remain as they are (30%) or be loosened (3%).
Just 16% of Trump voters favor more restrictions on public activity due to the outbreak. Far more want to maintain current restrictions (40%) or say there should be fewer restrictions than there are currently (44%).
Overall opinions about limits on public activity because of the coronavirus outbreak vary only modestly between states like Massachusetts, New York, and New Jersey, which have continued to keep relatively strict social-distancing policies in place (including mask mandates, mandatory quarantines for travelers, limits on gatherings and closures or restrictions for bars and restaurants) and states that have not enacted these policies or rolled them backed as they try to reopen their economies (including Florida, Missouri, South Dakota and Wyoming).
However, Trump voters living in places with the most restrictions are most likely to say that these restrictions should be rolled back (49%), while those living in places with the least restrictions are most likely to say that restrictions should be kept as they are (45%) or even decreased further (38%). Only relatively small shares of Trump voters, regardless of where they live, say that restrictions should be increased.
Majorities of Biden voters say that restrictions should be increased. This is especially true of those living in states with the least number of restrictions (75% living in these states say restrictions should be increased). Biden voters living in the most restrictive places were relatively more likely than other Biden voters to say that restrictions should remain the same.
Confidence in Biden and Trump on coronavirus, economy little changed
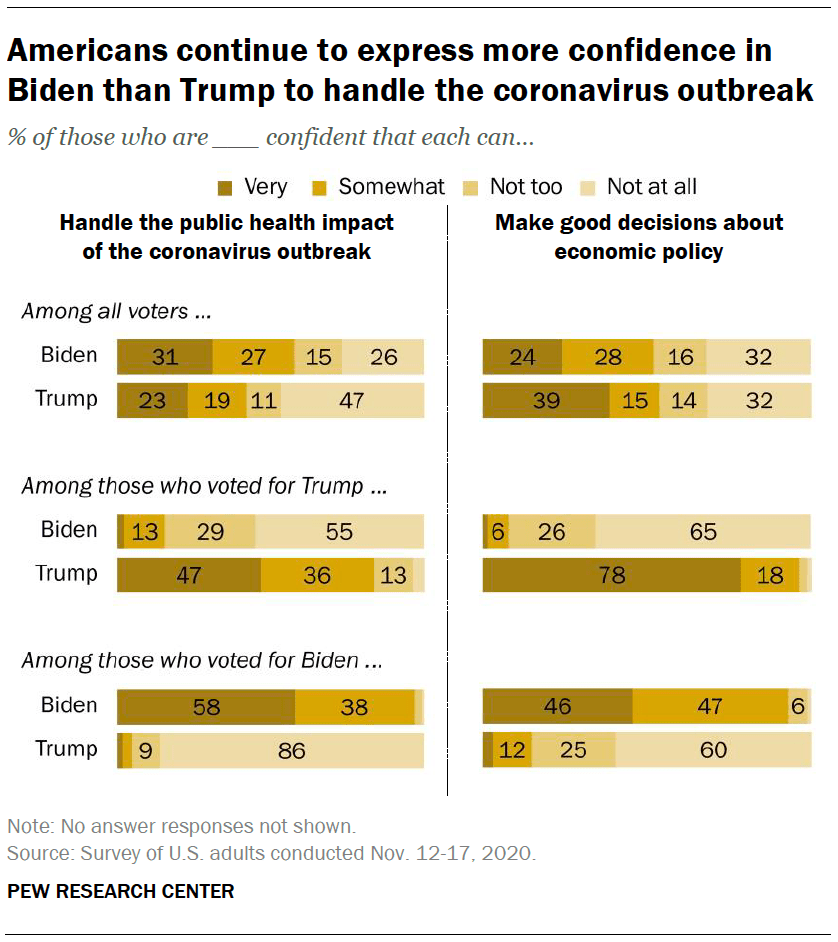
Voters remain more confident in Biden than Trump to handle the public health impact of the coronavirus outbreak. Overall, 58% of voters are very or somewhat confident in President-elect Biden’s ability to handle the outbreak. Only 42% of voters say the same about Trump. The attitudes of voters who voted in the Nov. 3 election differ little from those of registered voters measured in October.
While Biden and Trump voters express far more confidence in their candidate than in his opponent, Biden voters are especially critical of Trump’s handling of the coronavirus. Among Biden voters, 86% say they are not confident at all in Trump’s handling of the coronavirus; far fewer Trump voters (55%) have no confidence at all in Biden.
In addition, while 58% of Biden voters are very confident in his ability to handle the coronavirus, fewer Trump voters (47%) are very confident in the president.
Comparable shares of voters say they are very or somewhat confident in Biden (52%) and Trump (54%) to make good decisions about economic policy. However, significantly more voters are very confident in Trump (39%) than Biden (24%) to make good decisions about economic policy. Trump voters express a high degree of confidence in him on the economy (78% very confident). By contrast, fewer Biden voters (46%) are very confident in the former vice president to make good decisions on economic policy.
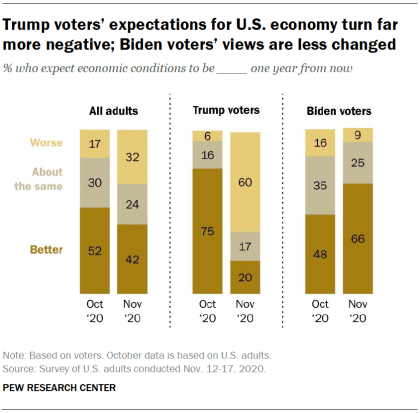
Voters’ economic expectations turn less positive, driven by a major shift among Trump voters
Overall, Americans’ views of the current state of the nation’s economy not much changed from before the election, but voters’ expectations about the future have shifted dramatically.
Before the election, 52% of Americans believed economic conditions would be better next year and only 17% said they expected things to be worse. Today, 42% say they expect things will be better next year and 32% say they expect things to be worse.
This sharp negative turn in overall economic expectations has been driven by Trump voters. Three-quarters of Trump voters were very optimistic about the economic future of the country last month, and only 6% said they expected economic conditions to be worse next year. Now 60% of Trump voters say that they expect economic conditions to worsen.
Biden voters have become more optimistic following the election, but the change has been less pronounced compared with Trump voters. Last month about half of Biden supporters (48%) said they expected economic conditions to improve over the next year. Today, 66% say they expect the nation’s economy to get better.
Acknowledgments
This report is a collaborative effort based on the input and analysis of the following individuals:
Research team
Carroll Doherty, Director, Political Research
Jocelyn Kiley, Associate Director, Political Research
Andrew Daniller, Research Associate
Bradley Jones, Research Associate
Hannah Hartig, Research Associate
Amina Dunn, Research Analyst
Hannah Gilberstadt, Research Assistant
Ted Van Green, Research Assistant
Vianney Gomez, Research Assistant
Communications and editorial
Nida Asheer, Communications Manager
Calvin Jordan, Communications Associate
David Kent, Senior Copy Editor
Graphic design and web publishing
Peter Bell, Design Director
Alissa Scheller, Information Graphics Designer
Sara Atske, Associate Digital Producer
Methodology
Andrew Mercer, Senior Research Methodologist
Nick Bertoni, Senior Panel Manager
Arnold Lau, Research Analyst
Others at Pew Research Center also gave valuable assistance on this project, including Research Analyst Luis Noe-Bustamante and Research Assistant Jesse Bennett.
Appendix: Categorization of states based on COVID restrictions
States were given a score based on the number of measures they have in place to prevent the spread of the coronavirus. These include:
Stay at home orders
Mandatory quarantines for travelers
Closures of non-essential businesses
Closures and restrictions for restaurants and bars
Limits on gatherings
Mandatory face coverings
An additive index was created and then the states were divided into three roughly equal sized groups (based on population).
Defining income tiers
To create upper-, middle- and lower-income tiers, respondents’ 2019 family incomes were adjusted for differences in purchasing power by geographic region and for household size. “Middle-income” adults live in families with annual incomes that are two-thirds to double the median family income in the panel (after incomes have been adjusted for the local cost of living and for household size). The middle-income range for the American Trends Panel is about $38,900 to $116,800 annually for an average family of three. Lower-income families have incomes less than roughly $38,900, and upper-income families have incomes greater than roughly $116,800 (all figures expressed in 2019 dollars).
Based on these adjustments, among respondents who provided their income and household size, 33% are lower income, 45% are middle income and 18% fall into the upper-income tier. An additional 4% either didn’t offer a response to the income question or the household size question.
For more information about how the income tiers were determined, please see here.
Methodology
The American Trends Panel survey methodology
Overview
The American Trends Panel (ATP), created by Pew Research Center, is a nationally representative panel of randomly selected U.S. adults. Panelists participate via self-administered web surveys. Panelists who do not have internet access at home are provided with a tablet and wireless internet connection. Interviews are conducted in both English and Spanish. The panel is being managed by Ipsos.
Data in this report is drawn from the panel wave conducted Nov. 12 to Nov. 17, 2020. A total of 11,818 panelists responded out of 13,568 who were sampled, for a response rate of 87%. This does not include two panelists who were removed from the data due to extremely high rates of refusal or straightlining. The cumulative response rate accounting for nonresponse to the recruitment surveys and attrition is 5%. The break-off rate among panelists who logged on to the survey and completed at least one item is 1%. The margin of sampling error for the full sample of 11,818 respondents is plus or minus 1.6 percentage points.
Panel recruitment
The ATP was created in 2014, with the first cohort of panelists invited to join the panel at the end of a large, national, landline and cellphone random-digit-dial survey that was conducted in both English and Spanish. Two additional recruitments were conducted using the same method in 2015 and 2017, respectively. Across these three surveys, a total of 19,718 adults were invited to join the ATP, of whom 9,942 (50%) agreed to participate.
In August 2018, the ATP switched from telephone to address-based recruitment. Invitations were sent to a random, address-based sample of households selected from the U.S. Postal Service’s Delivery Sequence File. Two additional recruitments were conducted using the same method in 2019 and 2020, respectively. Across these three address-based recruitments, a total of 17,161 adults were invited to join the ATP, of whom 15,134 (88%) agreed to join the panel and completed an initial profile survey. In each household, the adult with the next birthday was asked to go online to complete a survey, at the end of which they were invited to join the panel. Of the 25,076 individuals who have ever joined the ATP, 13,568 remained active panelists and continued to receive survey invitations at the time this survey was conducted.
The U.S. Postal Service’s Delivery Sequence File has been estimated to cover as much as 98% of the population, although some studies suggest that the coverage could be in the low 90% range.1 The American Trends Panel never uses breakout routers or chains that direct respondents to additional surveys.
Sample design
The overall target population for this survey was non-institutionalized persons ages 18 and older, living in the U.S., including Alaska and Hawaii.
Questionnaire development and testing
The questionnaire was developed by Pew Research Center in consultation with Ipsos. The web program was rigorously tested on both PC and mobile devices by the Ipsos project management team and Pew Research Center researchers. The Ipsos project management team also populated test data which was analyzed in SPSS to ensure the logic and randomizations were working as intended before launching the survey.
Incentives
All respondents were offered a post-paid incentive for their participation. Respondents could choose to receive the post-paid incentive in the form of a check or a gift code to Amazon.com or could choose to decline the incentive. Incentive amounts ranged from $5 to $20 depending on whether the respondent belongs to a part of the population that is harder or easier to reach. Differential incentive amounts were designed to increase panel survey participation among groups that traditionally have low survey response propensities.
Data collection protocol
The data collection field period for this survey was Nov. 12 to Nov. 17, 2020.
On Nov. 12 and Nov. 13, invitations were sent out in two separate launches: Soft Launch and Full Launch. Sixty panelists were included in the soft launch, which began with an initial invitation sent on November 12, 2020. The ATP panelists chosen for the initial soft launch were known responders who had completed previous ATP surveys within one day of receiving their invitation. All remaining English- and Spanish-speaking panelists were included in the full launch and were sent an invitation on November 13, 2020.
All panelists with an email address received an email invitation and up to two email reminders if they did not respond to the survey. All ATP panelists that consented to SMS messages received an SMS invitation and up to one SMS reminder. Interactive voice recording (IVR) reminder calls were made on November 14, 2020 to 179 tablet households that previously provided consent to receive these reminders.
Data quality checks
To ensure high-quality data, the Center’s researchers performed data quality checks to identify any respondents showing clear patterns of satisficing. This includes checking for very high rates of leaving questions blank, as well as always selecting the first or last answer presented. As a result of this checking, two ATP respondents were removed from the survey dataset prior to weighting and analysis.
Weighting
The ATP data was weighted in a multistep process that accounts for multiple stages of sampling and nonresponse that occur at different points in the survey process. First, each panelist begins with a base weight that reflects their probability of selection for their initial recruitment survey (and the probability of being invited to participate in the panel in cases where only a subsample of respondents were invited). The base weights for panelists recruited in different years are scaled to be proportionate to the effective sample size for all active panelists in their cohort. To correct for nonresponse to the initial recruitment surveys and gradual panel attrition, the base weights for all active panelists are calibrated to align with the population benchmarks identified in the accompanying table to create a full-panel weight.
For ATP waves in which only a subsample of panelists are invited to participate, a wave-specific base weight is created by adjusting the full-panel weights for subsampled panelists to account for any differential probabilities of selection for the particular panel wave. For waves in which all active panelists are invited to participate, the wave-specific base weight is identical to the full-panel weight.
The wave-specific base weights for panelists who completed the survey are again calibrated to match the population benchmarks specified above. These weights are trimmed (typically at about the 1st and 99th percentiles) to reduce the loss in precision stemming from variance in the weights. Sampling errors and test of statistical significance take into account the effect of weighting.
A final adjustment was applied to the trimmed weights to ensure that turnout and the popular vote margin exactly matched the weighting benchmark.
The following table shows the unweighted sample sizes and the error attributable to sampling that would be expected at the 95% level of confidence for different groups in the survey.
Sample sizes and sampling errors for other subgroups are available upon request. In addition to sampling error, one should bear in mind that question wording and practical difficulties in conducting surveys can introduce error or bias into the findings of opinion polls.