Pew Research Center

FOR RELEASE OCTOBER 29, 2018

Elections in America: Concerns Over Security, Divisions Over Expanding Access to Voting

Views of voting access linked to opinion on diversity in the U.S.

FOR MEDIA OR OTHER INQUIRIES:

Communications Department
202.419.4372
www.pewresearch.org

RECOMMENDED CITATION

Pew Research Center, October 2018, "Elections in America: Concerns Over Security, Divisions Over Expanding Access to Voting"

About Pew Research Center

Pew Research Center is a nonpartisan, nonadvocacy fact tank that informs the public about the issues, attitudes and trends shaping the world. It does not take policy positions. The Center conducts public opinion polling, demographic research, computational social science research and other data-driven research. It studies politics and policy; news habits and media; the internet and technology; religion; race and ethnicity; international affairs; social, demographic and economic trends; science; research methodology and data science; and immigration and migration. Pew Research Center is a subsidiary of The Pew Charitable Trusts, its primary funder.

© Pew Research Center 2026

Table of contents

  • About Pew Research Center
  • Elections in America: Concerns Over Security, Divisions Over Expanding Access to Voting
  • 1. Confidence in accurate vote counts, election administration
  • 2. Election security
  • 3. The public’s voting values
  • 4. Views of election policy proposals
  • 5. Views of state election rules
  • 6. Impressions of voting in elections
  • 7. Concerns about eligible voters being prevented from voting and ineligible voters voting
  • Methodology
  • Appendix A: Categorization of states in this report

Elections in America: Concerns Over Security, Divisions Over Expanding Access to Voting

Views of voting access linked to opinion on diversity in the U.S.

With a week to go before Election Day, Americans are confident their local election authorities are up to the essential tasks of making sure that elections are run smoothly and that votes are counted accurately. Nearly nine-in-ten (89%) have confidence in poll workers in their community to do a good job, and majorities say the same about local and state election officials.

Yet the public expresses less confidence that elections across the United States will be handled as well as local ones. And Americans are deeply concerned about whether the midterms will be secure from foreign hacking.

Two years after Russia interfered with the 2016 presidential election, 67% of Americans say it is very or somewhat likely that either Russia or other foreign governments will try to influence the midterm elections.

Fewer than half (45%) are very or somewhat confident that election systems are secure from hacking, with just 8% saying they are very confident in the security of election systems nationwide.

A major new survey of public attitudes on voting and elections in the U.S. was conducted by Pew Research Center from Sept. 24-Oct. 7 among 10,683 adults, supported by a grant from the Democracy Fund. It finds that, despite concerns over election security, Americans have very positive feelings about voting: Fully 91% say voting in elections is “important,” while 68% say that “voting gives people like me some say about how government runs things.”

Far more Democrats than Republicans favor making it easy for all to vote

In addition, a substantial majority (80%) of adults say they expect it will be very or somewhat easy for them to vote in next week’s congressional elections, though just 38% anticipate the experience will be very easy.

These sentiments are notably bipartisan. For example, identical shares in both parties (69% each) say voting gives people a say in government. Yet there are deep partisan disagreements over other aspects of elections in this country, and many are centered on fundamental questions about the voting process.

Perhaps the most telling partisan divisions are on how easy voting should be in the United States. Overall, two-thirds of the public (67%) says “everything possible should be done to make it easy for every citizen to vote,” while only about a third (32%) say citizens “should have to prove they want to vote” by registering in advance.

More than eight-in-ten Democrats and Democratic-leaning independents (84%) say “everything possible should be done to make it easy for every citizen to vote.” By contrast, only about half of Republicans (48%) say this. A similar share of Republicans (51%) think people should have to prove they want to vote by registering ahead of time.

The Republicans’ skepticism about making it easier to vote – and expanding the franchise – is seen across multiple measures in the survey. A majority of Republicans (57%) say that if election rules were changed to make it easier to register and vote, this would result in elections being less secure. Among Democrats, fewer than half as many (22%) express this view; a sizable majority of Democrats (76%) say easing election rules would not make elections less secure.

Wide partisan gaps in views of automatic voter registration, removing inactive voters from the rolls

These differences also are reflected in how Republicans and Democrats view proposals for changing the way people register to vote and cast ballots. Nearly eight-in-ten Democrats favor allowing people to register to vote on Election Day at the polls and automatically registering all eligible citizens to vote (78% each). Among Republicans, only about half favor each of these proposals (49% each).

The partisan gap is nearly as wide in support for allowing people convicted of felonies to vote after serving their sentences (82% of Democrats favor this, compared with 55% of Republicans).

And while majorities in both parties favor using automatic methods to remove inaccurate and duplicate registrations from voter lists, Republicans are far more likely than Democrats to support removing people from voter lists if they have not recently voted or confirmed their registrations. About half of Republicans (53%) favor this, compared with 24% of Democrats.

As previous surveys have found, there is broad public support (76% favor) for requiring all voters to show a government-issued photo ID to vote; Republicans are much more supportive of this than are Democrats (91% vs. 63%), though majorities in both parties support a photo-ID requirement.

Some proposals for changing how voting is conducted do engender broad bipartisan backing, including automatically updating people’s voter registration when they move and requiring electronic voting machines to print a paper backup of the ballot.

And majorities in both parties favor the idea of making Election Day a national holiday, though Democrats are more likely than Republicans to favor this (71% of Democrats, 59% of Republicans).

Among the survey’s other major findings:

Support for making the voting process easier tied to views on diversity in U.S.

Opinions on easing the voting process are linked to views of country’s ethnic diversity. Among the roughly one-third of Republicans who say increasing racial and ethnic diversity is a good thing for the U.S., a 57% majority says everything possible should be done to make it easy for all citizens to vote. Among Republicans who view the nation’s increasing diversity negatively, or say it has no effect, fewer than half (43%) favor doing everything possible to make voting easy. A similar gap is evident among Democrats, though large majorities who take a positive view of growing racial and ethnic diversity (87%) – and those who do not (76%) – favor doing everything to make voting easy.

Only half of adults younger than 30 say voting in elections is ‘convenient’

Young people are less likely to say voting is ‘convenient.’ Young people have long been less likely than older adults to vote in elections, especially midterm elections. The new survey finds that young people are more skeptical than older adults about whether voting gives people a voice in government. In addition, young people are less likely to view voting as convenient. Just 50% of adults under 30 say voting is convenient – by far the lowest share of any age group.

More concern about eligible voters being prevented from voting than ineligible voters casting ballots. More people say it would be “major problem” if eligible voters are prevented from voting than if ineligible voters vote in an election. These differences hold across several hypothetical scenarios: 58% say it would be a major problem if even one voter (in an election of 1 million people) who meets all requirements is prevented from voting; 41% say it would be a major problem if one ineligible voter casts a ballot (again, in an election of 1 million).

Nearly a third say lower-income citizens in their state have less access to voting

State voting rules are seen as fair, but nearly a third say lower-income people have less access. An overwhelming majority of Americans (83%) say the election rules in their state are fair. Yet nearly one-in-five (17%) say black citizens in their state have less access to voting than whites, 27% say Hispanics have less access than whites and 30% say lower-income citizens have less access to voting than middle-income people.

Little confidence in tech companies to prevent election interference. A large majority of the public (76%) – including sizable shares in both parties – say technology companies like Facebook, Google and Twitter have a responsibility to prevent misuse of their platforms to influence the midterms. However, just a third (33%) say they are very or somewhat confident that the technology companies will achieve this objective; 66% say they are not too or not at all confident.

Broad partisan mistrust of the opposing party’s commitment to fair elections

Views of parties’ commitment to fair elections. While 62% of Americans say the Democratic Party is at least somewhat committed to fair and accurate elections, just 23% say it is very committed to this objective. A narrower majority (56%) says the Republican Party is very or somewhat committed to fair and accurate elections, with 20% saying the GOP is very committed.

In part, these views reflect deeply cynical views among members of both parties about the other party. Majorities of both Democrats (64%) and Republicans (56%) say the opposing party has little or no commitment to fair and accurate elections in the U.S.

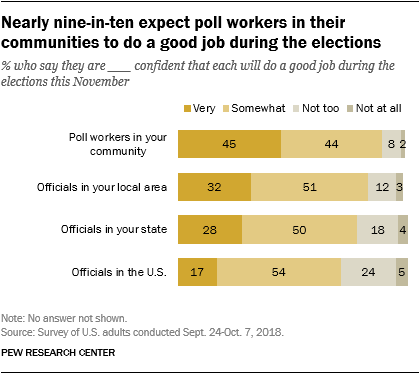
CORRECTION (Dec. 13, 2018): In the section “Racial differences in views of election administration,” the data for those who say they are confident in local officials and those who say they are confident in state-level officials were transposed. The section, including the chart “Nearly nine-in-ten expect workers in their communities to do a good job during the elections,” has been corrected to read that 32% are very confident in officials in their local area, 51% are somewhat confident, 12% are not too confident and 3% are not at all confident; 28% are very confident in officials in their state, 50% are somewhat confident, 18% are not too confident and 4% are not at all confident. The topline has been corrected as well.

1. Confidence in accurate vote counts, election administration

Most Americans say they are at least somewhat confident that in the elections this November, votes in their communities and across the United States will be counted as the voters intended. And there is broad confidence that elections – particularly those in their own communities – will be run and administered well.
However, the public is less confident in the security of the elections. A majority of Americans have little or no confidence election systems in the U.S. are secure from hacking and other threats.

Most have confidence votes will be counted accurately

More are ‘very confident’ of an accurate vote count locally than across the U.S.

About eight-in-ten Americans are either very (42%) or somewhat (40%) confident that the votes in their communities will be counted as voters intend this November. Fewer (72%) are very or somewhat confident that votes across the country will be counted accurately – with just 25% saying they are very confident about this.

The public also is largely confident that the congressional elections will be run and administered well. Nearly nine-in-ten expect elections in their communities to be run either very well (41%) or somewhat well (46%).

As with confidence in the vote count, public expectations for how elections across the country will be run are not quite as positive as local assessments. Still, about three-quarters of Americans (77%) expect the elections in the U.S. this November to be run at least somewhat well.
Republicans more confident than Democrats in accurate vote counts in their communities, the U.S.

Republicans express more confidence than Democrats that votes will be counted as voters intend this November, both in their own communities and in the country as a whole.

Nearly half of Republicans and Republican-leaning independents (48%) say they are very confident in vote counts in their communities, compared with 38% of Democrats and Democratic leaners who say this. There is a similar 9-percentage-point gap between the shares of Republicans (30%) and Democrats (21%) who say they are very confident in the nationwide counts. In both parties, more express confidence that votes will be counted as intended in their communities than say this about votes across the country.

Registered voters express significantly higher levels of confidence that vote counts will be accurate – at both the local and national levels – than adults who are not registered. There is a 22-percentage-point gap between the share of registered voters and unregistered adults who say they are at least somewhat confident votes will be counted correctly in their communities (88% and 66%, respectively). The gap in confidence in vote counts nationwide is similar: 76% of registered voters are very or somewhat confident votes will be counted as intended across the U.S., while 61% of unregistered adults say the same.

Though majorities of adults across age groups, education levels and racial backgrounds say they are at least somewhat confident that votes will be counted as intended both in their communities and across the U.S., there are some differences in the shares who say they are very confident votes will be counted as intended.

Fewer blacks and Hispanics than whites are ‘very confident’ in accurate vote count in their communities

Whites are more likely than Hispanics and blacks to say they are very confident ballots will be counted as cast in their community or across the country. Nearly half of whites (47%) say this about votes in their communities, compared with smaller shares of blacks (29%) and Hispanics (30%). The racial and ethnic gap in these views is somewhat less pronounced for votes across the U.S.

Older adults are more likely than younger adults to have high confidence in the vote count in their communities as well as the U.S. more broadly.

Those with higher levels of education are more likely than those with lower levels to say they are confident votes will be counted as intended, particularly in their communities. Nearly six-in-ten (57%) of those with postgraduate degrees are highly confident that votes will be counted in their community as voters intend; only about a third of those with a high school diploma or less education (34%) say the same.

Racial differences in views of election administration

There are similar patterns in opinions about how well next week’s elections will be administered.

Most expect the elections in their communities and in the U.S. will be run well – though about twice as many say their local elections will be run very well as say this about elections in the U.S. overall.
Older adults, whites more likely to say elections this November will be run and administered well

Nine-in-ten whites say the elections in their communities will be administered well, including 47% who say they will be run very well. Most blacks and Hispanics also say elections in their communities will be run well, but are far less likely than whites to say they will be run very well (30% of blacks and 27% of Hispanics).
There also are racial and ethnic differences in expectations of election administration in the U.S., with a wider majority of whites (80%) than blacks (73%) and Hispanics (70%) saying the elections across the country will be run at least somewhat well.

Majorities of Republicans and Democrats say elections will be run and administered at least somewhat well in their communities and in the U.S. overall. However, Republicans are somewhat more likely to say elections will be run and administered very well.

Americans generally are confident that election officials will do a good job during elections this November. And there is greater confidence at the local and state level than at the federal level.

Nearly nine-in-ten (89%) say they are at least somewhat confident community poll workers will do a good job, including 45% who say they are very confident. Only 10% say they are not too confident (8%) or not at all confident (2%) these officials will do a good job.

About eight-in-ten say they have at least some confidence in the officials who run elections in their local area (84%) or in their state (78%), including about three-in-ten who say they are very confident these officials will do a good job.

Roughly seven-in-ten (71%) are either somewhat confident (54%) or very confident (17%) that officials across the U.S. will do a good job running elections, although 29% say they are not too confident (24%) or not at all confident (5%) in this.

2. Election security

The public is not highly confident that election systems in the U.S. are secure from hacking and other technological threats. Currently, 45% of Americans say they are at least somewhat confident that U.S. election systems are secure, though just 8% say they are very confident in the security of these systems and 55% say they are not too (37%) or not at all (17%) confident that these systems are secure.

Public has more confidence in security of their state’s election systems than in those around the country_new

Americans express more confidence about election systems in their state: Two-thirds (66%) say they are very or somewhat confident that election systems in their state are secure from hacking and other technological threats (though just 16% say they are very confident). A third (33%) of adults are not too or not at all confident in the security of their state.

At the federal level, most do express confidence that efforts are being made to protect election systems: 55% say they are at least somewhat confident that the federal government is making serious efforts to protect election systems from hacking and other technological threats.

And 63% say they are very or somewhat confident that their state government is making serious efforts to protect election systems – roughly the same share as expresses confidence that their state’s systems are currently secure.

Republicans express greater confidence in the security of election systems than Democrats

In general, Republicans express greater confidence than Democrats in the security of election systems and in the seriousness with which government officials are treating the threat of hacking and other technological threats. This is especially true at the national level: Republicans and Republican leaners are 25 percentage points more likely than Democrats and Democratic leaners to say they are very or somewhat confident that election systems in the U.S. are secure (59% vs. 34%), and they are 29 percentage points more likely to say that the federal government is making serious efforts to protect these systems (72% vs. 43%).

The overall gap between Republicans and Democrats is somewhat smaller at the state level. Three-quarters (75%) of Republicans say they are at least somewhat confident that election systems in their state are secure, compared with 60% of Democrats who say this. The partisan gap is nearly identical when it comes to Americans’ views of the efforts their state is taking to protect election systems.

There is little overall difference in levels of public confidence in the security of state election systems between states where the governor and chambers of the state legislature are controlled by Republicans, Democrats or where control is shared between the two parties. However, the confidence that partisans express in state government does vary with partisan control of state government.

Democrats in Republican-controlled states are least confident in election security measures

For example, 79% of Republicans living in Republican-controlled states say they are very or somewhat confident in the security of their state’s election systems. But among Republicans in states under Democratic control, a smaller majority (69%) express confidence that their state’s election systems are secure. (See appendix for details on state party control classification.)

The Democratic difference is similar: In Democratic-controlled states, 67% of Democrats are at least somewhat confident in the security of their state’s election systems. This drops to 55% among Democrats in GOP- controlled states.

The resulting partisan gap in confidence is much wider in GOP-controlled states than in Democratic-controlled states. In Republican-controlled states, Republicans are 24 percentage points more likely than Democrats to say they are at least somewhat confident election systems are secure from hacking (79% vs. 55%), while there is virtually no partisan difference in these views in states with a Democratic governor and Democratic control of the state legislature (69% of Republicans and 67% of Democrats express confidence).

The pattern is similar when it comes to confidence that state governments are making serious efforts to protect election systems from hacking and other technological threats: In GOP-controlled states, Republicans are 25 percentage points more likely than Democrats to they say they are at least somewhat confident their state government is making serious efforts to protect these systems. Democrats are 8 percentage points more likely than Republicans to say this in Democratic-controlled states.

Wide partisan gap in views about foreign attempts to influence midterm

Most expect foreign governments will try to influence the 2018 election

Two-thirds (67%) of the public says that it is very or somewhat likely that Russia or other foreign governments will attempt to influence the U.S. congressional elections in November. Among those who say it is at least somewhat likely, 71% view attempts by foreign governments to influence the elections as a major problem. And there are large partisan divides in both the perceptions of the likelihood of foreign interference and the extent to which this is viewed as a major problem.

Eight-in-ten Democrats and Democratic leaners say that it is at least somewhat likely that Russia or other foreign governments will attempt to influence the midterms, including 43% who say this is very likely. By comparison, 53% of Republicans say this is at least somewhat likely, and just 20% say it is very likely.

Among those who see election influence as ‘likely,’ wide partisan gap in concern

Among those who expect that Russia or other governments will attempt to influence the election, Democrats are more likely than Republicans to say this is a major problem (83% compared with 47%).

There is a strong relationship between people’s assessments of the likelihood of foreign interference and the degree to which they say that this interference is a problem: 87% of those who say it is very likely that foreign governments will attempt to influence the election also say that these attempts are a major problem, compared with 56% who say this is only somewhat likely.

Even among those who say it is very likely that foreign governments will attempt to influence the midterms, there is a sizable partisan gap in the share who say this is a major problem. More than nine-in-ten Democrats (94%) who say foreign governments are very likely to try to influence the midterms describe these attempts as a major problem. By contrast, among Republicans who think attempted foreign influence is very likely, 67% say it is a major problem.

Most say technology companies have responsibility to prevent the misuse of their platforms to influence the election

Few are confident tech companies will prevent ‘misuse’ of platforms in election

About three-quarters of the public (76%) say that technology companies like Facebook, Twitter and Google have a responsibility to prevent the misuse of their platforms to influence the U.S. elections in November. However, Americans express little confidence that these companies will do so.

Wide majorities of both Republicans and Democrats say technology companies have a responsibility to prevent misuse of their platforms to influence the 2018 elections: 72% of Republicans and Republican leaners and 80% of Democrats and Democratic leaners say this.

Both Republicans and Democrats have doubts that these companies will be able to prevent the misuse of their platforms. Just a third of the public (33%), including 27% of Republicans and 37% of Democrats, say they are at least somewhat confident in these technologies to prevent the misuse of their platforms.

3. The public’s voting values

In broad terms, the public backs doing more to make it easy to vote in the U.S. And most do not believe that making it easier to vote necessarily compromises election security. But while the public favors making it easier to vote, there is little support for the idea that voting in the U.S. should be mandatory.

As with many policy attitudes, there are stark partisan gaps in views on voting. Republicans are divided on whether steps should be taken to make voting easier, and a majority thinks any changes toward making it more accessible would make elections less secure. Democrats overwhelmingly say voting should be made easier and do not think this would jeopardize election security.

Voting attitudes also are independently tied to views of the country’s growing racial and ethnic diversity. In both partisan groups, those with neutral or negative views of the country’s changing makeup are significantly less likely to favor taking steps to make it easier to vote than those who take a positive view of growing diversity in the U.S.

Public supports making early, absentee voting broadly available to voters

Most say ‘everything possible’ should be done to make it easy for all to vote

Overall, two-thirds (67%) say that everything possible should be done to make it easy for every citizen to vote, while fewer (32%) say citizens should have to prove they really want to vote by registering ahead of time.

Consistent with the public’s broad support for making it easy to vote, most Americans say all voters should be able to vote early or absentee: About seven-in-ten (71%) say that “any voter should have the option to vote early or absentee without having to document a reason;” 28% say that “a voter should only be allowed to vote early or absentee if they have a documented reason for not voting in person on Election Day.”

There are wide partisan differences in attitudes about making it easier to vote. Among Democrats and Democratic-leaning independents, an overwhelming majority (84%) say that everything possible should be done to make it easy to vote. By contrast, Republicans and Republican leaners are divided: 48% say steps should be taken to make it easy for every citizen to vote, compared with 51% who say citizens should have to prove they really want to vote by registering ahead of time.

Democrats also are more likely than Republicans to support making access to early and absentee voting universally available: 83% of Democrats favor this, compared with 57% of Republicans.

While the public supports steps to make voting easier, there is little support in either party for making voting mandatory. Among the public overall, 79% say citizens should be able to decide for themselves whether or not to vote in national elections; just 21% support requiring all citizens to vote. Majorities of both Republicans (88%) and Democrats (71%) oppose the idea of mandatory voting.

Is there a trade-off between election security and ease of voting?

Most do not think making it easier to vote would make elections less secure

When it comes to the ease of voting and election security, the public does not see an inherent trade-off between the two. Six-in-ten say that it would not make elections any less secure if rules were changed to make it easier to register and vote; 37% say that changing the rules to make it easier to register and vote would also make elections less secure.

There is a wide partisan divide on this question. By 57% to 41%, Republicans and Republican leaners think that making it easier to register and vote would lead to less secure elections. By contrast, 76% of Democrats and Democratic leaners say that it would not make elections any less secure if rules were changed to make it easier to register and vote.

Within the GOP, most conservative Republicans (64%) think that changes to make voting easier would lead to less secure elections. By comparison, moderate and liberal Republicans are divided: About as many say making it easier to vote would lead to less secure elections (48%) as say it would not (50%). Among Democrats and Democratic leaners there is a more modest ideological difference: 82% of liberals and 70% of conservatives and moderates do not think making it easier to vote would lead to less secure elections.

Older, more educated are more likely to see voting as having an impact

Younger adults less likely to see voting as affecting how government is run

Most Americans view voting as a way to have some influence over government. Nearly seven-in-ten (68%) say that “voting gives people like me some say about how the government runs things”; 31% say that “voting by people like me doesn’t really affect how government runs things.”

Majorities across most groups hold the view that voting gives them a voice in government, but there are differences in how widely this view is held.

The youngest adults (those ages 18 to 29) are the least likely to believe voting gives them some say in government (58%). Larger shares of those 30 to 49 (66%), 50 to 64 (72%) and 65 and older (76%) hold this view.

There also are significant differences in views by level of education. Adults with greater educational attainment are more likely than those with less education to say voting gives them some say over how government is run. For example, 81% of postgraduates say this compared with 60% of those with no more than a high school diploma.

Support for making voting easier linked to demographics, positive views of diversity

Blacks more likely than whites to favor taking action to make it easy to vote

Aside from partisanship, race and age are factors in views of whether “everything possible” should be done to make it easy to vote.

Blacks (81%) are more likely than Hispanics (69%) and whites (63%) to say that everything possible should be done to make it easy for every citizen to vote.

Young adults – who are among the least likely to say they feel their vote matters – express some of the strongest support for making voting easier. About three-quarters (76%) of those 18 to 29 say that everything possible should be done to make it easy for every citizen to vote. This compares with smaller majorities in older age groups.

And support for making it easier to vote is greater among those with higher levels of educational attainment than those with lower levels.

Among partisans, there is a significant ideological divide within the Republican Party, but little difference within the Democratic Party.

A majority of conservative Republicans (63%) say that citizens should have to prove they really want to vote by registering ahead of time. By contrast, most moderate and liberal Republicans (65%) say everything should be done to make voting easier. Among Democrats, large majorities of both liberals (89%) and conservatives and moderates (80%) support taking steps to make voting easier.

In addition, there is little difference in Democrats’ views across age or race and ethnicity. For instance, 88% of white Democrats, 83% of black Democrats and 73% of Hispanic Democrats say everything possible should be done to make voting easy. Among Republicans, nonwhites are more likely than whites to say this (66% vs. 44%).

Support for making the voting process easier tied to views on diversity in U.S.

Views about how easy it should be to vote are linked to attitudes about racial and ethnic diversity in the country. Those who see growing diversity as a good thing for society are more likely than those who see it as a bad thing, or say it doesn’t make much difference, to say everything should be done to make it easy to vote. And these differences are seen within both parties.

Overall, 78% of those who say greater diversity is good for society think everything possible should be done to make it easy to vote. Far smaller majorities of those who think greater diversity is a bad thing (55%) or makes no difference (53%) for society favor taking steps to make it easy to vote.

Among Republicans, a 57% majority of those who view greater diversity as a good thing say that everything possible should be done to make it easy to vote. By contrast, majorities of Republicans who view greater diversity as a bad thing (57%), or say it doesn’t make much difference (55%) say that citizens should have to prove they want to vote by registering ahead of time.

Most Democrats (71%) view greater diversity in the country as a good thing; 87% of those in this group say that everything possible should be done to make it easy to vote. This is also the dominant view among other Democrats, though smaller majorities of those who view growing diversity as a bad thing (79%) or say it makes no difference (73%) think everything possible should be done to make it easy to vote.

Views of early and absentee voting in states with differing voting laws

Support for early and absentee voting without a documented reason is greater in states that make voting more accessible than in states that do not.

Republicans in states with stricter voter laws oppose ‘no-excuse’ early voting

Three-quarters of those in the 37 states (and the District of Columbia) that have early voting, no excuse absentee voting, or voting by mail say that any voter should have the option to vote early or absentee without having to document a reason. This compares with 60% of those living in the 13 states with less accessible voting laws. (See appendix for details on state classification.)

Roughly six-in-ten Republicans in states that do not make early, absentee or mail voting widely available (59%) say that a voter should only be allowed to vote early or absentee if they have a documented reason for not voting in person on Election Day; just 41% say any voter should have the option to vote early or absentee without having to document a reason.

The balance of opinion is reversed among Republicans in states that make non-Election Day voting more accessible: 62% favor early and absentee voting with no excuse required, while just 37% say only those with a documented reason should be allowed to vote early.

An overwhelming majority of Democrats (83%) think early voting should be available to any voter for any reason. This view is somewhat more widespread among Democrats who live in states with more accessible laws (where 86% say this) than among those living in states with less accessible laws (75%).

4. Views of election policy proposals

Several proposals related to voting policy draw majority support from the public. Still, only a handful – including automatically updating the voter registrations of people when they move and paper backups of electronic ballots – draw widespread support from both Republicans and Democrats. Others are favored more by one partisan group than the other.

An overwhelming share of Americans (87%) say they would favor automatically updating voter registrations when people move, including 58% who say they strongly favor this idea. And there is nearly as much support among the public for requiring electronic voting machines to print paper backup ballots: 85% favor this, including 49% who do so strongly.

About three-quarters favor removing inaccurate and duplicate registrations from voter lists using automatic methods (77%) and requiring all voters to show government-issued photo ID to vote (76%).

And roughly two-thirds of Americans favor allowing those convicted of felonies to vote after they have served their sentences (69%), making Election Day a national holiday (65%), automatically registering all citizens to vote (65%) and allowing Election Day registration (64%).

The public broadly rejects two of the 10 policies included in the survey: 62% oppose removing people from registration lists if they have not recently voted or confirmed their registration, and a similar share (65%) opposes conducting all elections by mail.

Partisan gaps over many voting policy proposals

More than eight-in-ten of those in both party coalitions favor automatically updating voter registrations when people move (84% of Republicans and Republican leaners, 90% of Democrats and Democratic leaners) and paper backup ballots for electronic voting machines (84% and 87%, respectively). But there are notable partisan gaps when it comes to some other election-related proposals.

Democrats more likely to back automatic and same-day registration; support for voter ID higher in GOP

Roughly eight-in-ten Democrats favor Election Day registration (78%) and automatic voter registration (78%). By contrast, Republicans are divided on these policies – 49% favor each of them.

Democrats are also far more likely than Republicans to favor allowing convicted felons to vote after they have served their sentences: Fully 82% of Democrats favor this, compared with a smaller majority of Republicans (55%).

Similarly, while majorities in both parties would support making Election Day a national holiday, Democrats (71%) are 12 percentage points more likely to say this than Republicans (59%).

And although about nine-in-ten Republicans (91%) favor requiring a photo ID to vote, a smaller 63% majority of Democrats favor this policy.

Republicans are more likely than Democrats to favor two policies related to removing names from voter lists: “removing inaccurate and duplicate registrations from voter lists using automatic methods” (15-percentage-point partisan gap) and “removing people from registration lists if they have not recently voted or confirmed their registration” (19-point gap).

Both overall and within the parties, these two proposals are viewed very differently from one another.

Support for removing inaccurate – but not inactive – voter registrations

About three-quarters of Americans (77%) say they favor removing inaccurate and duplicate registrations using automatic methods. At the same time, about two-thirds of Americans (62%) oppose removing people from registration lists if they have not voted recently or confirmed their registration.

And while Republicans and Republican-leaning independents are 15 points more likely than Democrats and Democratic leaners to favor the automatic removal of duplicate or inaccurate registrations, large majorities of both parties are in favor of this (85% and 70%, respectively).

When it comes to proposals to remove those who haven’t voted recently from registration lists, Republicans are divided (53% favor removing inactive voters, 47% oppose this), while 75% of Democrats are opposed to taking voters off the rolls if they have not voted recently or confirmed their registration.

Wide age gaps in GOP over same-day registration, Election Day holiday

Older Republicans much less favorable than younger Republicans toward same-day registration

When it comes to some policies related to making voting easier – automatic voter registration, same-day registration and making Election Day a national holiday – there is generally more support among younger people than older people, and these age differences are much more pronounced among Republicans than Democrats.

For instance, while 76% of Republicans ages 18 to 34 would favor allowing voter registration at the polls on Election Day, support for same-day registration falls to just 22% among Republicans 65 and older.

Similarly, although 74% of Republicans under 35 and 68% of those 35 to 49 favor making Election Day a national holiday, just 43% of those 65 and older say the same.

Republicans under 35 also are 19 points more likely than those 65 and older to favor automatic voter registration (58% vs. 39%). These age gaps are seen both among those identifying as Republican and those who lean to the GOP.

By comparison, there are only modest differences in these views across Democratic age groups, with clear majorities of those in all age groups favoring all three of these policies.

In contrast, views on a photo identification requirement differ little across age groups in either party. Across age groups, roughly nine-in-ten or more Republicans favor requiring voters to show photo identification, while about six-in-ten Democrats say this.

GOP opposition to Election Day registration higher in states without it

Partisans in same-day states more likely to support Election Day registrations

Most people (72%) who live in the 15 states, plus the District of Columbia, that allow people to register to vote on Election Day favor allowing Election Day registration. While Democrats in these states (83%) are more likely than Republicans (60%) to favor same-day registration, clear majorities in both parties back this policy. (This group of states includes North Dakota, which does not require voters to register.)

A smaller overall majority of those in states without Election Day registration (61%) favor allowing people to register on the day they vote. And the partisan divide in these states is much starker: On balance, Republicans in these states are more likely to oppose (55%) than favor (45%) same-day voter registration. Among Democrats in these states, about three-quarters (77%) support same-day registration.

Democrats support voter photo ID, but divided by ideology and education

Postgraduate and liberal Democrats divided on voter photo ID requirement

Within the Democratic Party, 63% favor requiring voters to show government-issued photo identification to vote, while 37% oppose such a requirement.

Democratic support for a photo identification requirement varies by education: Those with postgraduate degrees are the only educational group in which a majority does not back this proposal (instead, this group is roughly divided: 47% favor, 53% oppose).

Among those with a bachelor’s degree, 59% favor this requirement, and about two-thirds of those with some college experience (67%) and a high school diploma or less (69%) say they would favor requiring all voters to show photo identification to vote.

Liberal Democrats are also divided in their attitudes toward requiring photo ID (50% favor, 50% oppose). In contrast, 75% of conservative and moderate Democrats would favor an ID requirement and 25% would be opposed.

Democrats living in states that already have some type of voter identification requirement are more supportive of requiring voters to show government-issued photo ID to vote than those living in states with no such requirement. A clear majority of Democrats living in states with a voter identification requirement (70%) support requiring voters to show identification in order to vote. Democrats living in states with no requirement are divided in their attitudes (53% favor, 46% oppose).

There are no significant differences in opinions on this proposal by age among Democrats.

5. Views of state election rules

Overall, most Americans view the election rules in their state as fair, and a majority say the rules make registering and voting neither too hard nor too easy.

There are partisan and demographic differences in assessments of state election rules. And these differences are especially large in opinions about whether blacks, Hispanics and lower-income citizens have equal access to voting in their state.

General assessments of state election rules

Most Americans say their state’s election rules are fair

A sizable majority of the public (83%) says election rules in their state are fair; only 15% say the rules are not fair.

Majorities of white (88%), black (74%) and Hispanic adults (69%) say elections are fair where they live. But more blacks and Hispanics than whites say election rules are not fair: 25% of blacks, and a similar share of Hispanics (27%), say election rules in their state are not fair; about one-in-ten white adults (11%) say the same.

Republicans and Democrats broadly agree that election rules in their state are fair. Yet a larger minority of Democrats and Democratic-leaning independents (20%) than Republicans and Republican leaners (10%) say the election rules in their state are not fair.

Too easy or too hard to vote?

Majority views election rules in their state as ‘about right’

A wide majority of Americans say election rules make registering and voting in their state neither too easy nor too hard: 69% say the rules are “about right,” compared with 19% who say it is too easy and 10% who say it is too hard.

Across demographic groups, majorities say the election rules in their state do not make it too hard – or too easy – to register and vote. Comparable shares of whites (70%), blacks (68%) and Hispanics (69%) say the rules are about right in their state.

Broad majorities in all age groups say voting is neither too easy nor too hard. However, adults ages 50 and older are more likely than those younger than 50 to say it is too “easy” (24% vs. 14%).

Partisan differences in views of state election rules

Reps in more-accessible voting states more likely to say voting is ‘too easy’

Nearly identical shares of Republicans (70%) and Democrats (71%) view the election rules in their state as “about right.” But Democrats are more likely than Republicans to say the rules in their state make it too hard to register and vote (16% vs. 4%), and Republicans are more likely to view them as too easy (26% say this, along with just 12% of Democrats).

Republicans in states with election laws that make voting more accessible – by allowing absentee voting without an excuse, early voting or voting by mail – are more likely than Republicans in states with less accessible rules to say voting is too easy. About three-in-ten Republicans in states with more accessible voting (28%) say it is too easy to vote versus about two-in-ten in less accessible states (18%).

Democrats’ views of their state’s election rules, by contrast, do not differ in states with more or less accessible voting rules. (See appendix for details on state classification.)

Race, ethnicity, income and access to voting

Most say minorities, lower-income citizens have equal access to voting

Asked about whether racial and ethnic minorities have the same access to voting as white citizens in their state, most Americans say that black citizens (80%) and Hispanic citizens (69%) have equal access.

About a quarter (27%) say Hispanic citizens have less access to voting than white citizens. And 17% say black citizens have less access than whites.

Three-in-ten Americans say lower-income citizens have less access to voting than middle-income citizens, while two-thirds (67%) say lower-income and middle-income citizens have equal access.

Democrats are far more likely than Republicans to say blacks, Hispanics and lower-income citizens lack equal access to voting. Slightly more than half of Democrats (54%) say Hispanics and whites have equal access to voting in their state; a comparable share of Democrats (52%) say lower- and middle-income citizens have equal access to voting. Overwhelming shares of Republicans say both groups have equal access to voting in their state (89% Hispanics, 87% lower-income citizens).

More Democrats say blacks have equal access to voting with whites (69%) than say this about Hispanics (54%). Still, a much larger share of Republicans (93%) say black and white citizens in their state have equal access to voting.

There are sizable educational differences among Democrats in views of whether minorities and lower-income citizens lack equal access to voting. Democrats with a four-year degree or postgraduate degree are less likely than those with less education to say that blacks, Hispanics and lower-income citizens have equal access to voting in their state. There are no significant educational differences among Republicans in these views.

Democrats, especially college-educated Democrats, are less likely than Republicans to say blacks, Hispanics and lower-income citizens have equal access to voting

Whites are generally more likely than blacks or Hispanics to say there is equal ballot access for racial and ethnic minorities in their state.

Blacks less likely than whites to say groups have equal voting access

Roughly eight-in-ten whites (83%) and Hispanics (78%) say black citizens and white citizens have equal access to voting. By comparison, 69% of blacks say the same.

And while 75% of whites say Hispanic citizens have the same access to voting as whites, a smaller majority of Hispanics (64%) and only about half of blacks (52%) agree.

There are similar gaps in views about lower-income citizens access to voting. While about seven-in-ten whites (71%) say lower-income citizens and middle-income citizens have equal access to voting, 63% of Hispanics and 55% of blacks say this.

While a majority of blacks say blacks and whites have equal voting access in their state, their opinions differ by education: 72% of blacks who have not completed college say blacks and whites have equal access, compared with 55% of black college graduates. There is a similar 17-percentage-point education gap among whites: 89% of those who have not completed college, compared with 72% of those with a college degree, say blacks and whites have equal voting access.

While there also are educational differences among whites in views of access to voting for Hispanic and lower-income citizens, there are no significant educational differences among blacks or Hispanics in these views.

Among both blacks and whites, college graduates are more likely than those with less education to say blacks in their state lack equal access to voting

Fairness of election rules and congressional districting

Most say state election rules do not favor one party, but fewer say this about congressional district boundaries

A quarter of Americans say the election rules in their state unfairly favor either the Republican Party (14%) or the Democratic Party (11%). Nearly three-quarters of Americans (73%) say that election rules do not favor one party over the other.

Among those living in states with more than one congressional district, nearly four-in-ten (37%) say the way congressional districts are drawn in their state unfairly favors one party over the other: 22% say it unfairly favors the GOP, while 15% say the Democratic Party. Still, 58% of adults in these states say congressional districts are drawn in a way that doesn’t favor one party over the other.

More Democrats than Republicans say congressional districts in their state unfairly favor the other party

Comparable shares of Democrats (21%) and Republicans (17%) say their state’s election rules unfairly favor the opposing party.

But in multi-district states, Democrats (36%) are more likely than Republicans (25%) to say that the way congressional districts are drawn unfairly favors the other party.

Republicans’ and Democrats’ views of fairness regarding election rules and the way congressional districts are drawn vary widely based on whether or not their party has control of the state government.

Partisans in states controlled by other party more critical of election rules

About four-in-ten Republicans living in Democratic-controlled states (37%) say election rules unfairly favor the Democratic Party, while 22% of Republicans in states with divided governments say this. Just 7% of Republicans in GOP-controlled states say the rules favor the Democratic Party in their state.

There is a parallel pattern of opinion among Democrats. While 29% of those in states with unified Republican Party control of government say the rules unfairly favor the GOP, that drops to 21% in states with divided control and just 8% in states controlled by the Democratic Party.

When it comes to the way congressional districts are drawn in the states with multiple districts, nearly half of Democrats living in GOP-controlled states (48%) say district boundaries unfairly favor Republicans; 31% say this in states with divided control, while 20% say this in states under unified Democratic Party control.

Again, there is a similar pattern among Republicans: 43% of those living in Democratic-controlled states with two or more representatives in Congress say district lines favor the Democratic Party, this drops to 34% among those in states with divided control and just 14% in states under GOP control.

6. Impressions of voting in elections

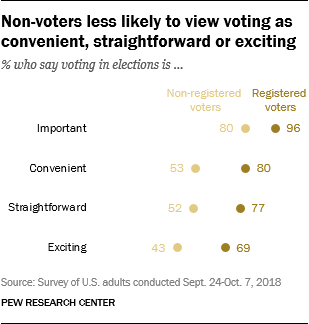
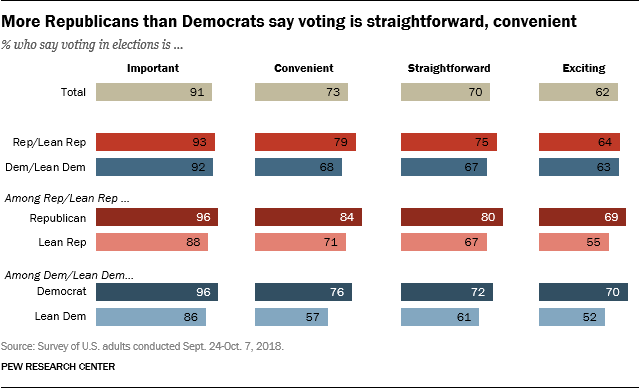
Voting is widely viewed by the public as important: 91% say this, while just 8% say it is not. Although most also view it as convenient (73%), straightforward (70%) and exciting (62%), these evaluations are less universally held, and there are sizeable partisan, age and educational differences in these views.

Registered voters offer much more positive evaluations of voting than those who are not registered. While eight-in-ten of those who are not registered say voting is important, nearly all registered voters say this (96%).

Non-voters less likely to view voting as convenient, straightforward or exciting

And only about half of those who are not registered describe voting in elections as “convenient” (53%) or “straightforward” (52%), while these views are held by much larger majorities of those who are currently registered.

On balance, those who are not registered are more likely to view voting as boring (56%) than exciting (43%). Among registered voters, about seven-in-ten (69%) say that voting in elections is exciting, compared with just 29% who say that it is boring.

There are no significant partisan differences in views of voting’s importance (93% of Republicans and Republican leaners and 92% of Democrats and Democratic leaners say it is important) or in the shares saying voting is exciting – just over six-in-ten in both partisan groups say that it is.

But Democrats and Democratic leaners are less likely than those who affiliate with or lean to the GOP to say voting is convenient (68% vs. 79%) or that it is straightforward (67% vs. 75%).

In both partisan groups, those who affiliate with a party are more likely than those who lean toward a party to describe voting in elections with any of these four positive terms. For instance, 84% of Republicans say voting is convenient, compared with 71% of Republican leaners; the gap between Democrats and Democratic leaners is similar (76% vs. 57%).

More Republicans than Democrats say voting is straightforward, convenient

Impressions of voting also vary across age and educational groups.

Younger adults are much less likely than older people to view voting as convenient: While 90% of those 65 and older say voting in elections is convenient, just half of 18- to 29-year-olds say this.

Wide age gap over whether voting is convenient, exciting

Similarly, voting is viewed as exciting by 77% of those 65 and older, compared with just 49% of those 18 to 29. Though age differences are less pronounced over whether voting is straightforward or confusing and whether it is important or not important, there also are age gaps in these views.

Education is also associated with many of these views. For instance, while 79% of those with postgraduate degrees and 75% of those with bachelor’s degrees say voting is straightforward, a narrower majority (63%) of those with no college experience say the same. And while just 56% of those with a high school degree or less education characterize voting as exciting, this rises to 73% among those with postgraduate degrees. There are no significant educational differences in perceptions of the convenience of voting.

Most say voting will be easy for them personally

Most expect voting in the 2018 midterms will be ‘easy’

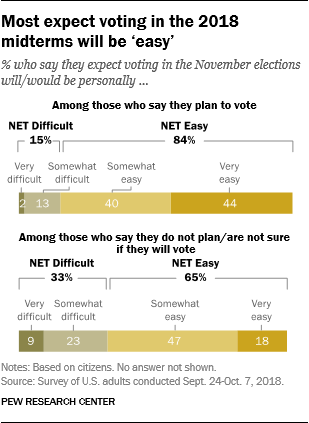
Among those who say they plan to vote in the November election, 84% expect that voting will be personally easy for them, including 44% who say it will be very easy; 15% say that it will be at least somewhat difficult.

Voting is also viewed as personally easy by about two-thirds (65%) of those who are eligible to vote but say they do not plan to do so or are not sure if they will vote. However, a third of those in this group say voting would be difficult.

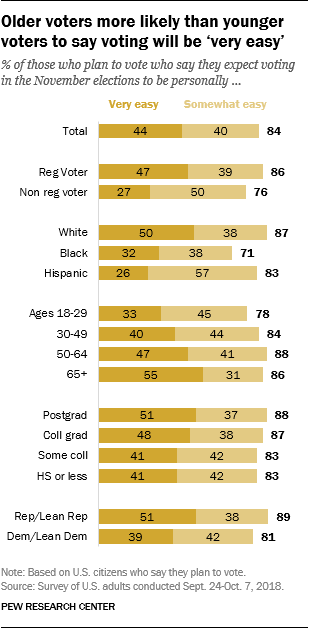
While most of those who plan to vote expect voting will be easy, younger people, non-whites, and those without a college degree are less likely than others to say this.

Older voters more likely than younger voters to say voting will be ‘very easy’

Nearly nine-in-ten whites who plan to vote (87%) say they expect voting will be easy, including half (50%) who say it will be very easy. In contrast, a smaller majority (71%) of black voters say it will be easy for them personally, and just 32% say it will be very easy. Among Hispanic voters, 83% expect voting to be at least somewhat easy, though just 26% say it will be very easy.

And while about three-quarters or more of voters across all age groups expect voting in this election will be easy, the share saying voting will be very easy increases substantially with age – just 33% of those younger than 30 who plan to vote say this, compared with a majority (55%) of those 65 and older.

Voters without a college degree are slightly less likely than those with a bachelor’s degree or more education to expect voting will be easy (87% vs. 83%).

Republicans also are somewhat more likely than Democrats to say they expect voting to be very easy; 89% of Republicans say it will be at least somewhat easy, compared with 81% of Democrats who say this, and there is a 12-point difference in the shares saying it will be very easy for them to vote this fall (51% vs. 39%).

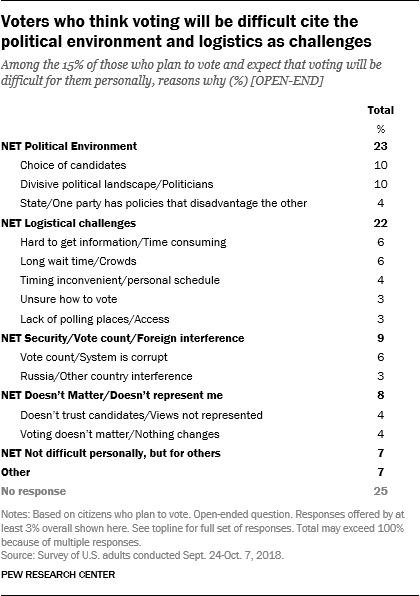
Those who expect voting to be difficult cite a variety of reasons

Voters who think voting will be difficult cite the political environment and logistics as challenges

When the small share of voters (15%) who say they expect voting to be difficult this year are asked in an open-ended format why they say this, 23% mention elements of the political environment, including the choice of candidates (10%) or the divisive political climate (10%).

Roughly two-in-ten (22%) mention logistical concerns, ranging from inconvenient timing, to wait times at the polls and uncertainty of how or where to vote or get information.

About one-in-ten (9%) cite concerns about security or interference from foreign actors; 8% say it will be difficult to vote because they are not represented or because they think voting doesn’t matter.

7. Concerns about eligible voters being prevented from voting and ineligible voters voting

Americans are generally concerned over the potential for eligible voters being denied the opportunity to vote and those ineligible to vote being able to cast ballots.

But more say they would consider a situation of eligible voters not being allowed to vote a major problem than say that about a situation in which ineligible voters cast ballots.

58% say even one eligible voter being prevented from voting would be a ‘major problem’

Nearly six-in-ten Americans (58%) say that they would consider it to be a major problem with the election if even one eligible voter was prevented from casting a ballot in an election with one million voters. About a quarter (26%) would consider this a minor problem, while just 15% say that this would not be much of a problem with the election.

Among those presented a different scenario in which one ineligible voter voted in an election with one million voters, 41% say they view this as a major problem, while another 30% say it would be a minor problem. Nearly three-in-ten (28%) say this would not be much of problem, nearly double the share saying this about an eligible voter being denied the opportunity to vote.

When asked about cases in which the number of eligible people prevented from voting is higher, larger shares say this would be a major problem with the election. Similarly, as the share of ineligible voters casting ballots in the scenario increases, Americans are more likely to view this as a major problem. The survey asked these questions in a variety of different ways, with each respondent receiving one version of the question (see sidebar for details of this survey experiment).

For example, while 58% say it would be a major problem if one voter in a million was prevented from voting, 66% of Americans would see it as a major problem when asked about 100 people out of a million, and more than eight-in-ten say it would be major problem if 1,000 people (83%) or 10,000 people (86%) were prevented from voting in a place with one million voters.

Similarly, while 41% say it would be a major problem if one ineligible person in a place with one million voters cast a ballot, that rises to 52% when asked about 100 ineligible voters, 62% when asked about 1,000 and 69% would see a major problem with the election if 10,000 ineligible voters cast ballots (1% of the total one million voters).

Concern about eligible voters being prevented from voting and ineligible voters casting ballots rises as the numbers affected increase
Overview of survey experiment
A survey experiment: Views about eligible voters prevented from casting ballots, ineligible voters casting ballots

Wide partisan divide in concerns over voting by ineligible voters

Democrats and Republicans respond very differently to scenarios involving ineligible voters casting ballots and eligible voters being prevented from casting ballots.

Overall, Democrats and Democratic leaners are more likely than Republicans and Republican leaners to say it would be a major problem if an eligible voter was prevented from voting even if they tried to vote and met eligibility requirements. In the case of a single voter of one million being prevented from casting a ballot, 63% of Democrats and 52% of Republicans say they would consider this to be a major problem.

As the number of people affected in the scenario rises, the shares viewing this as a major problem rise in both parties. But the partisan gap remains about 10 percentage points: For example, while 81% of Republicans say it would be a major problem if 10,000 eligible voters out of a million were prevented from casting a ballot, an even higher share of Democrats (91%) say this.

Republicans more likely than Democrats to view voting by those ineligible as a ‘major problem’; smaller gap in views of eligible voters being prevented from voting

The partisan gap is considerably wider in views about whether ineligible voters casting ballots would be a major problem. In this case, Republicans are far more likely than Democrats to say it would be: 57% of Republicans say they would consider it to be a major problem with an election if one ineligible voter cast a ballot in a place with one million voters, only about half as many Democrats (29%) say this would be a major problem.

And while the share considering this to be a major problem rises as the number of individuals in the scenario rises in both parties, the partisan gap also remains. While 59% of Democrats say it would be a major problem if 10,000 ineligible voters cast ballots in a place with one million voters, 82% of Republicans say this.

In a study earlier this year, there also were partisan differences in perceptions of whether ineligible voters are being permitted to vote and whether eligible voters are being prevent from voting (see “The Public, the Political System and American Democracy”). Democrats were far more likely than Republicans to say “no ineligible voters are permitted to vote” described U.S. elections very or somewhat well; Democrats were less likely than Republicans to say “no eligible voters are prevented from voting” described elections in this country very or somewhat well.

In views about ineligible voters casting ballots, the total number appears to matter more than the proportion of the electorate

Similar shares express concern about an ineligible voter voting, whether the base is 1 million or 100,000

A random subset of survey respondents was asked about an election in a place with 100,000 voters rather than one million.

The share saying it would be a major problem if someone voted in an election even though they were not eligible to do so is more consistent across conditions with the same number of ineligible voters than across conditions with the same proportion of ineligible votes cast.

For example, 44% say it would be a major problem if there were 10 ineligible votes cast in an election of one million voters – equivalent to 0.001% of votes cast. The same number of ineligible votes in an election of 100,000 voters would represent a larger proportion of votes cast (0.01%), but the share saying this would be a major problem is roughly the same (42%).

One hundred ineligible voters out of one million votes would also be equal to 0.01% of all votes cast in an election, but respondents are 10 percentage points more likely to say 100 ineligible votes cast of 1 million votes is a major problem than they are to say 10 of 100,000 is a major problem (52% vs. 42%).

The effect of varying the size of the electorate is not clear for the question asked about eligible voters prevented from voting.

Methodology

The American Trends Panel survey methodology

The American Trends Panel (ATP), created by Pew Research Center, is a nationally representative panel of randomly selected U.S. adults. Panelists participate via self-administered web surveys. Panelists who do not have internet access at home are provided with a tablet and wireless internet connection. The panel is being managed by GfK.

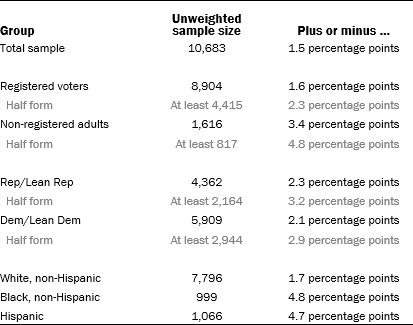
Data in this report are drawn from the panel wave conducted September 24-October 7, 2018. A total of 10,683 panelists responded out of 13,493 who were sampled, for a response rate of 79%. The cumulative response rate accounting for nonresponse to the recruitment surveys and attrition is 3.8%. The margin of sampling error for the full sample of 10,683 respondents is plus or minus 1.5 percentage points.

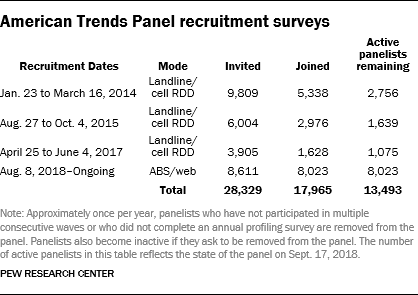
The ATP was created in 2014, with the first cohort of panelists invited to join the panel at the end of a large, national, landline and cellphone random-digit-dial survey that was conducted in both English and Spanish. Two additional recruitments were conducted using the same method in 2015 and 2017, respectively. Across these three surveys, a total of 19,718 adults were invited to join the ATP, of which 9,942 agreed to participate.

Methodology

In August 2018, the ATP switched from telephone to mail recruitment. Invitations were sent to a random, address-based sample (ABS) of households selected from the U.S. Postal Service’s Delivery Sequence File. In each household, the adult with the next birthday was asked to go online to complete a survey, at the end of which they were invited to join the panel. For a random half-sample of invitations, households without internet access were instructed to return a postcard. These households were contacted by telephone and sent a tablet if they agreed to participate. As of Sept. 17, 2018, a total of 8,611 had been invited to join the panel, and 8,023 agreed to join the panel and completed an initial profile survey.

Of the 17,965 individuals who have ever joined the ATP, 13,493 remain active panelists and continue to receive survey invitations.

Weighting dimensions

Weighting

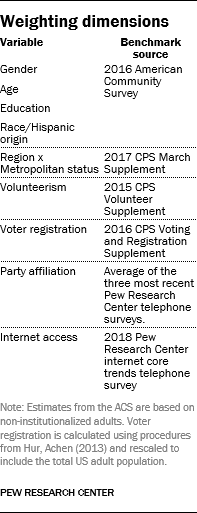
The ATP data were weighted in a multistep process that begins with a base weight incorporating the respondents’ original survey selection probability and the fact that in 2014 and 2017 some panelists were subsampled for invitation to the panel. For panelists recruited prior to 2018, an adjustment was made for the fact that the propensity to join the panel and remain an active panelist varied across different groups in the sample. No adjustment was made for new panelists from the 2018 recruitment. The final step in the weighting uses an iterative technique that aligns the sample to population benchmarks on the dimensions listed in the accompanying table.

Sampling errors and statistical-significance tests take into account the effect of weighting. Interviews are conducted in both English and Spanish, but the American Trends Panel’s Hispanic sample is predominantly native born and English speaking.

In addition to sampling error, one should bear in mind that question wording and practical difficulties in conducting surveys can introduce error or bias into the findings of opinion polls.

The following table shows the unweighted sample sizes and the error attributable to sampling that would be expected at the 95% level of confidence for different groups in the survey:

Sample size


Sample sizes and sampling errors for other subgroups are available upon request.


Appendix A: Categorization of states in this report

Accessibility of elections

This report uses a measure of how accessible voting is in a state. States are categorized as having “more accessible” voting laws if they have at least one of the following laws: 1) early voting before Election Day, 2) absentee voting without having to provide a reason (also known as “no-excuse absentee voting”) or 3) conducts elections entirely by mail (Colorado, Oregon and Washington only). States without any of these laws are classified as states with “less accessible” voting laws

There are 37 states, plus the District of Columbia, with “more accessible” laws. They are: Alaska, Arizona, Arkansas, California, Colorado, District of Columbia, Florida, Georgia, Hawaii, Idaho, Illinois, Indiana, Iowa, Kansas, Louisiana, Maine, Maryland, Massachusetts, Minnesota, Montana, Nebraska, Nevada, New Jersey, New Mexico, North Carolina, North Dakota, Ohio, Oklahoma, Oregon, South Dakota, Tennessee, Texas, Utah, Vermont, Washington, West Virginia, Wisconsin and Wyoming. About three-quarters of the public lives in these states.

The 13 “less accessible” states are: Alabama, Connecticut, Delaware, Kentucky, Michigan, Mississippi, Missouri, New Hampshire, New York, Pennsylvania, Rhode Island, South Carolina and Virginia. Overall, about a quarter of the public lives in these states. The data and classification for this measure come from the National Conference of State Legislatures (NCSL). These data were current as of September 20, 2018.

Election Day voter registration

The report uses a measure of whether a state allows voter registration on Election Day or not. There are 15 states, plus the District of Columbia, that allow same-day voter registration in some form; these states are: California, Colorado, Connecticut, District of Columbia, Hawaii, Idaho, Illinois, Iowa, Maine, Minnesota, Montana, New Hampshire, North Dakota, Vermont, Wisconsin and Wyoming. This measure was created using data on voter registration from Vote.org, last updated January 13, 2018. Maryland, which allows same day voter registration during the early voting period, but not on Election Day, is not included in this coding as a same-day registration state.

Partisan control of state government

A three-category measure of partisan control of state government is used throughout the report. States are categorized as either controlled by the Republican Party, controlled by the Democratic Party or having divided control. States are controlled by a party when that party holds the majority in both chambers of the state legislature (or the single chamber in Nebraska) and the governor of the state is a member of the same party.

The data and categories for this measure come from the National Conference of State Legislatures (NCSL) and were last updated on July 10, 2018.

Using this definition, 25 states are controlled by the Republican Party, 8 states plus D.C. are controlled by the Democratic Party and 16 have divided control. The 25 states controlled by the Republican Party are: Alabama, Arizona, Arkansas, Florida, Georgia, Idaho, Indiana, Iowa, Kansas, Kentucky, Michigan, Mississippi, Missouri, New Hampshire, North Dakota, Ohio, Oklahoma, South Carolina, South Dakota, Tennessee, Texas, Utah, West Virginia, Wisconsin and Wyoming. The 8 states, plus the District of Columbia, controlled by the Democratic Party are: California, Delaware, District of Columbia, Hawaii, New Jersey, New York, Oregon, Rhode Island and Washington. The 16 divided control states are: Alaska, Colorado, Connecticut, Illinois, Louisiana, Maine, Maryland, Massachusetts, Minnesota, Montana, Nevada, New Mexico, North Carolina, Pennsylvania, Vermont and Virginia. The NCSL omits Nebraska from its classification because its unicameral legislature is officially nonpartisan.