Pew Research Center

FOR RELEASE AUGUST 29, 2017

Republicans Divided in Views of Trump’s Conduct; Democrats Are Broadly Critical

In their own words: How people describe Trump’s presidency

FOR MEDIA OR OTHER INQUIRIES:

Communications Department
202.419.4372
www.pewresearch.org

RECOMMENDED CITATION

Pew Research Center, August 2017, "Republicans Divided in Views of Trump’s Conduct; Democrats Are Broadly Critical"

About Pew Research Center

Pew Research Center is a nonpartisan, nonadvocacy fact tank that informs the public about the issues, attitudes and trends shaping the world. It does not take policy positions. The Center conducts public opinion polling, demographic research, computational social science research and other data-driven research. It studies politics and policy; news habits and media; the internet and technology; religion; race and ethnicity; international affairs; social, demographic and economic trends; science; research methodology and data science; and immigration and migration. Pew Research Center is a subsidiary of The Pew Charitable Trusts, its primary funder.

© Pew Research Center 2026

Table of contents

  • About Pew Research Center
  • Republicans Divided in Views of Trump’s Conduct; Democrats Are Broadly Critical
  • 1. Views of Trump’s presidential conduct, handling of issues
  • 2. In their own words: Likes and concerns about Trump
  • Methodology

Republicans Divided in Views of Trump’s Conduct; Democrats Are Broadly Critical

In their own words: How people describe Trump’s presidency

In his first seven months as president, Donald Trump has generally drawn high job approval ratings among Republicans. But a new survey finds that nearly a third of Republicans say they agree with the president on only a few or no issues, while a majority expresses mixed or negative feelings about his conduct as president.
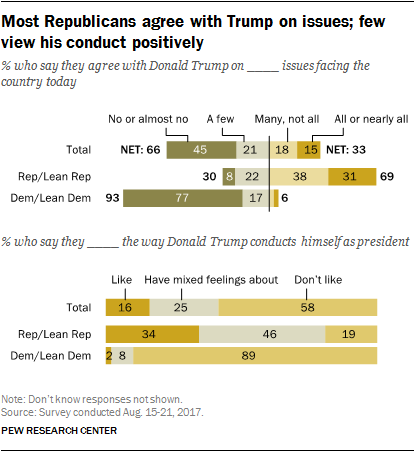
Most Republicans agree with Trump on issues; few view his conduct positively

Overwhelming shares of Democrats disagree with Trump on all or nearly all issues and say they do not like his conduct as president.

The survey, conducted by Pew Research Center Aug. 15-21 among 1,893 adults, finds that 15% of Americans say they agree with Trump on all or nearly all issues, while another 18% say they agree with him on many but not all issues. Most say they agree with Trump on either a few issues (21%) or “no or almost no issues” (45%).

Setting issues aside, a majority (58%) say they do not like the way Trump conducts himself as president, while 25% have mixed feelings about his conduct. Just 16% say they like the way he conducts himself as president.

Among Republicans and Republican-leaning independents, just 31% say they agree with Trump on all or nearly all issues, while an additional 38% agree with him on many, but not all, issues. Fully 93% of Democrats and Democratic leaners say they agree with Trump on, at most, a few issues, including 77% who report virtually no agreement with Trump on issues.

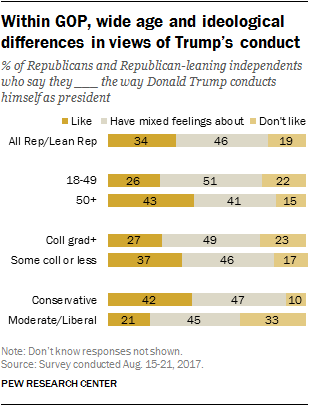
In views of Trump’s conduct as president, 46% of Republicans express mixed feelings, while 19% say they do not like his conduct; 34% say they like the way he conducts himself as president. Among Democrats, 89% have a negative view of Trump’s conduct.
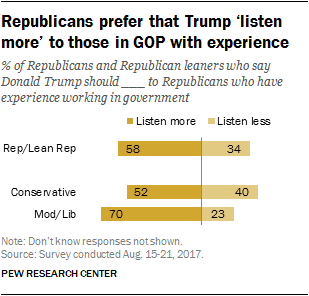
Republicans prefer that Trump ‘listen more’ to those in GOP with experience

The survey finds that most Republicans and Republican leaners favor Trump listening more to members of the party with experience in government. Nearly six-in-ten (58%) say Trump should listen more to Republicans who have experience working in government, while  34% say he should listen less. However, conservative Republicans (52%) are less likely than moderate and liberal Republicans (70%) to say Trump needs to listen more to members of the GOP with experience in government.

About the surveys

This report includes results from two separate surveys:

Most of the findings in this report are based on telephone interviews conducted Aug. 15-21, 2017 among a national sample of 1,893 adults ages 18 years or older who were previously interviewed in Pew Research Center surveys conducted in June and July.

The open-ended questions analyzed in this report are from a separate survey conducted Aug. 8-21, 2017 among 4,971 adults on the Center’s American Trends Panel (ATP), a nationally representative panel of randomly selected U.S. adults.

See the Methodology section of this report for more details.

A separate survey, conducted on Pew Research Center’s nationally representative American Trends Panel, finds stark divisions between those who approve and those who disapprove of Trump’s job performance  in their impressions of the president. This survey, conducted online Aug. 8-21 among 4,971 adults, asked respondents to describe in their own words what they like most about Trump and their biggest concern about how he is handling his job as president. For a sample of responses, see verbatim on positive and negative impressions of Trump’s presidency.
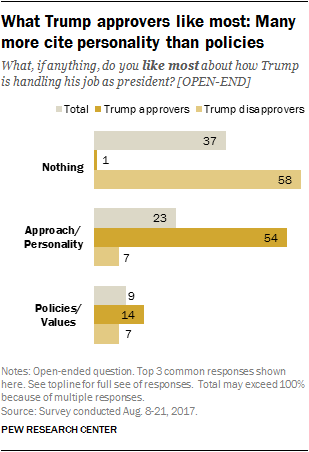
What Trump approvers like most: Many more cite personality than policies

Trump’s personality is mentioned quite often both positively and negatively. Among those who approve of Trump’s job performance (36% of the public), more than half (54%) volunteer something about his personality or general approach as what they like most; mentions of Trump’s policies or agenda are a distant second, at 14%.

Some of those who cite Trump’s personality as what they like most about him point to his leadership and his determination to keep promises, while others praise Trump for his candor and for being unlike a typical politician.

Trump’s detractors have a hard time coming up with anything they like about him. Among those who disapprove of how he is handling his job (63% of the public), “nothing” is by far the most frequent response for what they like most about Trump. About four-in-ten (43%) say explicitly they like nothing about Trump’s performance and another 16% respond to this question by volunteering things they don’t like about him.
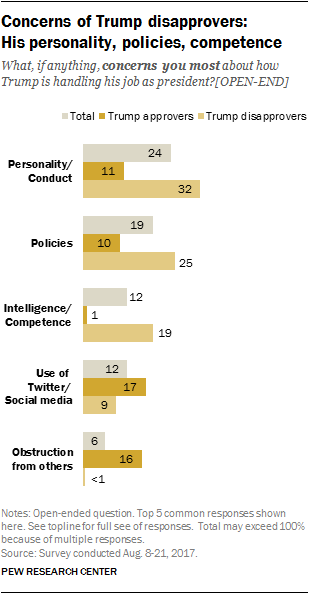
Concerns of Trump disapprovers: His personality, policies, competence

Those who disapprove of Trump cite several concerns about him: 32% point to his personality, including his temperament; 25% mention his policies, particularly foreign policy and its impact on U.S. standing in the world; and 19% fault his intelligence or competence.

Trump’s supporters raise different concerns: 17% of those who approve of his job performance cite his use of Twitter and other social media, while 16% say they are most concerned about obstruction from others, such as Congress and the news media. About one-in-ten of those who approve of Trump say their biggest concern is his personality (11%) and a similar share point to his policies (10%).

Overall, 4% of Americans mention concerns about Trump’s handling of racial issues or his own attitudes about race. However, more cite this concern after the Aug. 12 violence in Charlottesville, Virginia than did so before that point. From Aug. 13-21, 9% cite this concern, compared with 2% in earlier polling. Among those who disapprove of Trump, 15% of those completing the survey on or after Aug. 13 cite concerns about Trump’s approach to race, up from 3% who mention these concerns in the days before.

Other important findings
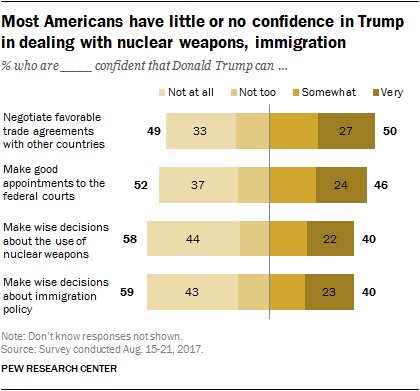
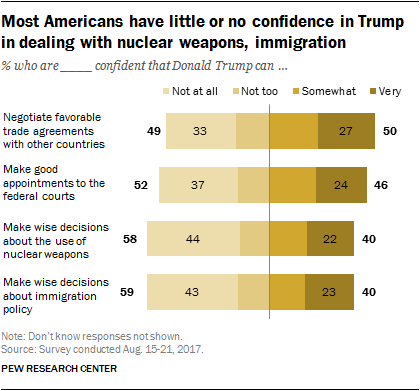
Most Americans have little or no confidence in Trump in dealing with nuclear weapons, immigration

Public more confident in Trump on trade than on immigration, nuclear weapons. In the Aug.15-21 telephone survey, half of Americans say they are very or somewhat confident in Trump to negotiate favorable trade agreements with other countries; nearly as many (46%) are at least somewhat confident he can make good appointments to federal courts. Trump draws less confidence in his ability to make wise decisions about immigration and the use of nuclear weapons (40% each). Majorities say they are not too or not at all confident in Trump’s handling of these two issues.

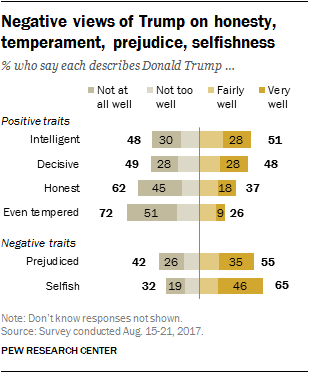
Few describe Trump as “even tempered.” Just 26% of the public, including 45% of Republicans and just 11% of Democrats, say the phrase “even tempered” describes Trump very or fairly well. However, about half of Americans (51%) view him as intelligent. For negative terms, majorities say that the traits selfish (65%) and prejudiced (55%) describe Trump very or somewhat well.

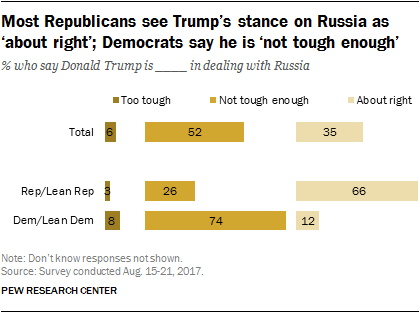
Partisans divided on Trump’s handling of Russia. Roughly half of the public (52%) say Trump is not tough enough in dealing with Russia; 35% say he is about right, while 6% say he is too tough. But there is a stark partisan divide: 74% of Democrats say Trump is not tough enough, compared with just 26% of Republicans. About two-thirds of Republicans (66%) say Trump is about right in dealing with Russia.
1. Views of Trump’s presidential conduct, handling of issues

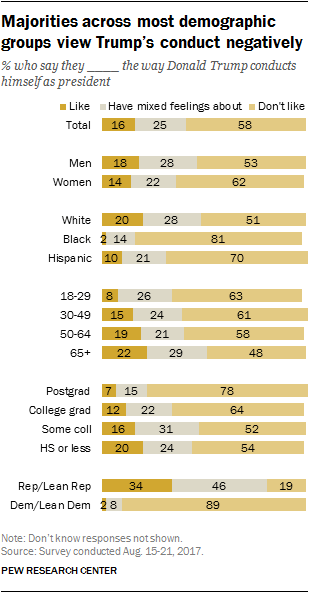
When asked about how Trump conducts himself as president, 58% of Americans say they do not like his conduct; a quarter (25%) say they have mixed feelings, while 16% say they like the way he conducts himself.

Majorities across most demographic groups view Trump’s conduct negatively

Large majorities across most demographic groups express negative views of the way Trump conducts himself. However, as with views of Trump’s overall job performance, there are sizable differences in these opinions.

While about half of men (53%) and whites (51%) say they do not like the way Trump conducts himself, wide majorities of women (62%) and blacks (81%) and Hispanics (70%) say this.

Younger adults are more likely than older adults to say they do not like the way Trump conducts himself as president. About six-in-ten of those younger than 50 (62%) say they don’t like his demeanor, compared with roughly half of those ages 65 and older (48%).

There also is a wide educational gap in views of how Trump conducts himself. A 78% majority of those with postgraduate degrees say they do not like the way Trump comports himself, as do 64% of those with a college degree. Fewer of those with some college experience or less education rate Trump’s conduct negatively (53%).

While Republicans generally take a much less negative view of Trump’s conduct as president than do Democrats, there are large differences in opinions among Republicans.

Within GOP, wide age and ideological differences in views of Trump’s conduct

Among Republicans and GOP leaners, conservatives are twice as likely as their moderate and liberal counterparts to say they like the way Trump conducts himself (42% vs. 21%). While just 10% of conservative Republicans say they dislike the way Trump comports himself, this rises to a third (33%) among moderate and liberal Republicans.

And among Republicans 50 and older, 43% say they like the way Trump conducts himself as president, compared with 26% of younger Republicans.

Republicans who do not have a bachelor’s degree are more likely than those who have graduated from college to say they like Trump’s conduct as president (37% vs. 27%).

Public divided over whether Trump is decisive, intelligent

Overall, about as many Americans say intelligent (51%) describes the president very or fairly well as say it does not describe him too well or well at all (48%). Similarly, about half say decisive describes Trump at least fairly well (48%).

Negative views of Trump on honesty, temperament, prejudice, selfishness

On other positive traits, however, Trump receives lower marks. More say honest does not describe the president too well or not well at all (62%) than think it describes him fairly or very well (37%). An even higher percentage (72%) says the phrase “even tempered” does not describe Trump well; 26% say it does.

A majority of Americans say prejudiced describes Trump at least fairly well (55%), compared with 42% who think it does not describe him well. And by 65% to 32%, the public thinks selfish is an apt descriptor of the president, including 46% who think it describes Trump “very well.”

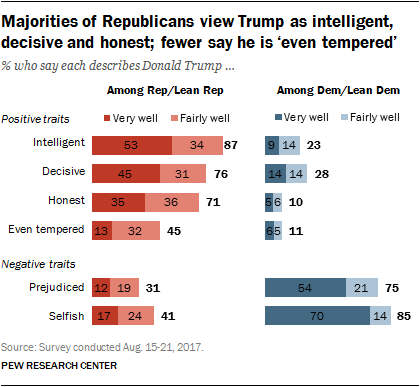
Large majorities of Republicans and Republican leaners think intelligent (87%) and decisive (76%) describe Trump at least fairly well. And most Republicans (71%) also think the word honest describes Trump well.

Trump receives much lower marks from Republicans for his temperament: Fewer than half say even tempered describes him well (45%); 53% say this phrase describes him not too well or not at all well.

Majorities of Republicans view Trump as intelligent, decisive and honest; fewer say he is ‘even tempered’

When it comes to negative traits, 41% of Republicans say the word selfish describes Trump well, while a majority (55%) say it does not. Even fewer Republicans (31%) characterize Trump as prejudiced; 65% say this does not describe him well.

Majorities of Democrats say none of the four positive descriptors apply to Trump and that both negative terms describe him well. Still, nearly three-in-ten Democrats say the word decisive describes Trump well, while 23% say the same about intelligent. Three-quarters of Democrats say the word prejudiced (75%) fits Trump at least fairly well, including 54% who say it describes him very well. An even larger majority (85%) says selfish describes Trump very (70%) or fairly (14%) well.

Within GOP, conservatives more closely aligned with Trump on issues

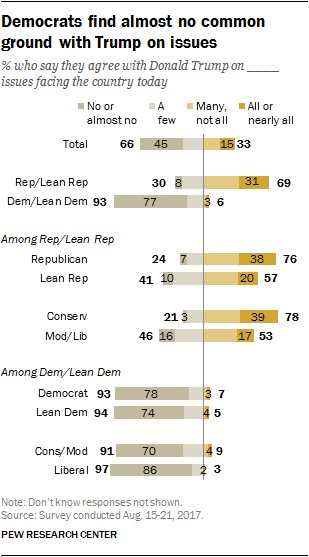
Overall, 15% of Americans say they tend to agree with Donald Trump on “all or nearly all”  of the important issues facing the country, while another 18% find agreement with him on “many, but not all” issues. About two-in-ten (21%) say they agree with Trump on “a few” issues, and 45% say they agree with Trump on “no or almost no” issues.

Democrats find almost no common ground with Trump on issues

Nearly seven-in-ten Republicans and Republican leaners (69%) say they agree with Trump on many or all issues facing the country today, including 31% who agree with the president on all or nearly all issues. Still, three-in-ten Republicans say they agree with Trump on only a few (22%) or no (8%) issues.

As with views of Trump’s presidential conduct, there are differences among Republicans in the extent to which they agree with the president on issues. Wide shares of conservative Republicans agree with Trump on many or all issues (78%), including 39% who agree with the president on all or nearly all. Moderate and liberal Republicans and leaners are less likely to be in agreement with Trump’s positions: While 53% say they agree on many or all issues, 46% say they agree with him on a few or no issues.

In addition, those who identify as Republicans are significantly more likely than independents who lean to the GOP to say they agree with Trump on at least most issues (76% vs. 57%).

Both Democrats and Democratic leaners overwhelmingly find little or no agreement with the president on issues. But among Democrats and Democratic leaners, liberals (86%) are more likely than conservatives and moderates (70%) to say they agree with Trump on no or almost no issues.

Most lack confidence in Trump to make wise decisions on nuclear weapons

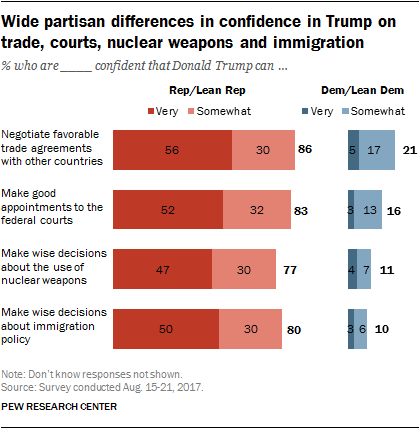
The public has varying degrees of confidence in Trump’s handling of a range of specific issues. Half (50%) say they are very or somewhat confident that Trump can negotiate favorable trade agreements with other countries, while about as many (49%) say they are not too or not at all confident.

Most Americans have little or no confidence in Trump in dealing with nuclear weapons, immigration

There is a similar divide when it comes to Trump’s capacity to make good appointments to the federal courts. Nearly half (46%) say that they are at least somewhat confident he will make good appointments, while 52% say they are not too confident or have no confidence at all in his ability to make good appointments.

By contrast, 40% express confidence in Trump to make wise decisions about the use of nuclear weapons and about immigration policy. Majorities say they are not too confident or not at all confident in him on each of these issues (58% on nuclear weapons, 59% on immigration) including more than four-in-ten who say they are not at all confident in him on these issues.

Across all four issues, Republicans and Republican leaners express far more confidence in Trump than do Democrats and Democratic leaners.

Wide partisan differences in confidence in Trump on trade, courts, nuclear weapons and immigration

However, Republicans are somewhat less confident in Trump’s ability to handle nuclear weapons and immigration than trade. While 56% of Republicans say they very confident that Trump can negotiate favorable trade deals, fewer express this level of confidence in Trump on nuclear weapons (47%) and immigration (50%).

While Democrats are far less likely than Republicans to voice confidence in Trump, more Democrats say they are very or somewhat confident in Trump on trade (21%) than in dealing with nuclear weapons (11%) or immigration (10%).

Trump’s approach toward Russia

Most Republicans see Trump’s stance on Russia as ‘about right’; Democrats say he is ‘not tough enough’

About half of the public (52%) thinks that Donald Trump is “not tough enough” in dealing with Russia. About a third of the country (35%) thinks that Trump is handling Russia “about right.”

Republicans and Democrats are sharply divided on the issue. About three-quarters (74%) of Democrats think that Trump is not tough enough in dealing with Russia, while about two-thirds (66%) of Republicans say that he is handling Russia about right.

2. In their own words: Likes and concerns about Trump

Asked in an open-ended format what they most like about Donald Trump, about a quarter of Americans (23%) mention Trump’s approach and personality, saying he “keeps his promises” or “tells it like it is.” Mentions of Trump’s approach are the second most common response to this question; only the share of Americans who say there is nothing they like about Trump’s job performance or respond to this question by citing things they do not like about Trump is higher: 37% of Americans say this.

And Trump’s personality ranks as the most common response to an open-ended question about concerns people have about him. Here, too, about a quarter of Americans (24%) mention aspects of his personality or conduct – in this case, frequently mentioning Trump’s temperament or saying that he has a tendency to speak “off the cuff.”

To be sure, in this separate survey conducted Aug. 8-21 online among 4,971 adults, mentions of Trump’s personality characteristics in positive terms are far more common among the 36% of Americans who approve of Trump’s job performance than among the 63% who do not. Mentions of his personality as cause for concern are more common among those who disapprove.

Among those who approve of Trump’s job performance, about half (54%) cite aspects of his personality or approach as what they most like about Trump’s job performance, including 25% who call out his leadership style, say that he is keeping his promises or that he is getting things done as president. As one 57-year-old woman who approves of Trump put it: “He is a fighter and loves America as much as I do.”

About one-in-ten (13%) of those who approve of Trump say they like that he speaks his mind, is direct and “tells it like it is,” or that he’s “not politically correct.” And 9% say they like that he isn’t a typical politician or that he’s challenging the Washington establishment or “draining the swamp.”

Trump’s policy positions or accomplishments are mentioned by 14% of those who approve of his job performance as the thing they like most about him: 4% specifically mention economic policies, including a respondent who says Trump “is promoting the economy,” and adds that “he pays no attention to the snowflakes and keeps his agenda.” A similar share mention foreign policy (3%) and immigration policy (also 3%), including a 30-year-old man who says that Trump is “cracking down” on immigration, and likes that he is “turning back the policies that the previous administration implemented.”

But those who disapprove have starkly different responses to the question about what, if anything, they like about Trump: Nearly six-in-ten (58%) say there is nothing they like about Trump – or take the question as an opportunity to list things they do not like about him. One says there is “absolutely nothing” he likes, adding that “every word, action and tweet is an embarrassment that likely imperils our freedom and safety.”

Others say they like that he isn’t getting more done. A 30-year-old woman likes most that he is “too incompetent and reactive to successfully implement his destructive agenda.”

Still, even among those who disapprove of Trump’s job performance, there are some who cite his approach or his policies as things they like. One says she “disagrees with his views,” but “appreciates the attempt at following through his word.” Another likes how Trump “handled the Trans Pacific Partnership deal,” but adds “that’s about it.”

Trump’s conduct – and Twitter use – cited by the public as a concern

Asked what, if anything, concerns them about Trump’s job performance, 24% of the public mentions concerns about his personality, including 8% who mention his temperament or lack of tact and 7% who say he is not deliberate enough with his speech; 6% characterize their concern as Trump lacking in presidential traits, while 5% think the president is narcissistic or self-focused.

While these types of concerns are more likely to be cited by those who disapprove of Trump (32% do so), about one-in-ten of those who approve of Trump mention concerns about his personality or conduct, including a 67-year-old woman who says “his undignified way of speaking and not listening to those who could help him communicate better” is cause for concern.

[Affordable Care Act]

Trump’s competency or intelligence is mentioned by 12% of Americans as a concern, though very few who approve of him say this (just 1%), while roughly two-in-ten (19%) who disapprove of Trump do: A 46-year-old woman who disapproves of Trump says “people elected a less than smart guy to do the job.”

Also mentioned by 12% of Americans, including 17% of those who approve Trump, is his behavior on social media – particularly Twitter. A 30-year-old man who approves of Trump’s job performance overall exemplifies a common thread in these responses when he says, “I wish he would stop tweeting.” This critique is sometimes more pointed, even among his supporters: A 63-year-old woman says “his constant, immature tweets make him sound like a twit and just provide ammunition for the opposition.”

But about one-in-ten Americans either explicitly say they have no concerns about Trump (4%) or that their only concerns about Trump are about the opposition he faces from others, including Democrats, Republicans and the media (6%).

These sentiments are nearly exclusively seen among those who approve of Trump, 16% of whom say their concern about Trump is the obstruction he faces. As one puts it: “Nothing really concerns me about Trump. It’s all the overwhelming opposition to Trump that concerns me.”

Methodology

Survey conducted Aug. 15-21, 2017

The analysis in this report is based on telephone interviews conducted Aug. 15-21, 2017 among a national sample of 1,893 adults. The interviews were conducted among adults 18 years of age or older previously interviewed in one of two Pew Research Center surveys conducted June 8-18, 2017, of 2,504 adults and June 27-July 9, 2017, of 2,505 adults (for more on the methodologies of the original surveys, see here and here). The survey was conducted by interviewers at Princeton Data Source under the direction of Princeton Survey Research Associates International. Interviews were conducted on both landline telephones and cell phones (517 respondents for this survey were interviewed on a landline telephone, and 1,376 were interviewed on a cell phone). Interviews were conducted in English and Spanish. Interviewers asked to speak with the respondent from the previous interview by first name, if it was available, or by age and gender. For detailed information about our survey methodology, see https://alpha.pewresearch.org/pewresearch-org/methodology/u-s-survey-research/

Weighting was performed in two stages. The weight from the original sample datasets was used as a first-stage weight for this project. This first-stage weight corrects for different probabilities of selection and differential non-response associated with the original interview. The sample of all adults contacted for this survey was then raked to match parameters for sex by age, sex by education, age by education, region, race/ethnicity, population density, phone use. The non-Hispanic, white subgroup was also raked to age, education and region. These parameters came from the 2015 Census Bureau’s American Community Survey and population density to parameters from the Decennial Census. The sample also is weighted to match current patterns of telephone status (landline only, cell phone only, or both landline and cell phone), based on extrapolations from the 2016 National Health Interview Survey. Sampling errors and statistical tests of significance take into account the effect of weighting.

The following table shows the unweighted sample sizes and the error attributable to sampling that would be expected at the 95% level of confidence for different groups in the survey:


Sample sizes and sampling errors for other subgroups are available upon request.

In addition to sampling error, one should bear in mind that question wording and practical difficulties in conducting surveys can introduce error or bias into the findings of opinion polls.

Pew Research Center undertakes all polling activity, including calls to mobile telephone numbers, in compliance with the Telephone Consumer Protection Act and other applicable laws.

Pew Research Center is a nonprofit, tax-exempt 501(c)(3) organization and a subsidiary of The Pew Charitable Trusts, its primary funder.

Survey conducted Aug. 8-21, 2017

The American Trends Panel (ATP), created by the Pew Research Center, is a nationally representative panel of randomly selected U.S. adults recruited from landline and cell phone random digit dial surveys. Panelists participate via monthly self-administered Web surveys. Panelists who do not have internet access are provided with a tablet and wireless internet connection. The panel is being managed by Abt Associates.

Data in this report are drawn from the panel wave conducted Aug. 8-21, 2017 among 4,971 respondents. The margin of sampling error for the full sample of 4,971 respondents is plus or minus 2.3 percentage points.

Members of the American Trends Panel were recruited from several large, national landline and cellphone random digit dial (RDD) surveys conducted in English and Spanish. At the end of each survey, respondents were invited to join the panel. The first group of panelists was recruited from the 2014 Political Polarization and Typology Survey, conducted Jan. 23 to March 16, 2014. Of the 10,013 adults interviewed, 9,809 were invited to take part in the panel and a total of 5,338 agreed to participate. 1 The second group of panelists was recruited from the 2015 Pew Research Center Survey on Government, conducted Aug. 27 to Oct. 4, 2015. Of the 6,004 adults interviewed, all were invited to join the panel, and 2,976 agreed to participate. 2 The third group of panelists was recruited from a survey conducted April 25 to June 4, 2017. Of the 5,012 adults interviewed in the survey or pretest, 3,905 were invited to take part in the panel and a total of 1,628 agreed to participate. 3

The ATP data were weighted in a multi-step process that begins with a base weight incorporating the respondents’ original survey selection probability and the fact that in 2014 some panelists were subsampled for invitation to the panel. Next, an adjustment was made for the fact that the propensity to join the panel and remain an active panelist varied across different groups in the sample. The final step in the weighting uses an iterative technique that aligns the sample to population benchmarks on a number of dimensions. Gender, age, education, race, Hispanic origin and region parameters come from the U.S. Census Bureau’s 2015 American Community Survey. The county-level population density parameter (deciles) comes from the 2010 U.S. Decennial Census. The telephone service benchmark comes from the January-June 2016 National Health Interview Survey and is projected to 2017. The volunteerism benchmark comes from the 2015 Current Population Survey Volunteer Supplement. The party affiliation benchmark is the average of the three most recent Pew Research Center general public telephone surveys. The Internet access benchmark comes from the 2017 ATP Panel Refresh Survey. Respondents who did not previously have internet access are treated as not having internet access for weighting purposes. Sampling errors and statistical tests of significance take into account the effect of weighting. Interviews are conducted in both English and Spanish, but the Hispanic sample in the American Trends Panel is predominantly native born and English speaking.

The following table shows the unweighted sample sizes and the error attributable to sampling that would be expected at the 95% level of confidence for different groups in the survey:

Sample sizes and sampling errors for other subgroups are available upon request.

In addition to sampling error, one should bear in mind that question wording and practical difficulties in conducting surveys can introduce error or bias into the findings of opinion polls.

The August 2017 wave had a response rate of 74% (4,971 responses among 6,722 individuals in the panel). Taking account of the combined, weighted response rate for the recruitment surveys (10.0%) and attrition from panel members who were removed at their request or for inactivity, the cumulative response rate for the wave is 2.6%. 4