Pew Research Center

FOR RELEASE DECEMBER 8, 2016

Low Approval of Trump’s Transition but Outlook for His Presidency Improves

Growing numbers see ‘strong’ partisan and racial conflicts

FOR MEDIA OR OTHER INQUIRIES:

Communications Department
202.419.4372
www.pewresearch.org

RECOMMENDED CITATION

Pew Research Center, December 2016, "Low Approval of Trump’s Transition but Outlook for His Presidency Improves"

About Pew Research Center

Pew Research Center is a nonpartisan, nonadvocacy fact tank that informs the public about the issues, attitudes and trends shaping the world. It does not take policy positions. The Center conducts public opinion polling, demographic research, computational social science research and other data-driven research. It studies politics and policy; news habits and media; the internet and technology; religion; race and ethnicity; international affairs; social, demographic and economic trends; science; research methodology and data science; and immigration and migration. Pew Research Center is a subsidiary of The Pew Charitable Trusts, its primary funder.

© Pew Research Center 2026

Table of contents

  • About Pew Research Center
  • Low Approval of Trump’s Transition but Outlook for His Presidency Improves
  • 1. Views of President-elect Trump and his administration
  • 2. Discrimination and conflicts in U.S. society
  • 3. Political values: Government regulation, environment, immigration, race, views of Islam
  • 4. Views of the ACA, Medicare and the nation’s economy
  • 5. Views of Mike Pence
  • 6. Awareness of election results
  • Methodology

Low Approval of Trump’s Transition but Outlook for His Presidency Improves

Growing numbers see ‘strong’ partisan and racial conflicts

Nearly a month after Donald Trump’s election as president, the public views his transition to the White House less positively than those of past presidents-elect. And while expectations for Trump’s presidency have improved since before his victory, about as many Americans say Trump will be a poor or terrible president as a good or great one.

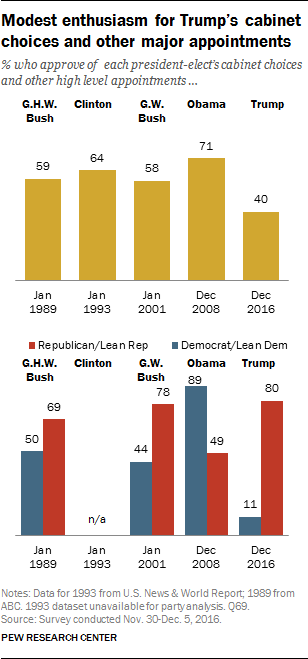
The latest national survey by Pew Research Center, conducted Nov. 30-Dec. 5 among 1,502 adults, finds that 40% approve of Trump’s cabinet choices and high-level appointments, while 41% approve of the job he has done so far in explaining his policies and plans for the future.

In December 2008, 71% of Americans approved of Barack Obama’s cabinet choices, and 58% expressed positive views of George W. Bush’s high-level appointments in January 2001, prior to his inauguration. Similarly, higher shares approved of the way that both Obama (72%) and Bush (50%) explained their policies and plans for the future than say that about Trump today.

Overall, 35% of Americans think Trump will be a good or great president; 18% say he will be average, while 38% say he will be poor or terrible. However, these assessments are far more positive than they were throughout the campaign: In October, just 25% of the public said Trump would make a good or great president, while 57% said he would be poor or terrible.

Republicans express more positive views of a Trump presidency than they did in October, while Democrats have less negative expectations. Two-thirds of Republicans and Republican-leaning independents (67%) now say Trump will be a good or great president; in October, fewer (54%) Republicans said this.

In October, 89% of Democrats and Democratic leaners thought Trump would make a poor or terrible president, with 74% calling him terrible. Today, 64% of Democrats view his prospective presidency negatively, with 45% saying he will be terrible.
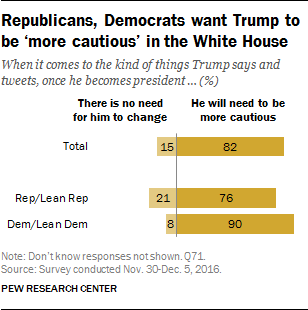
Republicans, Democrats want Trump to be 'more cautions' in the white hous

However, many of the same doubts and concerns that voters expressed about Trump’s qualifications and temperament during the campaign are evident as he prepares to take office. Just 37% of the public views Trump as well-qualified; 32% of registered voters described Trump as well-qualified in October. Majorities continue to say Trump is reckless (65%) and has poor judgment (62%), while 68% describe him as “hard to like.”

In addition, more than half of the public (54%) says that Trump has done too little to distance himself from “white nationalist groups” who support him, while 31% say he has done the right amount to distance himself from such groups; 6% say he has done too much in this regard.

There also is broad public agreement that the president-elect will need to be more cautious in expressing his views once he takes office. About eight-in-ten Americans (82%) – including large majorities of Republicans and (76%) and Democrats (90%) – say that once he takes office, Trump “will need to be more cautious about the kinds of things he says and tweets.” Just 15% of the public says there is no need for Trump to change the kinds of things he says and tweets.

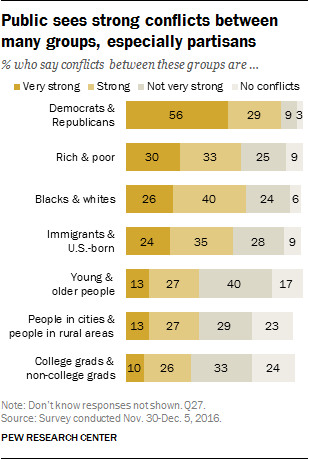
In the aftermath of a deeply divisive campaign, majorities of Americans say there are “strong” conflicts between many groups in society – between Republicans and Democrats, the rich and poor, and blacks and whites, as well as between immigrants and people born in the United States.
Public sees strong conflicts between many groups, especially partisans

Fully 85% say there are either “very strong” (56%) or “strong” (29%) conflicts between Democrats and Republicans, while 66% say there are very strong or strong conflicts between blacks and whites and 63% say the same about the rich and poor. Nearly six-in-ten (59%) think there are strong conflicts between immigrants and the native-born.

Four-in-ten think there are very strong or strong conflicts between the young and old and between people who live in cities and people in rural areas; 37% see strong conflicts between college graduates and those who did not attend college.

Four years ago, most Americans also said there were strong conflicts between partisans, but the share saying there are very strong conflicts between Republicans and Democrats has increased from 47% to 56%.

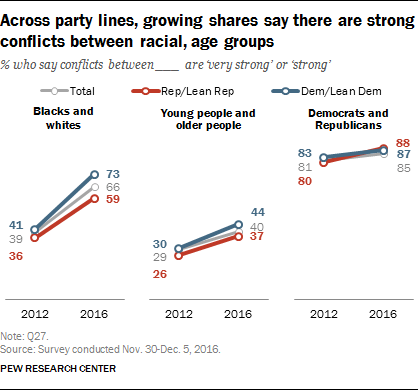
Perceptions of strong conflicts between racial and age groups have risen sharply since 2012. Currently, 26% say there are very strong conflicts between blacks and whites, while 40% perceive strong conflicts; four years ago, just 11% saw very strong conflicts between the races and 28% said there were strong conflicts. The share saying there are at least strong conflicts between young people and older people also has increased 11 percentage points since 2012, from 29% to 40%.
Across party lines, growing shares say there are strong conflicts between racial, age groups

The belief that there are strong racial and age conflicts in this country has increased across partisan lines. Nearly three-quarters of Democrats (73%) currently say there are very strong or strong conflicts between blacks and whites, up from just 41% four years ago. Over the same period, the share of Republicans saying this has risen from 36% to 59%.

Similarly, the share of Democrats who say there are at least strong conflicts between young people and older adults has risen 14 percentage points since 2012 (from 30% to 44%), while increasing 11 points among Republicans (26% to 37%).

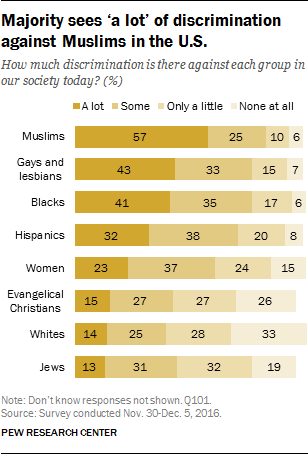
The survey also finds that substantial numbers of Americans think there is discrimination against several groups in society – especially against Muslims. A majority of the public (57%) says there is a lot of discrimination against Muslims in this country, while 25% say there is some discrimination; just 16% say there is only a little or no discrimination at all against Muslims.

Majorities also say there is a lot or some discrimination against gays and lesbians (43% a lot, 33% some), blacks (41% a lot, 35% some), Hispanics (32% a lot, 38% some) and women (23% a lot, 37% some).
Majority sees ‘a lot’ of discrimination against Muslims in the U.S.

The shares saying there is “a lot” of discrimination against Muslims and blacks have increased since 2013. At that time, when asked a somewhat different version of the question, 45% said there was a lot of discrimination against Muslim Americans; today, 57% see a lot of discrimination against Muslims in society.

In addition, a much larger share perceives a lot of discrimination against blacks today (41%) than said this against African Americans in 2013 (22%). And the number saying there is a lot of discrimination against women has risen eight percentage points over this period (from 15% to 23%).

There are wide partisan differences in the perceptions of discrimination against most groups. For instance, while majorities of both Republicans and Democrats say blacks face at least some discrimination, just 20% of Republicans and Republican leaners say blacks face a lot of discrimination, compared with 57% of Democrats and Democratic leaners who say the same.

Democrats also are more likely than Republicans to say there is at least some discrimination against women (75% vs. 43%).

By contrast, while half of Republicans see at least some discrimination against evangelical Christians, just a third of Democrats do so. And while 49% of Republicans say there is at least some discrimination against whites in the U.S., only 29% of Democrats say the same.

Public divided on the ACA, many unaware of proposed Medicare changes
Few aware of proposed Medicare changes

The public is divided over the Affordable Care Act – and divided over whether it should be repealed or expanded. While views of the law have changed only modestly in recent years, predictions about the law’s fate have shifted dramatically.

Currently, 53% expect the law’s major provisions to be eliminated, while just 39% expect them to be maintained. Last year and in 2014, more predicted that the ACA’s major provisions would be maintained than eliminated. (For more, see how partisans view the ACA)

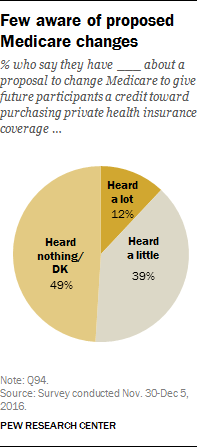
A second major issue likely to be considered by the 115th Congress – possible changes to Medicare – has not resonated widely with the public. Overall, only about half of the public (51%) has heard a lot (12%) or a little (39%) about a proposal to change Medicare to a program that would give future participants a credit toward purchasing private health insurance. About as many either have heard nothing (48%) or don’t know (1%).

Those who have heard about possible changes to Medicare oppose these changes by a wide margin. Among the small share of Americans who have heard a lot about the proposal, two-thirds (67%) oppose it, while just 32% favor it. Opinion is divided among the much larger group who have heard little or nothing about the proposal (41% favor, 40% oppose, 19% don’t know).

Other important findings

Republicans less likely to say Clinton won popular vote. Most Americans know that Trump won the most electoral college votes (78% say this) and that Hillary Clinton won the most individual votes nationwide (72%). While there are only slight partisan differences in awareness of the vote in the electoral college, 81% of Democrats and Democratic leaners say correctly that Clinton won the national popular vote, compared with a smaller majority (68%) of Republicans and Republican leaners.

Confidence in Trump varies, depending on the issue. A majority of the public (60%) says they are very or somewhat confident that Trump will work effectively with Congress, while 52% are confident he will manage the executive branch effectively. Fewer have confidence in him handling an international crisis (45%) or using military force wisely (44%).

Concerns about Trump’s possible conflicts. Most Americans say they are very concerned (45%) or somewhat concerned (20%) that Trump’s relationships with businesses or foreign governments conflict with his ability to serve the country’s best interests. These views are little changed from late October, when 42% of registered voters had a great deal of concern over Trump’s potential conflicts.
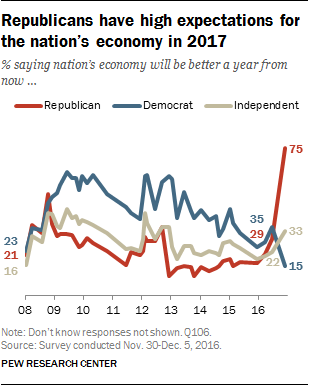
Post-election spike in economic optimism – among Republicans. Democrats are more likely than Republicans to view the current state of the economy positively, but Republicans are far more optimistic about the economy’s course over the next year. Fully 75% of Republicans expect the economy to improve over the next year, up from just 29% who said this in June. By contrast, the share of Democrats who expect the economy to get better over the coming year has fallen from 35% to 15%.

Mixed views of Mike Pence. Opinions about Mike Pence are divided – 39% view the vice president-elect favorably, while 42% have an unfavorable opinion. But most Americans (54%) think Pence is qualified to become president if anything happens to Trump; just 30% say he is not qualified. Pence has a very positive image among white evangelical Christians. Two-thirds (67%) view him favorably, and 78% say he is qualified to serve as president.
1. Views of President-elect Trump and his administration

As Donald Trump prepares to take office as the nation’s 45th president, 55% of the public says that, so far, they disapprove of the job he has done explaining his policies and plans for the future, while 41% approve of the job he has done.

Trump’s rating for the job he has done so far presenting his vision to the public is lower than those other recent presidents received following their elections.

In December 2008, 72% said they approved of the job then President-elect Obama had done explaining his plans and policies for the future. And in the wake of the disputed 2000 election, 50% said they approved of the job George W. Bush had done explaining his plans and policies. In early 1989 and 1993, the public gave both George H. W. Bush and Bill Clinton positive ratings for how they had communicated their future plans for the country: 62% approved of Clinton, and 65% approved of Bush (this measure for George H. W. Bush is from March 1989, after he took office).

The partisan gap in ratings of the job Trump has done so far is wider than it has been for any prospective president dating to the 1988 election.

Modest enthusiasm for Trump’s cabinet choices and other major appointments

About eight-in-ten Republicans and Republican leaners (79%) say they approve of the job Trump has done explaining his policies and plans for the future to the American people; just 15% of Democrats and Democratic leaners say the same. The 64-percentage point gap between the ratings offered by Republicans and Democrats is larger than the 44-percentage point gap in early reactions to Obama measured in December 2008 and the 48-percentage point gap in reactions to Bush measured in January 2001. The current gap is driven in part by very low rating among Democrats: the 15% who approve of Trump’s early approach is lower than any rating given to a new president-elect by members of the losing party in recent elections (including the 29% of Democrats who approved of how Bush laid out his vision in January 2001).

Trump also receives low marks for his initial cabinet choices and other high level appointments. By 51% to 40%, more say they disapprove than approve of the cabinet choices and appointments Trump has made so far. In contrast, majorities approved of the choices made by the past four president-elects. In fact, approval ratings for Trump’s cabinet choices are 18 points lower than for the next lowest-rated president-elect.

Eight-in-ten Republicans and Republican leaners say they approve of Trump’s cabinet choices and other high level appointments. By contrast, just 11% of Democrats and Democratic leaners say they approve of these selections. Ratings among Democrats today are far lower than the 49% of Republicans who said they approved of Obama’s initial cabinet choices in December 2008 and the 44% of Democrats who said the approved of Bush’s selections in January 2001.

What kind of president will Trump be?

Overall, 35% say they think Trump will be a great (14%) or good (22%) president, while about as many (38%) think he will be either poor (13%) or terrible (25%); 18% say they think he will make an average president.
While current ratings are mixed, they are more positive than assessments of Trump as a possible president prior to his election victory. Throughout the campaign, majorities said they thought Trump would be either a poor or terrible president, including 57% who said this in late October.

Expectations for Trump as president have improved in part because Democrats are now much less likely to say they expect him to make a poor or terrible president than they were during the campaign – in particular, the share expecting him to be a terrible president has decreased since before the election.

In October, nearly nine-in-ten Democrats and Democratic leaners (89%) said they thought Trump would make a poor or terrible president. Although a majority of Democrats still say this, that share has fallen sharply to 64% in the current survey. And while a plurality of Democrats continues to say he will be a terrible president, that share has declined from 74% in October to 45% today.
At the same time, there has been an uptick in the share of Republicans and Democrats who think Trump will make a great or good president. Two-thirds (67%) of Republicans and Republican leaners think Trump will make at least a good president (up from 54% in October). Few Democrats and Democratic leaners think Trump will make a great or good president (11%), but the share who say this is up 8 points since October.
Confidence in Trump to handle aspects of the presidency

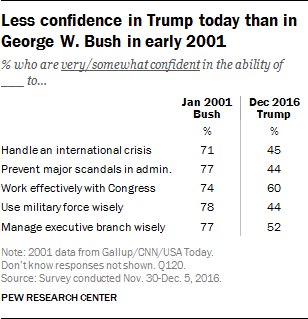
The public is confident in Trump’s ability to work with Congress, and about half are confident that he will manage the executive branch effectively; but there are doubts about Trump in other areas, including his ability to prevent major scandals in his administration and use military force wisely.

Six-in-ten say they are either very (26%) or somewhat (35%) confident in Trump’s ability to work with Congress. When it comes managing the executive branch effectively, 52% say they are either very or somewhat confident in Trump’s ability to do this.

By contrast, fewer than half say they are very or somewhat confident in Trump’s ability to handle an international crisis (45%), use military force wisely (44%) or prevent major scandals in his administration (44%).

Not surprisingly, Republicans express confidence in Trump’s ability to handle different aspects of the presidency, while Democrats say they are not confident in Trump’s ability.

Republicans and Republican leaners are broadly confident in Trump’s ability to work effectively with Congress (88%), to use military force wisely (84%) and to manage the executive branch effectively (84%). Large shares also are confident in his ability to handle an international crisis (79%) and prevent major scandals in his administration (77%), though slightly fewer Republicans express confidence in Trump in these areas than in his ability to work with Congress.

Democrats are broadly skeptical of Trump’s abilities. Only about two-in-ten are confident in his ability to handle an international crisis (21%), prevent major scandals in his administration (20%) or use military force wisely (18%). Somewhat more (29%) are confident that Trump can manage the executive branch effectively. Democrats express the most confidence in Trump when it comes to his ability to work with Congress: Still, just 40% say they are very or somewhat confident that he can work effectively with Congress.

1_7alt

The public expresses less confidence in Trump’s ability to handle different aspects of the presidency than they did in George W. Bush, before he took office in 2001.

At least seven-in-ten said they were very or somewhat confident in Bush’s ability to handle aspects of the job in January 2001. Compared with assessments of Bush, the public is significantly less likely to say they are confident in Trump’s ability to use military force wisely (34 points lower than ratings of Bush), prevent major scandals in his administration (33 points lower), handle an international crisis (26 points lower), manage the executive branch effectively (25 points lower) and work effectively with Congress (14 points lower).

Low personal favorability ratings for Trump

Alongside negative ratings for the job Trump has done explaining his plans and selecting his cabinet so far, most also hold an overall unfavorable view of the president-elect.

Roughly six-in-ten (58%) say they have either a very (38%) or mostly (20%) unfavorable view of Trump, compared with 37% who hold a very (14%) or mostly (23%) favorable view of him.

By wide margins, the public held favorable views of other recent president-elects. In the weeks before each took office, 79% had a favorable view of Obama, 60% had a favorable view of George W. Bush and 66% had a favorable view of Bill Clinton.

About eight-in-ten Republicans (78%) hold a favorable view of Trump. Views among Democrats are highly negative: 87% say they hold an unfavorable view of the president-elect.

Older adults hold a much more favorable view of Trump than younger adults. By 54% to 42%, more of those ages 65 and older rate Trump favorably than unfavorably. Views are about evenly divided among those ages 50-64 (47% favorable, 49% unfavorable). Large majorities of those 18-29 (73%) and 30-49 (65%) hold an unfavorable view of Trump.

Nearly eight-in-ten (78%) of those with a postgraduate degree view Trump unfavorably, as do 62% of those with a college degree. On balance, those without a college degree also view Trump unfavorably, though by somewhat smaller margins.

Among whites who have not graduated from college, more hold a favorable (52%) than unfavorable (43%) view of Trump. By contrast, whites with a college degree view Trump more unfavorably than favorably by almost two-to-one (63%-33%).

There is an age gap among Republicans and Republican leaners in views of Trump: 89% of Republicans age 50 and older view Trump favorably, compared with a smaller majority (62%) of Republicans ages 18-49. Democrats and Democratic leaners hold broadly unfavorable views of Trump across age cohorts.

Views of Donald Trump’s traits and characteristics

Donald Trump’s low overall favorability rating is reflected in the public’s assessments of his traits and characteristics.

While most (60%) call him patriotic, majorities also describe him as hard to like (68%), reckless (65%) and as having poor judgment (62%).

About half (52%) call Trump a strong leader, but the public is less likely to assign other positive characteristics to him. Fewer than half describe Trump as honest (41%), inspiring (41%) or well-qualified (37%). Only about three-in-ten call him moral (31%) and just 26% say that he is a good role model.

These views are little changed from October, when comparable shares of registered voters ascribed these characteristics to Trump before the election.

Large majorities of Republicans and Republican leaners say Trump is patriotic (89%), a strong leader (80%), well-qualified (75%), honest (73%) and inspiring (70%). Six-in-ten describe him as moral. Republicans are more closely divided over whether Trump is a good role model: 52% say that he is, while 42% say that he is not.

Overall, 36% of Republicans and Republican leaners describe Trump as reckless and 34% say he has poor judgment; majorities of Republicans say these two traits do not describe him. However, Republicans are divided over whether Trump is hard to like: 49% say he is, compared with 50% who say he is not.

Democrats and Democratic leaners are largely critical in their assessments of Trump’s traits and characteristics. Fewer than half say that Trump is patriotic (42%) and just 28% say that he is a strong leader. Fewer than two-in-ten say any other positive characteristic included in the survey describes Trump.

At the same time, large majorities of Democrats say that Trump has poor judgment (87%), is reckless (87%) and is hard to like (85%).

Most say Trump has done too little in distancing from white nationalists

In response to controversial support Trump received during the campaign from some white nationalist groups, 54% of Americans say he has done too little to distance himself from these groups. Fewer (31%) say he has done about the right amount to distance himself from white nationalist groups, while just 6% say he has done too much.

Fully 75% of Democrats say that Trump has done too little to distance himself from white nationalist groups. Most Republicans (57%) say he has done about the right amount to distance himself from the support he received from some white nationalist groups; 31% of Republicans say he has done too little.

Across age groups, those ages 18-29 are the most likely to say Trump has not done enough to distance himself from white nationalist groups: 68% of those under 30 say this, compared with 55% of those ages 30-49, 50% of those 50-64 and 44% of those ages 65 and older.

Those with higher levels of education are more likely than those with lower levels to say Trump has not done enough to distance himself from white nationalist groups. For example, 73% of postgraduates say this compared with 47% of those with no college experience.

Among whites, college graduates are more likely to say Trump has not done enough to distance himself from white nationalists groups (64%) than to say he has done about the right amount (28%). Among whites who have not graduated from college, about as many say Trump has not done enough (46%) as say he has done about the right amount (43%).

Concerns about Trump and conflicts of interest

A majority of the public says they are concerned that Trump has relationships with organizations, businesses or foreign governments that conflict with his ability to serve the country’s best interests.

Overall, 65% say they are either very (45%) or somewhat (20%) concerned that Trump’s ties to groups conflict with his ability to serve the country’s best interests; 34% say they are not too (14%) or not at all (20%) concerned about this.

Democrats are far more likely to express concern on this issue than Republicans. Seven-in-ten Democrats and Democratic leaners say they are very concerned that Trump’s relationships could conflict with his ability to serve the country’s best interests; an additional 22% are somewhat concerned.

By contrast, most Republicans and Republican leaners (68%) say they are not too (27%) or not at all (41%) concerned about Trump’s ties. About three-in-ten (31%) are at least somewhat concerned that Trump’s relationships conflict with his ability to serve.

Among Republicans, those ages 18-49 are about twice as likely as those 50 and older to say they are at least somewhat concerned that Trump’s relationships conflict with his ability to serve the country’s best interests (46% vs. 21%).

Views of the role Trump’s adult children will play in administration

After playing a prominent role in his general election campaign, the public has mixed views on how much influence Trump’s adult children will have within his administration. Overall, 39% say they will have too much influence, while an identical 39% say they will have about the right amount of influence. Relatively few (15%) say that Trump’s adult children will have too little influence on his administration.

Two-thirds of Republicans and Republican leaners (66%) say Trump’s adult children will have about the right amount of influence in his administration. By contrast, 59% of Democrats and Democratic leaners think they will have too much influence.

Among Democrats, college graduates are much more likely than those with no college degree to say that Trump’s adult children will have too much influence in his administration (81% vs. 47%). Among Republicans, there is little difference in views on this question across levels of education.

2. Discrimination and conflicts in U.S. society

The public makes clear distinctions in assessing the extent to which some groups in the society face discrimination today. A large majority of Americans (82%) say Muslims in the United States face discrimination – with 57% saying they face “a lot” of discrimination.

But majorities also say that gays and lesbians (76%), blacks (76%), Hispanics (70%) and women (60%) face at least some discrimination. Fewer Americans say Jews (44%), evangelical Christians (42%) or whites (38%) face a lot or some discrimination.

Democrats are much more likely than Republicans to say blacks, Muslims, Hispanics, gays and lesbians and women face discrimination in society today. By contrast, Republicans are somewhat more likely than Democrats to see discrimination against evangelical Christians and whites.

Overwhelming shares of Democrats and Democratic leaners say Muslims (89%), blacks (88%), gays and lesbians (86%) and Hispanics (82%) face a lot or some discrimination in society today. And most Democrats say there is a lot of discrimination (as opposed to just some) against Muslims (69%), blacks (57%) and gays and lesbians (55%).

Smaller majorities of Republicans and Republican leaners say there is at least some discrimination against Muslims (73%), blacks (61%), gays and lesbians (64%), and Hispanics (55%). Unlike Democrats, however, fewer than half of Republicans say Muslims face a lot of discrimination (40%), while just 29% say this about gays and lesbians and only 20% say blacks face a lot of discrimination.

Three-quarters of Democrats say there is at least some discrimination against women in society today, including 33% who see a lot of discrimination. Just 43% of Republicans say women face a lot or some discrimination, with just 10% saying a lot.

Democrats also are more likely than Republicans to say Jews in this country face at least some discrimination (49% vs. 34%).

Half of Republicans say there is a lot or some discrimination against evangelical Christians; 21% see a lot of discrimination against evangelicals. Just 33% of Democrats say evangelicals are discriminated against, with 9% saying they face a lot of discrimination.

Republicans also are far more likely than Democrats to say whites in the U.S. face discrimination: 49% of Republicans say there is at least some discrimination against whites, compared with 29% of Democrats.

Over the last three years, the public has become more likely to say blacks and Muslims face a lot of discrimination in society.

In 2013, when asked a similarly worded question using the term “African Americans” rather than blacks, 22% said African Americans faced a lot of discrimination. In the current survey, 41% say blacks face a lot of discrimination today.

Views have shifted dramatically among Democrats and Democratic leaners: 28% said African Americans faced a lot of discrimination in 2013, compared with 57% who say this about blacks today. There has been less change in views on this question among Republicans and Republican leaners (from 11% in 2013, to 20% in 2016).

The public also sees more discrimination against Muslims today than in 2013. Overall, 57% say Muslims face a lot of discrimination today, up from 45% in 2013 (the 2013 survey used slightly different wording and asked about “Muslim Americans”). Over the past three years, Democrats have become 13 points more likely say there is a lot of discrimination against Muslims, while Republicans have become 9 points more likely to say this.

The shares of the public seeing a lot of discrimination against women (23% now, 15% then) and Hispanics (32% now, 25% then) have also edged higher since 2013.

Views of group conflict in U.S. society

The public views conflicts in the U.S. between Republicans and Democrats as much more intense than those between other groups, including rich people and poor people, blacks and whites, and immigrants and those born in in the U.S.

Fully 85% say there are very strong (56%) or strong (29%) conflicts between Republicans and Democrats in the U.S. Just 12% say there are not very strong conflicts (9%) or no conflicts (3%) between partisans. Republicans and Democrats are the only groups included in the survey for which a majority of Americans say there are very strong conflicts.

Most also see at least strong conflicts in the country between blacks and whites (66%), though just 26% describe these conflicts as very strong.

There is a similar pattern in views of the amount of conflict between rich people and poor people and between immigrants and those born in the U.S. Overall, 63% say there are at least strong conflicts between rich people and poor people, though just 30% describe them as very strong. When it comes to conflicts between immigrants and people born in the U.S., 59% say there are either very strong (24%) or strong (35%) conflicts between these two groups.

Amid discussion regarding the new administration and possible changes to Medicare and Social Security, relatively few see conflicts between young people and older people: 40% see at least strong conflicts, including just 13% who see very strong conflicts.

And while a wide gap emerged between those with and without a college degree in 2016 presidential voting preferences, the public does not see widespread conflicts between the two groups: 37% see very strong (10%) or strong (26%) conflicts between those with a college degree and those who did not go to college. Similarly, fewer than half (40%) say there are very strong (13%) or strong (27%) conflicts between people who live in cities and people who live in rural areas.

Republicans and Democrats are equally likely to see strong conflicts between their respective partisan groups, but they differ in other assessments, with Democrats more likely than Republicans to see conflict across a range of groups.

Large majorities of Republicans and Republican leaners (88%) and Democrats and Democratic leaners (87%) say there are very strong or strong conflicts between Republicans and Democrats in the country today.

When it comes to differences between rich people and poor people in the country, fully 75% of Democrats and Democratic leaners say there are very strong or strong conflicts between these two groups, compared with fewer Republicans and Republican leaners (50%) who say the same.

Most Democrats also say there are very strong or strong conflicts between blacks and whites (73%) and immigrants and those born in the U.S. (64%). Somewhat smaller majorities of Republicans see at least strong conflicts between these two sets of groups (59% and 55%, respectively).

Overall, 47% of Democrats say there are very strong or strong conflicts between people with a college degree and those who did not go to college; just 24% of Republicans agree. Democrats also are more likely than Republicans to see at least strong conflicts between people who live in cities and people who live in rural areas and younger people and older people, though fewer than half of both Republicans and Democrats say there are very strong or strong conflicts between these two sets of groups.

There has been a sharp rise over the past four years in the share saying there are deep conflicts between blacks and whites.

In December 2012, 39% of the public said there were very strong (11%) or strong (28%) conflicts between blacks and whites in the U.S. Since that time – a period that saw several high-profile police shootings of African Americans, the emergence of the Black Lives Matter movement and the 2016 presidential election campaign – the share who say there are very strong or strong conflicts between the two groups has risen to 66%.

Democrats and Democratic leaners (73%) are somewhat more likely than Republicans and Republican leaners (59%) to say there are at least strong conflicts between blacks and whites. Both Republicans and Democrats are significantly more likely to say this today than in 2012.

The share who see very strong or strong conflicts between young people and older people has increased from 29% in 2012 to 40% in the current survey. The share of Democrats who see at least strong conflicts between age groups is up 14 points from 2012 (to 44%), while the share of Republicans who say this is up 11 points over the last four years (to 37%).


3. Political values: Government regulation, environment, immigration, race, views of Islam

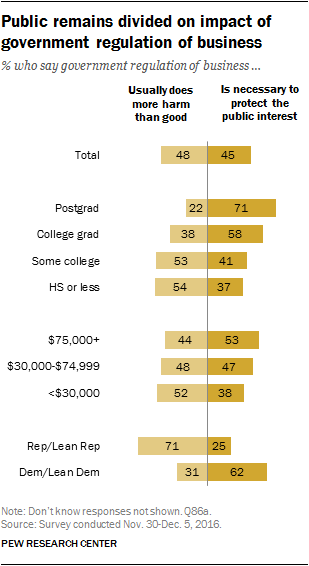
The public remains divided over government regulation of business. While 45% say regulation is necessary to protect the public interest, about as many (48%) say government regulation of business usually does more harm than good.

As in the past, Republicans and Democrats take opposing views of government regulation: 71% of Republicans and Republican-leaning independents think government regulation of business does more harm than good, while just a quarter (25%) think it’s necessary to protect public interest. By contrast, 62% of Democrats and leaners think business regulation is necessary; about a third (31%) think it does more harm than good.

There are significant differences in opinion by education and income. A 71% majority of those with postgraduate degrees think business regulation is necessary to protect the public, along with 58% of those with a college degree. More than half (54%) of those with some college education or less say government regulation of business does more harm than good. These educational differences have grown somewhat more pronounced over the last year.

Majority of Americans say environmental regulations are worth the cost

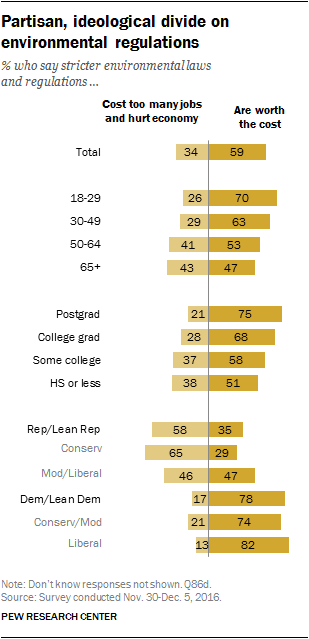
More Americans continue to say stricter environmental laws and regulations are worth the cost (59%) than to say they cost too many jobs and hurt the economy (34%).

Nearly eight-in-ten Democrats and Democratic leaners (78%), including large majorities of both liberal (82%) and conservative and moderate Democrats (74%), say environmental laws are worth the cost.

Among Republicans, however, there are striking ideological differences. Overall, 58% of Republicans say stricter environmental regulations cost too many jobs and hurt the economy, while 35% say they are worth the cost. But by a roughly two-to-one margin (65% vs. 29%) conservative Republicans and leaners are more likely to say stricter environmental laws and regulations cost too many jobs and hurt the economy rather than that they are worth the cost. Moderate and liberal Republicans are more divided on this issue: 46% think environmental regulations cost too many jobs and hurt the economy, 47% say they are worth the cost.

Age and education are strongly associated with these views. Younger adults and those with higher levels of education are more likely than older adults and those with less education to say environmental regulations are worth the cost.

The state of equal rights

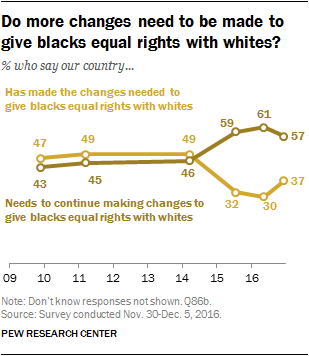
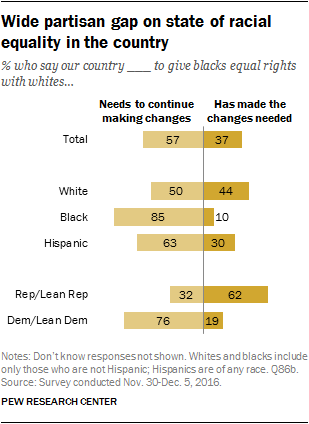
A 57% majority of Americans say the country needs to continue making changes to give blacks equal rights with whites, while 37% think the country has made the changes needed to give blacks equal rights with whites.

More now say the necessary changes have been made to give blacks equal rights than said this earlier this year (37% today, 30% in May). However, that share remains far lower than it was in prior years (for instance, 49% said this in March 2014).

As has been the case, a wide majority of blacks (85%) think the country needs to continue to make changes to achieve racial equality, as do a majority of Hispanics (63%). About half of whites (50%) think the country needs to continue to make changes, while 44% think the country has made the needed changes to achieve equality.

The partisan divide on this subject remains wide. Roughly three-quarters of Democrats and leaners (76%) say the country needs to continue to make changes to give blacks equal rights with whites, while just 19% think the needed changes have been made. Democratic views are little changed over the course of the last year.

By contrast, a 62% majority of Republicans think the necessary changes for racial equality have been made, while about a third (32%) think changes still need to be made. Republicans are now more likely to say the necessary changes have been made than they were earlier this year: This spring, only about half of Republicans (53%) said this.

Most say immigrants strengthen the country

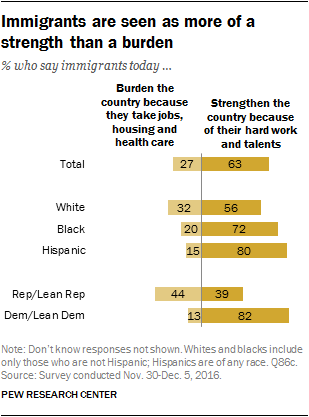
About six-in-ten Americans (63%) now say immigrants strengthen the United States because of their hard work and talents, while 27% say immigrants are a burden on the country because they take jobs, housing and health care. The share of Americans who see immigrants as more of a strength than a burden is now at its highest level in more than twenty years of Pew Research Center surveys.

The stark partisan differences in opinion on how immigrants impact the nation are little changed over the course of the last year. Today, an overwhelming share of Democrats and leaners (82%) think immigrants strengthen the country with their hard work and talents, while just 13% say they are a burden. By contrast, Republicans are more divided: Roughly as many (44%) say immigrants are more of a burden on the country because they take jobs, housing and health care as say they strengthen the country because of their hard work and talents (39%).

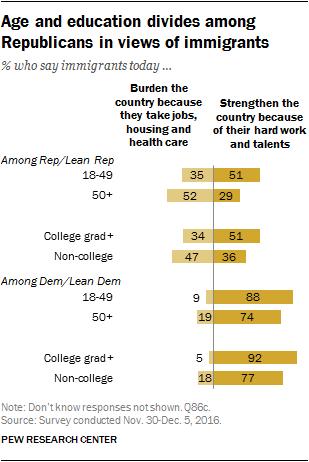
There are key demographic differences within the Republican Party, however. About half of Republicans under the age of 50 say immigrants strength the country (51%), while fewer say they are a burden (35%). For older Republicans, the balance of opinion is the reverse: More say immigrants burden the country (52%) than say they strengthen it (29%).

Similarly, Republicans with a college education are more likely to say immigrants strengthen the country than say they burden the U.S. (51% vs. 34%). By contrast, Republicans without a college degree are more likely to say immigrants burden the country because they take jobs, housing and health care (47% vs. 36%).

There are only modest demographic differences among Democrats; wide majorities across age and education groups say immigrants strengthen the country because of their hard work and talents.

Perceptions of whether Islam is more violent than other religions

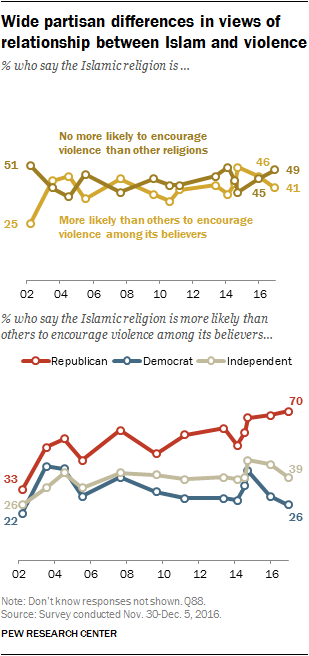
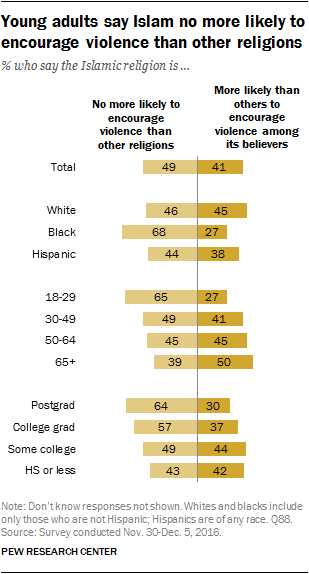
About half of Americans (49%) say that the Islamic religion is no more likely than other religions to encourage violence, while about four-in-ten (41%) say Islam is more likely than others to encourage violence among its believers. Public views have been closely divided on this question for more than a decade, but the belief that Islam encourages violence more than other religions has ticked down to its lowest level since mid-2014.

Republicans and Democrats are more polarized than ever on this question: Seven-in-ten Republicans (70%) now think the Islamic religion is more likely than others to encourage violence among its believers; only about a quarter of Democrats (26%) and 39% of independents say the same.

Among independents, the views of those who lean toward the Democratic Party are similar to those of Democratic identifiers (26% of both groups say Islam is more likely than other religions to encourage violence). There is a much more pronounced gap between Republican identifiers and Republican-leaning independents: 70% of Republican identifiers think Islam is more likely to encourage violence among its believers, compared with about half (52%) of Republican leaners.

There continue to be significant divisions by age, race and education in views of whether Islam encourages violence.

Adults under 30 remain far more likely than those who are older to say the Islamic religion is no more likely than others to encourage violence: About two-thirds (65%) say this, compared with only about a quarter (27%) who think Islam encourages violence more than other religions. By contrast, half of those ages 65 and older think the Islamic religion is more likely to encourage violence among its believers; fewer (39%) think this is not the case.

Those with some college experience or less education are divided on the relationship between Islam and violence: 43% think the religion is more likely to encourage violence than others, while 46% think it is not. That compares with clear majorities of those with postgraduate (64%) and college (57%) degrees that think the Islamic religion is no more likely than others to encourage violence.

Do U.S. efforts abroad help or hurt?

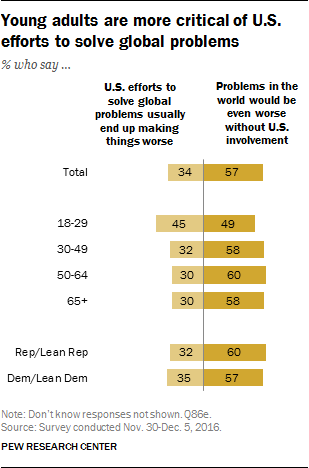
A majority of the public (57%) thinks problems in the world would be even worse without U.S. involvement, while about a third (34%) thinks U.S. efforts to solve problems around the world usually end up making things worse.

Across most demographic and political groups there are only modest differences in these views. And Republicans and Republican-leaning independents and Democrats and Democratic-leaning independents are about equally likely to say that problems in the world would be worse without American involvement (60% and 57%, respectively).

However younger adults are more divided on this question than older Americans: While 49% of those under 30 say problems in the world would be worse without the U.S., roughly as many (45%) think U.S. efforts to solve global problems usually end up making things worse.

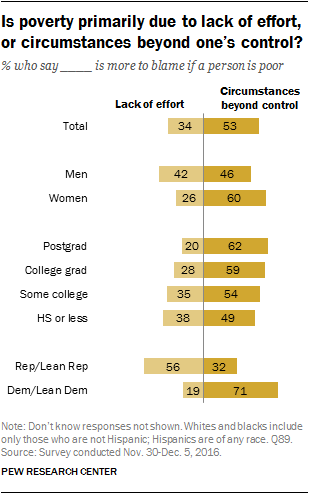
Wide partisan divide over why people are poor

About half of Americans (53%) think circumstances beyond a person’s control are generally more often to blame if a person is poor, while about a third (34%) say lack of effort on their part is more often to blame.

Opinions on this subject vary by gender, education, and party affiliation.

By more than two-to-one, women think circumstances beyond a person’s control are more often to blame for poverty than lack of effort (60% vs. 26%). By contrast, men are more divided on the issue: While 46% think circumstances beyond a person’s control are more often to blame, 42% think a lack of effort is more often the reason.

Those with higher levels of education are more likely than those with less education to attribute blame for poverty to circumstances beyond a person’s control. Six-in-ten of those with a college degree or more education (60%) say this, compared with about half (51%) of those without a college degree.

Democrats overwhelmingly say circumstances beyond a person’s control are more to blame if someone is poor (71% vs. 19% who say lack of effort is more to blame). That compares with a 56% majority of Republicans who think lack of effort is more to blame if a person is poor.

4. Views of the ACA, Medicare and the nation’s economy

As Barack Obama prepares to leave office, the public is divided over a signature policy of his presidency: The Affordable Care Act. Currently, about as many approve of the 2010 health care law as disapprove (48% vs. 47%). The balance of opinion is somewhat more positive today than in October (when 46% approved and 51% disapproved) or April (44% approved, 54% disapproved).

The last time opinion of the 2010 health care law was evenly split was in July 2015, following the Supreme Court’s ruling that upheld the federal government’s ability to provide insurance subsidies through federal exchanges. At that time, 48% said they approved of the law and 49% said they disapproved.

Fully 85% of Republicans disapprove of the ACA, while just 12% approve of it. By contrast, 73% of Democrats approve of the law and just 20% disapprove of it. Democratic support for the law has declined since October, when 82% backed it.

Independents are more supportive of the health care law than at any point in the past six years. In the current survey, 52% of independents approve of the ACA, while 45% disapprove. In October, opinion was nearly the reverse: 41% of independents approved and 54% disapproved of the health care law.

Over the past few months, approval of the health care law has edged higher among young adults.

In late October, those younger than 30 were closely divided over the health care law: 51% approved, while 45% disapproved. Currently, a majority (59%) of those younger than 30 approve of the law, while 38% disapprove. Views of the law among older age groups are little changed from October.

The future of the ACA

As with overall views of the health care law, the public is divided over whether the law should be repealed, expanded or left as it is. As many want Congress to repeal the law as to expand it (39% each), while 15% favor leaving the law as is.

These views are little changed from October, when 44% favored repealing the law, 40% backed its expansion and 13% said lawmakers should leave it as is.

While Republicans remain overwhelmingly in favor of repealing the law, the share favoring repeal has declined from 85% in October to 76% currently.

Support among Democrats for expanding the law has fallen since shortly before the election. Currently, about half (53%) of Democrats say that Congress should expand the ACA, down from 68% in October.

In the wake of the 2016 election, the public has become more skeptical about the ACA’s future.  Currently, 53% say its major provisions will probably be eliminated, while 39% say they are probably are “here to stay.”

In surveys conducted in 2014 and 2015, more said the law’s provisions were likely to be preserved than eliminated. In July 2015, 51% said the law was probably here to stay, while 43% said it would probably be eliminated.

Republicans, whose party leaders have pursued efforts to repeal the health care law, are now 10 points more likely than they were in July 2015 to say that the law will probably be eliminated (53% then, 63% now). Just 32% of Republicans now say that major provisions of the law are probably here stay.

Democrats’ views of the law’s future also have changed substantially. In July of last year, Democrats by a wide margin (60% to 37%) said the ACA’s major provisions were probably here to stay. Today, just 45% of Democrats expect the law’s major provisions to endure, while 49% say they probably will be eliminated.

Views of proposed Medicare changes

Many are unaware of a Republican proposal that would change Medicare into a voucher program in which future participants would be given a credit towards the purchase of private health insurance coverage.

Just 12% say they have heard a lot about the proposal, while 39% have heard a little about it. Nearly half (49%) have either heard nothing about the proposal or offer no opinion.

Older and better-educated adults are more likely than younger people and those with less education to say they have heard at least a little about the proposal to change Medicare. And somewhat more Democrats (60%) than Republicans (51%) and independents (48%) say they have heard at least a little about the idea.

The public is evenly divided between support and opposition towards a proposal to shift Medicare to a voucher style health care coverage program: 43% oppose this change, while 39% favor it and 18% express no opinion either way.

However, the balance of opinion is more negative among the roughly half of adults who have heard about the Medicare proposal: 49% oppose it, while 38% favor it.

Among adults under 30 who have heard of the proposal, more favor (50%) than oppose (34%) it. Among older age groups, there is more opposition than support to the proposed Medicare changes.

Republicans who have heard at least a little about the Medicare proposal favor it by a wide margin (60% to 23%). Two-thirds (67%) of Democrats oppose it, while just 22% favor it.

Republicans who are aware of proposed changes to Medicare are more supportive of the plan than they were in August 2012, when Paul Ryan, the proposal’s primary architect, was named as Mitt Romney’s vice presidential running mate. At that time, 46% of Republicans favored the changes; today, Republican support is 14 percentage points higher (60%). Democrats’ views of the proposal are little changed since 2012.

Medicare voucher proposal more politically divisive than in past

In 2011, when Rep. Paul Ryan (now Speaker Ryan) introduced a Medicare voucher proposal as part of a deficit reduction package, there was little support for the proposal among Republicans or Democrats (34% each).

In the current survey, however, views are far more polarized: 60% of Republicans who are aware of the voucher proposal favor the idea compared with only 22% of Democrats.

Also in 2011, there was evidence that changes like this to Medicare were less popular among older Americans and that these views cut across party lines. Today, that is no longer the case.

A majority of Republicans age 50 and older now favor a Medicare voucher proposal (59%), compared with just 16% of Democrats in this age group.

By contrast, in May 2011, similarly small shares of Republicans age 50 and older and Democrats age 50 and up favored a Medicare voucher idea (31% and 24%, respectively).

Views of the national economy, satisfaction with the state of the nation

For the first time since 2008, more now say economic conditions in the country today are excellent or good (31%) than say conditions are poor (24%); 44% say the economy is only fair.

In the wake of the election, the public’s economic outlook for the coming year is significantly different than it was in June. The share who expect conditions to stay about the same has declined while the share who expect conditions to be better and the share who expect them to be worse have both increased.

Overall, 37% expect economic conditions to be better in a year, up eight points from June (and 17 points from a year ago). At the same time, the share who expect conditions to be worse in a year has also increased: from 13% in June to 28% in the current survey. The share expecting little change in economic conditions in the coming year stands at 33%, down from 54% five months ago.

These overall shifts reflect substantial changes in opinion among partisans. Nearly half of Democrats (49%) now rate economic conditions in this country as excellent or good, up slightly from June. There is little change in the share of Republicans or independents who say the economic conditions are excellent or good.

When it comes to the condition of the economy a year from now, Republicans are more than twice as likely as they were in June to think economic conditions will be better: Fully 75% of Republicans think this now, compared with just 29% in June and 16% one year ago.

Democrats, by contrast, are increasingly pessimistic about next year’s economic conditions: Just 15% of Democrats think conditions will be better in a year, down from 35% who said this in June.

A third of independents (33%) think economic conditions will be better in a year, up 11 points since June.

And while overall national satisfaction is little changed from recent years, there is movement among partisans on this measure.

Overall, a 65% majority of the public is dissatisfied with the way things are going in the country today; 30% are satisfied.

Relatively few Republicans and Republican leaners are satisfied with the way things are going (21%), but this share is up 10 points since October.

Among Democrats and Democratic leaners, national satisfaction has fallen from 52% to 37% over the past two months.

5. Views of Mike Pence

The public holds mixed views of Vice President-elect Mike Pence. Overall, 39% say they have a favorable view of Pence, while about as many (42%) say they have an unfavorable view; 18% are unable to offer a rating of him. Pence is seen less favorably than other recent incoming vice presidents. About six-in-ten had favorable views of Joe Biden in 2009, Dick Cheney in 2001 and Al Gore in 1993.

Overall, 70% of Republicans and Republican leaners view Pence favorably, while just 13% hold an unfavorable view of him. Views among Democrats and Democratic leaners are the reverse: 65% view him unfavorably, compared with just 18% who view him favorably.

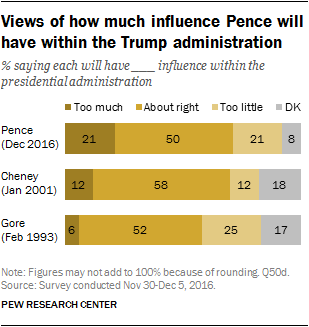
Half of the public says they think Pence will have about the right amount of influence within the Trump administration, while 21% say they think he will have too much influence and an identical 21% think he will have too little influence.

The share saying they expect Pence to have the right amount of influence within the Trump administration is somewhat lower than the share who said this about Dick Cheney’s influence within George W. Bush’s administration in January 2001 (58%), but is about the same as the share who said this about Al Gore’s influence within the Clinton administration in February 1993 (52%).

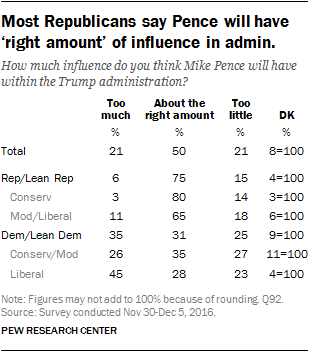
Three-quarters of Republicans and Republican leaners say they think Pence will have about the right amount of influence within the Trump administration; 15% think he will have too little influence and just 6% say he will have too much. Among Democrats and Democratic leaners, about as many say he will have too much influence (35%) as the right amount (31%); 25% say he will have too little influence.

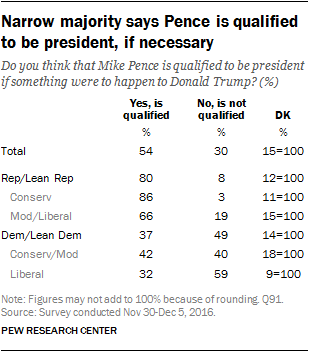
Overall, 54% of the public says that Pence is qualified to be president, if something were to happen to Donald Trump; 30% say he is not qualified, and 15% do not offer an opinion.

Eight-in-ten Republican and Republican leaners say that he is qualified to be president. By contrast, more Democrats and Democratic leaners say he is not qualified to serve (49%) than say he is qualified (37%).

6. Awareness of election results

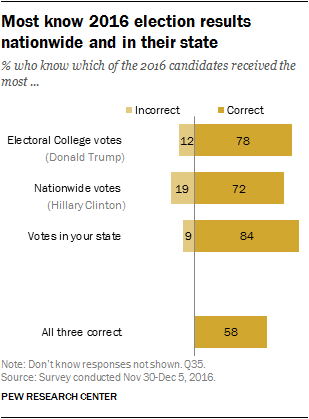
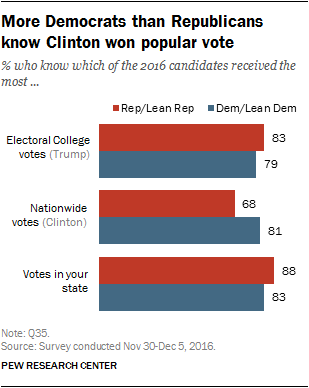
In the wake of Trump’s victory, most Americans are able to correctly identify which candidate won the most Electoral College votes, most individual votes nationwide and the most votes in the state they live in.

About eight-in-ten (78%) correctly identify Trump as the candidate who received the most Electoral College votes. Most also correctly identify Hillary Clinton (72%) as the candidate who won the most individual votes nationwide. A slightly larger majority (84%) can correctly identify the candidate who received the most votes in the state where they live. Taken together, 58% of the public correctly responds to all three questions and can name the candidate who won the Electoral College, the popular vote and their home state.

Following the 2000 election between George W. Bush and Al Gore, 78% could identify Gore as the candidate who won the popular vote in January 2001; this is slightly higher than the 72% who identify Clinton as the winner of the popular vote in the current survey.

Those who live in states Trump won and those who live in states that Clinton won are equally knowledgeable about which candidate won their home state. Fully 85% of those currently living in states where Trump won correctly say he received the most votes in their state; 83% of those living in states where Clinton won say that she received the most votes in their state.

There is a significant partisan divide in knowledge of which candidate won the popular vote. About eight-in-ten Democrats and Democratic leaners (81%) say that Clinton won the most votes nationwide, compared with a smaller 68%-majority of Republicans and Republican leaners.

There is not much of a knowledge gap when it comes to the Electoral College vote and the vote count in a respondents’ home state.

Comparable majorities of Republicans (88%) and Democrats (83%) correctly identify the candidate who won the most votes in their home state. Similarly, most Republicans (83%) and Democrats (79%) know Trump won the most Electoral College votes.

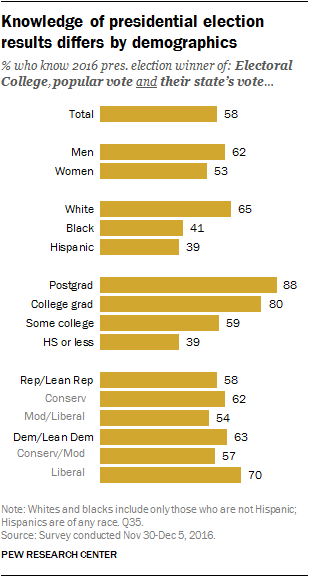
There are significant demographic differences in the share who answer all three of the election results questions correctly.

Men (62%) are more likely than women (53%) to know which candidate received the most votes nationwide (Clinton), the most Electoral College votes (Trump) and which candidate won their state.

About two-thirds of white respondents (65%) are able to answer all three questions correctly; only about four-in-ten blacks (41%) and Hispanics (39%) get all three questions right.

There are wide differences in election knowledge by levels of education. Nearly nine-in-ten postgraduates (88%) answer all three questions correctly, compared with 80% of college graduates, 59% of those with some college experience and 39% of those with no more than a high school diploma.

About as many Democrats and Democratic leaners (63%) as Republicans and Republican leaners (58%) get all three election results questions rights. Within both parties there are divides by ideology. Among Democrats, 70% of liberals answer all three questions correctly compared with 57% of those who describe themselves as moderate or conservative. Among Republicans, 62% of conservatives know which candidate won the most Electoral College votes, the popular vote and their home state, compared with 54% of moderate and liberal Republicans.

Methodology

The analysis in this report is based on telephone interviews conducted November 30-December 5, 2016 among a national sample of 1,502 adults, 18 years of age or older, living in all 50 U.S. states and the District of Columbia (375 respondents were interviewed on a landline telephone, and 1,127 were interviewed on a cell phone, including 664 who had no landline telephone). The survey was conducted under the direction of Abt SRBI. A combination of landline and cell phone random digit dial samples were used; both samples were provided by Survey Sampling International. Interviews were conducted in English and Spanish. Respondents in the landline sample were selected by randomly asking for the youngest adult male or female who is now at home. Interviews in the cell sample were conducted with the person who answered the phone, if that person was an adult 18 years of age or older. For detailed information about our survey methodology, see https://alpha.pewresearch.org/pewresearch-org/methodology/u-s-survey-research/

The combined landline and cell phone sample are weighted using an iterative technique that matches gender, age, education, race, Hispanic origin and nativity and region to parameters from the 2014 Census Bureau’s American Community Survey and population density to parameters from the Decennial Census. The sample also is weighted to match current patterns of telephone status (landline only, cell phone only, or both landline and cell phone), based on extrapolations from the 2015 National Health Interview Survey. The weighting procedure also accounts for the fact that respondents with both landline and cell phones have a greater probability of being included in the combined sample and adjusts for household size among respondents with a landline phone. The margins of error reported and statistical tests of significance are adjusted to account for the survey’s design effect, a measure of how much efficiency is lost from the weighting procedures.

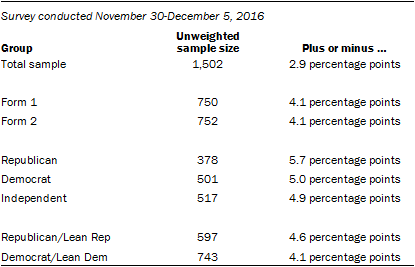
The following table shows the unweighted sample sizes and the error attributable to sampling that would be expected at the 95% level of confidence for different groups in the survey:

Sample sizes and sampling errors for other subgroups are available upon request.

In addition to sampling error, one should bear in mind that question wording and practical difficulties in conducting surveys can introduce error or bias into the findings of opinion polls.

Pew Research Center undertakes all polling activity, including calls to mobile telephone numbers, in compliance with the Telephone Consumer Protection Act and other applicable laws.

Pew Research Center is a nonprofit, tax-exempt 501(c)(3) organization and a subsidiary of The Pew Charitable Trusts, its primary funder.