Pew Research Center

FOR RELEASE OCTOBER 27, 2016

As Election Nears, Voters Divided Over Democracy and ‘Respect’

Trump seen as lacking respect for women, minorities, democracy

FOR MEDIA OR OTHER INQUIRIES:

Communications Department
202.419.4372
www.pewresearch.org

RECOMMENDED CITATION

Pew Research Center, October 2016, "As Election Nears, Voters Divided Over Democracy and ‘Respect’"

About Pew Research Center

Pew Research Center is a nonpartisan, nonadvocacy fact tank that informs the public about the issues, attitudes and trends shaping the world. It does not take policy positions. The Center conducts public opinion polling, demographic research, computational social science research and other data-driven research. It studies politics and policy; news habits and media; the internet and technology; religion; race and ethnicity; international affairs; social, demographic and economic trends; science; research methodology and data science; and immigration and migration. Pew Research Center is a subsidiary of The Pew Charitable Trusts, its primary funder.

© Pew Research Center 2026

Table of contents

  • About Pew Research Center
  • As Election Nears, Voters Divided Over Democracy and ‘Respect’
  • 1. Views of the candidates
  • 2. Factors underlying voter preferences, positive and negative voting
  • 3. Views of candidate ‘insults,’ criticism and political divisions
  • 4. How voters view Clinton and Trump’s respect for men and women, racial and religious groups
  • 5. Confidence in election, views of U.S. democracy
  • 6. Views of domestic issues: race, immigration, health care, abortion, Supreme Court
  • 7. Opinions on U.S. international involvement, free trade, ISIS and Syria, Russia and China
  • 8. The state of the parties, Obama approval
  • Methodology

As Election Nears, Voters Divided Over Democracy and ‘Respect’

Trump seen as lacking respect for women, minorities, democracy

As the presidential campaign enters its final days, opinions about American democracy and the candidates’ respect for democratic institutions – as well their respect for women, minorities and other groups in society– have emerged as political flashpoints.

Donald Trump is widely seen as having little or no respect for Muslims, women, Hispanics and blacks. Moreover, 56% of registered voters say that Trump has little or no respect for the “nation’s democratic institutions and traditions,” compared with 43% who say he has a great deal or fair amount of respect for democratic institutions and traditions.

Far more voters think Hillary Clinton respects women, minorities and the nation’s democracy. And nearly twice as many describe Clinton as “well-qualified” than say that about Trump (62% vs. 32%). Yet concerns over Clinton’s honesty persist, and just 35% say that, if elected, she would make a good or great president; even fewer (27%) think Trump would make a good or great president. These views have changed little over the course of the campaign.

The latest survey by Pew Research Center, conducted Oct. 20-25 among 2,583 adults, including 2,120 registered voters, finds broad agreement about the importance of some aspects of democracy, such as fair and open elections. But there are sharp divisions over whether other aspects are very important to maintaining a strong democracy – notably, that losers of elections recognize the legitimacy of the winners and that news organizations are free to criticize politicians.
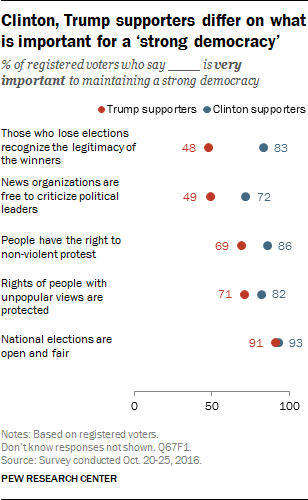
Overwhelming majorities of Clinton (93%) and Trump (91%) backers say it is very important that national elections be open and fair. Large majorities of both groups also say it is very important that the rights of people who hold unpopular views be protected (82% of Clinton supporters, 71% of Trump supporters).

However, Clinton supporters (86%) are more likely than Trump supporters (69%) to say it is very important that people have a right to non-violent protest.

And while sizable majorities of both Clinton and Trump supporters view electoral concessions as important, Clinton backers (83%) are far more likely than Trump supporters (48%) to see this as very important.

Trump voters also are far less likely to say that the freedom of the press to criticize political leaders is essential to maintaining a strong democracy. Only about half of Trump supporters (49%) view this as very important, compared with 72% of Clinton supporters.

While Trump voters attach great importance to fair and open elections, they are skeptical that the upcoming election will meet this standard. Just 43% have a great deal or fair amount of confidence the presidential election will be “open and fair,” while 56% have not too much confidence or no confidence at all that this will occur. More than twice as many Clinton supporters (88%) as Trump supporters are confident that the upcoming election will be open and fair.

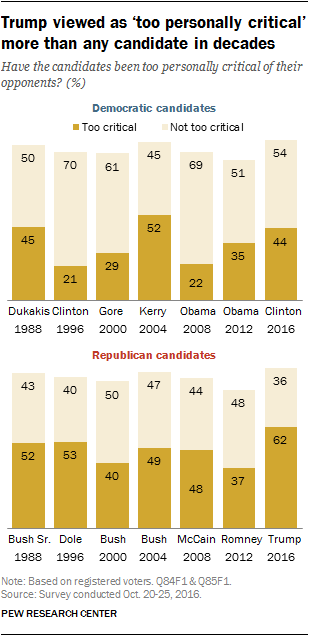
The survey finds considerable evidence of the bitterness unleashed by the presidential campaign. Dating back to 1988, no candidate, Democrat or Republican, has been viewed as more critical of their opponent than is Trump today (the question was not asked in 1992).

Currently, 62% of voters say Trump has been too personally critical of Clinton, which is about 10 percentage points higher than the previous peak (53% said that about Bob Dole in 1996, 52% for John Kerry in 2004). Just 36% say he has not been too critical of Clinton.

By comparison, 44% say Clinton has been too personally critical of her opponent, which is higher than the share saying that about Barack Obama during either of his campaigns.

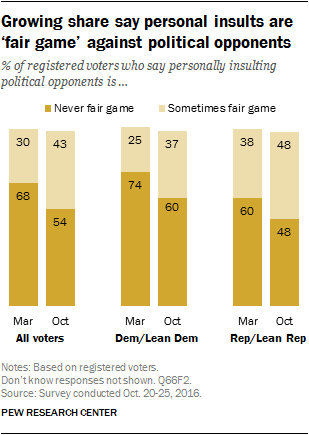
An increasing share of voters believes that insulting political opponents is “sometimes fair game.” Most voters (54%) say it is “never fair game” for politicians to insult their opponents, but 43% say insults are sometimes acceptable, up from 30% in March during the presidential primaries.

Among voters in both parties, more view political insults as acceptable than did so in the spring. Today, 48% of Republican and Republican-leaning registered voters say insulting opponents is sometimes fair game, up from 38% in March. By comparison, 37% of Democrats say political insults are sometimes justifiable, a 12-percentage-point increase since then.

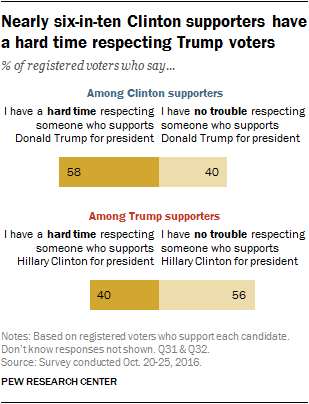
Meanwhile, most Clinton supporters not only take a dim view of Trump, but say they have a hard time respecting the people who support the Republican nominee. Nearly six-in-ten Clinton supporters (58%) say they “have a hard time respecting someone who supports Donald Trump for president.” Just 40% say they have “no trouble” respecting someone who backs Trump.

Trump supporters are less likely to say they have difficulty respecting Clinton voters. Four-in-ten (40%) say they have a hard time respecting Clinton voters, while 56% say they have no trouble doing so.

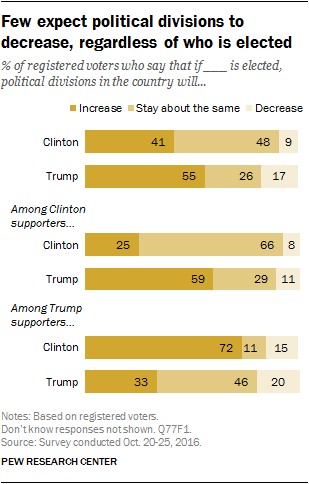
Most voters expect current political divisions to persist after the election, no matter who is elected president. Just 17% of all voters expect the nation’s political divisions to decrease if Trump is elected. Most say they will increase (55%) or stay the about same (26%). Even fewer voters (9%) say political divisions will lessen if Clinton becomes president; 41% say divisions will increase if she is elected, while 48% say they will stay about the same.

How much do the candidates respect women, other groups?

Majorities of voters say Trump has a great deal or fair amount of respect for several groups in the population, including men (82% great deal/fair amount), white people (83%), veterans (63%), blue-collar workers (58%) and evangelical Christians (59%).

But fewer than half of voters say Trump has a great deal or a fair amount of respect for blacks (42%), women (38%), Hispanics (35%) and immigrants (30%). In each case, majorities say he has little or no respect for these groups.

Majorities of both men (58%) and women voters (62%) say Trump has little or no respect for women, but women are more likely than men to say that Trump has no respect for women (43% vs. 29%).

Just 28% of voters say Trump has a great deal or fair amount of respect for Muslims – and nearly half of voters (47%) say he has no respect at all for them.

Overall, majorities say Trump has a great deal or fair amount of respect for just five of the 12 groups included in the survey. By contrast, majorities say Clinton has a great deal or fair amount of respect for 10 of the 12 groups.

The gaps in perceptions of Clinton’s and Trump’s respect for Muslims, women, immigrants and Hispanics are striking: More than twice as many voters say Clinton has at least a fair amount of respect for each of these groups than say the same about Trump.

More voters say Trump respects men than say that about Clinton (82% vs. 65%). And while 59% say Trump has a great deal or fair amount of respect for evangelical Christians, fewer say the same about Clinton (51%).

Both Clinton and Trump get low marks from voters for how much they respect the opponent’s supporters. Only about a quarter of voters (28%) say Clinton has a great deal or fair amount of respect for people who support Trump; more than twice as many say she has little or no respect for Trump voters. Views of Trump’s respect for Clinton voters are fairly similar: 26% think he has at least a fair amount of respect for Clinton voters, while 71% think he has little or no respect for them.

Views of the candidates: traits and issues

With less than two weeks to go before the election, 46% of registered voters favor Hillary Clinton or lean toward Clinton, while 40% support Trump or lean toward Trump; 6% back Libertarian Gary Johnson, while 3% support Green Party nominee Jill Stein. Earlier this month, Pew Research Center announced it will not be producing likely-voter estimates of the race or making a final projection of the popular vote. This report is based on registered voters or, in some cases, the general public.

Most Clinton voters now say they consider their choice a vote “for Clinton” rather than “against Trump” (57% vs. 41%). But just 45% of Trump supporters say they are mostly voting “for” him. In the prior four election cycles, majorities of GOP candidates’ supporters viewed their vote more in positive, rather than negative terms.

Overall, Clinton is viewed much more positively than Trump on several key character traits: Far more voters describe her as well-qualified than say that about Trump (62% vs. 32%), and the gap is nearly as wide in perceptions of whether each is “reckless.” Roughly seven-in-ten (69%) describe Trump as reckless, compared with 43% who say this word describes Clinton.

About half of voters (49%) say Clinton is a “good role model,” compared with 25% who describe Trump this way. More also view Clinton than Trump as “moral” (43% vs. 32%).

However, just 33% say Clinton is honest; a slightly larger share (37%) say this term applies to Trump. And sizable majorities say two negative descriptions – hard to like and having poor judgment – characterize both Clinton and Trump.

There is only one trait, among 10 included in the survey, on which majorities view both candidates positively: An equal share say Clinton and Trump are patriotic (61%).

Clinton has sizable advantages on several issues, though Trump runs even with her in dealing with the economy, terrorism, trade and crime.

Majorities of voters say Clinton would do a better job on race relations (62% vs. 30% for Trump), making wise decisions on foreign policy (56% vs. 37%), dealing with health care (55% vs. 40%) and selecting Supreme Court justices (55% vs. 42%).

Trump holds a significant advantage on only one issue: 49% say he would do a better job of reducing special interest influence.

Other important findings

GOP voters see a divided party. In the view of most voters – including most Republicans – the GOP will face the election deeply divided. Fully 80% of registered voters say the party is mostly divided in its views on issues and vision for the future, while just 17% say it is mostly united. Seven-in-ten Republican and Republican-leaning voters say the GOP is mostly divided, as do 89% of Democrats.

ACA continues to be divisive. Currently, 45% of voters approve of the 2010 health care law, while 53% disapprove. For more on the health care law, including views on whether Congress should repeal or expand it, see Pew Research Center’s Fact Tank blog.

Trump voters more likely to view Russia as “not much of a problem.” Similar shares of Clinton and Trump supporters view Russia as an adversary (29% of Clinton supporters, 24% of Trump supporters), but Clinton backers are 13 percentage points more likely to say Russia is a serious problem (53% vs. 40%). And while 30% of Trump supporters say Russia is not much of a problem, only 13% of Clinton backers say the same.

Majority says abortion should be legal in all or most cases. Overall, 61% of voters say abortion should be legal in all or most cases, while 36% say it should be illegal in at least most cases. About eight-in-ten Clinton supporters (82%) say abortion should be mostly legal; a smaller majority of Trump supporters (60%) say abortion should be illegal in all or most cases, while 36% think it should be mostly legal.

Clinton being held to higher standard because of her gender? About half of voters (51%) say that Clinton’s gender has not been a factor in how she has been treated during the campaign; 30% say she is being held to a higher standard than past presidential candidates because she is a woman, while just 17% say she is being treated less critically. Overall, women (38%) are somewhat more likely than men (22%) to say Clinton is being held to a higher standard.

Obama job approval at 54%. Obama’s job rating among the general public is little changed from August (53%), but stands at its highest point since December 2012, a month after he won reelection. Obama’s job rating has been in positive territory for most of this year.

1. Views of the candidates

Less than two weeks before Election Day, voters remain skeptical that either Clinton or Trump would make a good president; and there has been no improvement in views of their potential presidencies over the course of the 2016 campaign.

Just 35% say that Hillary Clinton would make a great (8%) or a good (27%) president, while 20% say she would be average and 45% say she would be either a poor (11%) or terrible (34%) president.

Views of a possible Donald Trump presidency are even more negative: 56% think he would be either poor (11%) or terrible (44%), compared with 27% who say he would be a good (17%) or great (9%) president (just 16% say he would be average).

Opinions about Clinton and Trump as possible presidents have changed little over the course of the 2016 campaign, and voters’ expectations for either candidate are no more positive today than they were in January.

Clinton and Trump supporters have positive views of their candidates as potential presidents, but few think they will make great presidents. Just 16% of Clinton supporters say she would be a great president, while 56% say should be good and 26% think she would be average. Among Trump supporters, 22% say he would make a great president, 41% good and 29% average.

Traits and characteristics

Voters are highly critical of both Clinton and Trump in two key respects: Majorities of registered voters describe each as “hard to like,” and say each has “poor judgment.”

Nearly six-in-ten (59%) say Clinton is hard to like, while almost as many (56%) say she possesses poor judgment. Even greater shares describe Trump as hard to like (70%) and having poor judgment (65%).

While these views are very negative, voters also refrain from rendering positive judgments on Clinton and Trump on some traits – particularly when it comes to their honesty. Just 33% of voters describe Clinton as honest, while slightly more (37%) say this describes Trump.

On several traits and characteristics, Clinton is more highly regarded than Trump. But Clinton’s own evaluations are not all that positive. About half (49%) say she is a good role model, which is nearly double the share saying that about Trump (25%).

Fewer than half say Clinton is moral (43%) and inspiring (42%), but only about third find Trump moral (32%) and inspiring (35%).

Voters see Clinton’s major strength as her qualifications. About six-in-ten (62%) say she is well-qualified, compared with just 32% who say the same of Trump. And far fewer describe Clinton as reckless (43%) than say that about Trump (69%).

Roughly half of voters say Clinton (52%) is “a strong leader,” while somewhat fewer describe Trump in this way (46%).

The one characteristic that voters say Clinton and Trump have in common is patriotism. Identical percentages describe each as patriotic (61%).

How current candidates compare with Obama and McCain

In October 2008, many more voters viewed both Barack Obama and John McCain as honest than say that about Clinton and Trump today.

Eight years ago, majorities described Obama (63%) and McCain (61%) as honest; fewer than four-in-ten say that about Clinton (33%) and Trump (37%) now.

In addition, while majorities say Clinton (56%) and Trump (65%) have poor judgment, fewer voters faulted Obama (29%) and McCain (41%) for poor judgment in October 2008.

On the question of “reckless,” there is no direct comparison to 2008; respondents were asked if Obama and McCain were “risky.” At that time, 49% said Obama was risky, which is somewhat higher than the share who calls Clinton reckless today (43%). Trump is widely viewed as reckless (69%); fewer characterized McCain as risky eight years ago.

More voters say Clinton is well-qualified (62%) than said that about Obama in 2008 (53%). Qualifications were a strong point for McCain – 72% viewed him as well-qualified. Today, fewer than half as many (32%) say Trump is well-qualified.

McCain, like Trump, got relatively low marks for being inspiring: 37% described him as inspiring, which is about the same share that says this applies to Trump today (35%). Obama was widely viewed as inspiring – 71% described him as inspiring in October 2008. Today, just 42% of voters say the same about Clinton.

Views among the candidates’ supporters

Among supporters of Clinton and Trump, substantial shares attribute positive traits to their own candidate, and few describe them negatively. But there are some differences between the two cohorts in how they think of their candidate.

Clinton supporters overwhelmingly say she is a good role model (90%) and well-qualified (97%). While a majority of Trump supporters ascribe the same attributes to him, they are less likely to do so than are Clinton backers: Six-in-ten Trump supporters say their candidate is a good role model, and 76% think of him as well-qualified.

On the other hand, while 80% of Trump supporters think of him as honest, a smaller majority (67%) of Clinton backers say she is honest.

Nearly half of Trump’s supporters (46%) say he is hard to like, while a third describe him as reckless. Smaller shares of Clinton supporters say she is hard to like (32%) or reckless (12%).

While Trump supporters overall describe their candidate positively, views differ between Republicans and Republican-leaning independents who say they supported Trump in the Republican primaries, and those who say they supported another Republican candidate. With the exception of Trump’s patriotism, the gap is at least 30 percentage points across all characteristics.

Republicans who supported him in the primaries are nearly three times as likely as those who supported another candidate (80% vs. 28%) to think of Trump as a good role model. And Trump primary supporters are roughly twice as likely as those who supported another primary candidate to think of Trump as well-qualified (89% vs. 46%) or as moral (85% vs. 40%).

And while a quarter or fewer Republicans who supported Trump in the primaries think of him as reckless or hard to like, majorities of Republicans who supported other candidates ascribe these negative traits to him. Nearly six-in-ten (59%) of those who supported another candidate in the primaries describe him as reckless, compared with just 23% of those who backed Trump for the GOP nomination. Fully 71% of Republicans who supported another candidate in the primaries think of Trump as “hard to like.”

There are striking differences on certain characteristics of Clinton based on primary support as well. Just 40% of those who say they supported Bernie Sanders in the Democratic primary think of Clinton as honest, compared with more than twice as many (83%) of her primary supporters who say the same.

While a majority of those who supported Sanders think of Clinton as inspiring (56%), they are far less likely to think so than those who supported Clinton in the primaries (86%).

Though majorities of Democratic and Democratic-leaning voters who supported Bernie Sanders in the Democratic primary think of Clinton as moral (64%) and a strong leader (75%), these views are more widely held among those who backed Clinton for the Democratic nomination.

Few Democratic voters think of Clinton as “hard to like,” still 42% of Sanders primary supporters see her this way, compared with just a quarter of Clinton primary supporters (25%).

How well do the candidates understand the needs of voters?

When it comes to views on how well the candidates relate to voters, more say Clinton than Trump understands the needs of “people like them” well.

Overall, half of voters say Clinton understands the needs of people like them very or fairly well, compared with 39% who say this about Trump. More voters say Trump understands their needs not at all well (45%) than say this about Clinton (33%).

Identical percentages of Clinton supporters and Trump supporters (88% each) say their own candidate understands their needs very or fairly well. Clinton supporters are somewhat more likely than Trump supporters to say the opposing candidate understands their needs not at all well (79% vs. 69%).

There are demographic differences among both Clinton and Trump supporters in the share who say their candidate understands their needs.

Voters age 50 and over who support Clinton are much more likely than supporters under age 50 to say Clinton understands the needs of people like them very well (56% vs. 26%).

Just 24% of Clinton supporters who say they preferred Bernie Sanders in the Democratic primary elections say she understands their needs very well, compared with 58% of Clinton supporters who also preferred her in the primaries.

There is no gender gap among Clinton supporters on this question: 41% of women and 40% of men say she understands the needs of people like them very well.

Among Trump supporters, 57% of those who say he was their preferred candidate in the Republican primaries say he understands their needs very well; this compares with just 25% of Trump supporters who say they preferred some other Republican primary candidate.

As is the case among Clinton supporters, supporters of Trump who are age 50 and older are more likely than those ages 18-49 to say he understands their needs very well (46% vs. 33%).

About the same share of men (42%) and women (39%) who support Trump say he understands their needs very well.

Voters concerned by candidates’ perceived conflicts of interests

Voters express concern over both Donald Trump and Hillary Clinton’s ability to serve the country’s best interests, if elected. A majority of voters say they are very or somewhat concerned Clinton (62%) or Trump (59%) would have relationships with organizations, businesses or foreign governments that would conflict with their abilities to serve the nation’s best interests. Fewer than two-in-ten voters say they are not at all concerned that Trump (19%) or Clinton (15%) would have conflicts of interest.

Most say the candidates represent the core principles of their parties

Democratic voters overwhelmingly say that Hillary Clinton “represents the core principles and positions that the Democratic Party should stand for.” About eight-in-ten (83%) say she does, while just 14% say she does not.

Three-quarters or more of nearly all Democratic subgroups see Clinton as representative of their party’s core values and policy positions.

On the GOP side, about two-thirds of Republican voters (65%) say that Donald Trump represents the core principles and positions of the GOP, while roughly three-in-ten (31%) do not see Trump as someone who represents what their party should stand for.

Republican voters who have not attended or not completed college are more likely than Republican college graduates to say that Trump represents core Republican principles and issue positions (69% vs. 56%).

The vast majority of conservative Republican and Republican-leaning voters see Trump as representative of what the GOP should stand for (75%), while among moderate and liberal Republicans assessments are more mixed (52% say that he does, 45% say that he does not).

Primary support is strongly related to assessments about whether the candidates represent what their parties should stand for. In particular, among Republican voters many who did not back Trump for the GOP nomination say he does not represent the Party’s principles and positions.

Those who supported Trump in the primaries widely see him as a representative for core Republican principles and positions (85%). Among Republicans who did not back Trump in the primaries, about as many say he does not (46%) represent what the Party should stand for as say he does represent it (50%).

Among Democratic voters, more than nine-in-ten of those who supported Clinton for the nomination (94%) and about three-quarters of Sanders primary backers (74%) now say Clinton represents core Democratic principles and positions.

This represents a shift in views among Sanders supporters over the last several months. Before the party conventions, a CBS/New York Times poll found some skepticism in Sanders supporters’ attitudes about Hillary Clinton. In July, just 48% of Democrats who reported voting for Bernie Sanders in the primary said that Clinton “represents the core principles and values that the Democratic Party should stand for.”


2. Factors underlying voter preferences, positive and negative voting

With less than two weeks to go before the election, 46% of registered voters favor Hillary Clinton or lean toward Clinton, while 40% support Trump or lean toward Trump; 6% back Libertarian Gary Johnson, while 3% support Green Party nominee Jill Stein.

Increasingly, Clinton supporters are viewing their vote in positive terms. A 57% majority of Clinton supporters now consider their choice to be more a vote for her than a vote against Trump (41% say their vote is more a vote against him).

The share of Clinton backers who see their decision as a vote in support of her has ticked up since the summer: In June, 52% of Clinton backers characterized their choice as being more for Clinton, while 45% saw it as a vote more against Trump.

Among Trump supporters, about as many say their choice is a vote against Clinton (51%) as say it is for Trump (45%). There has been little movement in these views since the summer.

Among Clinton supporters, younger voters are less likely than older voters to see their choice in positive terms. About six-in-ten Clinton voters ages 35 and older say they think of their choice more as a vote for Clinton than against Trump. By contrast, only 43% of Clinton supporters under 35 say this, while 56% view it more as a vote against Trump. Among Trump supporters, age differences in these views are less pronounced.

The share of Trump backers who view their voting decision in a negative light is much greater than it was among supporters of most other candidates in recent presidential cycles.

Just 45% of Trump supporters say they are mostly voting “for” him. In elections since 2000, clear majorities of the supporters of GOP candidates have considered their vote more in positive than negative terms. In the two most recent non-incumbent elections, 2000 and 2008, roughly two-thirds of those who supported George W. Bush and John McCain (64% each), respectively, said their choice was a vote in favor of their candidate.

Among recent candidates of either party, only supporters of John Kerry in 2004 were more likely to view their choice as an anti-Bush vote (53% said this) than as a pro-Kerry vote.

Hillary Clinton’s voters are less likely to view their votes in support of her than supporters of Barack Obama were in either 2008 (77%) or 2012 (73%), and somewhat less likely to say this than Al Gore’s backers were in the 2000 election (63%).

Strength of support: how Clinton, Trump compare to prior candidates

Just over half of both Clinton (55%) and Trump backers (56%) say they strongly support their candidate. But levels of strong support were considerably higher among backers of both Obama (68%) and Romney (67%) in 2012, and for most major party candidates in elections dating back to 2000.

The current low shares of backers who strongly support both Clinton and Trump are matched only by Gore’s supporters in 2000 and McCain’s in 2008. Both Obama and Bush, in both their first campaigns and their re-elections, garnered larger shares of strong support from their backers.


How would Clinton compare to Obama, if elected?

If Hillary Clinton is elected president, 56% of voters think she would be “about the same” as president as Barack Obama. About a third (34%) say Clinton would be a worse president than Obama, while 9% say she would be a better president.

Two-thirds of Clinton supporters – 93% of whom approve of Obama’s job performance – think she would be about the same as Obama, if elected president. About as many Clinton supporters say she would be better (16%) as worse (14%) than Obama.

Trump supporters are split on how Clinton would compare to Obama: 51% say she would be a worse president, while 47% say she would be about the same (just 3% say she would be better).

Overall, 61% of women and 50% of men think Clinton would be about the same as Obama, if elected president. Men (41%) are more likely than women (27%) to say Clinton would be a worse president than Obama. Relatively few women (11%) or men (7%) think Clinton would make a better president than Obama, if she were elected.

Among those ages 18-29, nearly as many say Clinton would be a worse president than Obama (46%) as say she would be about the same (49%). Among all older age cohorts, the share saying Clinton would be about the same as Obama far exceeds the share saying she would be worse.

While relatively few Clinton supporters think she would make a worse president than Obama, men (21%) are somewhat more likely to say this than women (10%). And Clinton supporters younger than 50 are about twice as likely as those 50 and older to express this view (20% vs. 8%).

Is Clinton’s gender a factor in campaign?

Asked about the impact of Clinton’s gender on her treatment during the campaign, 51% of voters say that her gender has not been a factor in how she has been treated in the 2016 campaign; 30% say she is being held to a higher standard than past presidential candidates because she is a woman, while just 17% say she is being treated less critically than past presidential candidates because she is a woman.

Half of Clinton supporters say she is being held to a higher standard because she is a woman; 42% say her gender isn’t a factor and just 7% say she is being treated less critically because she is a woman.

Most Trump supporters (57%) say that Clinton’s gender is not a factor; 30% say she is being treated less critically than past presidents because she is a woman, while just 11% say she is being held to a higher standard.

Overall, women (38%) are somewhat more likely than men (22%) to say Clinton is being held to a higher standard because she is a woman; 57% of men and 45% of women say her gender is not a factor.

Among Clinton supporters, women (57%) are much more likely than men (40%) to say that Clinton is being held to a higher standard because of her gender. Among Trump supporters, somewhat more women (15%) than men (7%) think she is being held to a higher standard.

Current voter preferences

With a few weeks left in the campaign, Clinton holds a 6-point lead over Trump among all registered voters: 46% of registered voters support Clinton versus 40% for Trump. Another 6% back Gary Johnson and 3% support Jill Stein. Note: This is based on all registered voters, not likely voters; estimates based on likely voters often differ from registered voters.

As has been the case throughout the general election campaign, there are wide gender, race, age, education and religious divides in presidential vote preference.


Choice of president matters, but fewer feel personal impact

Most voters agree that the stakes of this election are high. A large majority (77%) says that as far as making progress on the important issues facing the country, it really matters who wins the 2016 presidential election. Just 19% say that things will be pretty much the same regardless of who is elected president.

This is a rare point of consensus among Clinton and Trump voters. Wide majorities of both Trump (85%) and Clinton (80%) supporters say it really matters who wins the election.

Voters say the outcome of this election really matters in terms of addressing key issues, but they draw distinctions about how much of a difference who is president makes across different areas.

Large majorities of voters say that who is president makes a big difference on the standing of the United States in the world (80%) and national security (77%). Most also say the president makes a big difference on the mood of the country (67%) and the health of the economy (64%).

However, closer to home, voters see a president as having a more limited impact. Overall, just 42% say that who is president makes a big difference in their own personal life, and even fewer (29%) say this makes a big difference in their local community.

3. Views of candidate ‘insults,’ criticism and political divisions

With a few weeks to go in a 2016 presidential campaign that has witnessed a fair amount of mudslinging, most registered voters (54%) say that “personally insulting political opponents is never fair game” in politics, while 43% say personal insults are “sometimes fair game.”

Six-in-ten Clinton supporters (60%) consider personal insults out of bounds in politics and elections, while 38% say they are sometimes acceptable. In contrast, about half of Trump backers (51%) say that personal insults are sometimes acceptable (44% say they never are).

Among all voters, women (60%) are more likely than men (48%) to think that personal insults in politics are off-limits. The gender gap is particularly pronounced among Trump backers; 59% of men who support Trump say insulting political opponents is sometimes fair game, compared with just 41% of women who back him.

The share of voters who say personal attacks on political opponents are sometimes acceptable has increased since earlier in the campaign: In March, 30% said such personal attacks were sometimes fair game; 43% say this today.

Both Democratic and Republican voters are now more accepting of personal attacks than they were six months ago. Still, most Democratic and Democratic-leaning registered voters continue to say personal insults are out of bounds (60% today, down from 74% in March). By comparison, Republican and Republican-leaning voters are now as likely to say personally insulting one’s opponent is sometimes fair game (48%) as they are to say it never is (48%). In March, six-in-ten Republican voters (60%) said insulting political opponents was never acceptable.

As was the case in March, Republicans who backed Trump in the GOP primary are more likely than those who supported other candidates to say personal insults may be fair game: 61% of Trump’s primary supporters view them as sometimes acceptable compared with 39% of Republican voters who supported a candidate other than Trump for the GOP nomination. There are no significant differences on this question between Democratic voters who backed Clinton and Sanders in the primary contest.

Trump’s tone viewed more negatively than other recent candidates

Though voters say campaign 2016 has been more negative than other recent elections, they are more critical of Trump’s tone than of Clinton’s. About six-in-ten voters (62%) say that Donald Trump has been “too personally critical” of Hillary Clinton in the presidential campaign so far, while 44% of voters say Clinton has been too critical of Trump.

The share saying Trump is too critical of Clinton is substantially higher than voters’ assessments of any other candidate – of either party – in elections going back more than two decades. By comparison, the share of voters saying Clinton is too critical of Trump is greater than the proportion saying this about Barack Obama’s treatment of both John McCain (22%) and Mitt Romney (35%), but less than the share saying John Kerry (52%) had been too critical of George W. Bush, and is on par with voters’ evaluations of several recent GOP candidates.


Many see key issues unaddressed in the campaign

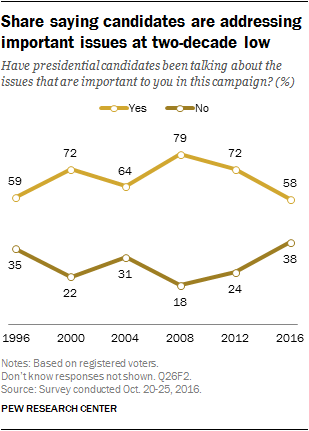
Overall, 58% of registered voters say that the presidential candidates are talking about the issues that are important to them this campaign, while 38% say they are not.

The share of registered voters who say the candidates are talking about important issues is down significantly from recent elections. In 2008, 79% said the candidates were talking about important issues, and 72% said this in 2012. In Pew Research surveys over the previous five presidential elections, 1996 was the last time voter sentiment on this question was about as negative as it is in the current survey.

Trump supporters (68%) are more likely than Clinton supporters (58%) to say the candidates have been talking about issues that are important to them in this campaign.

Over the past several months, voters have expressed dissatisfaction with the campaign. Last month, for instance, 57% said they had been feeling “frustrated” by the campaign, while 55% said they were “disgusted.”

Most voters expect political divides to remain or increase

Voters are skeptical that either Clinton or Trump will repair political divisions in the country. Overall, 41% of voters say they expect political divisions in the country to increase if Clinton wins, while 48% say divisions will stay about the same and just 9% say they will decrease. A majority of voters (55%) expect divisions to increase if Trump wins, while 26% say they will stay about the same and 17% say they will decrease.

Clinton and Trump supporters have more positive expectations that their candidate, rather than their opponent, would heal the nation’s political divisions, but they are not very optimistic. Roughly two-thirds of Clinton supporters (66%) expect little change in political divisions if she takes office, while a quarter (25%) expect these divides to increase, and just 8% say her election would narrow the nation’s political divide.

Among Trump backers, more say political divisions would increase (33%) than decrease (20%) under his presidency, while 46% expect little change.

Clinton backers have a harder time respecting Trump’s supporters

A majority of Clinton supporters (58%) say they have a hard time respecting a person who supports Donald Trump for president while 40% say they have no trouble doing this. The balance of opinion is reversed among Trump backers: 56% say they have no trouble respecting someone who backs Clinton, while 40% say it’s difficult for them to respect someone who supports her.

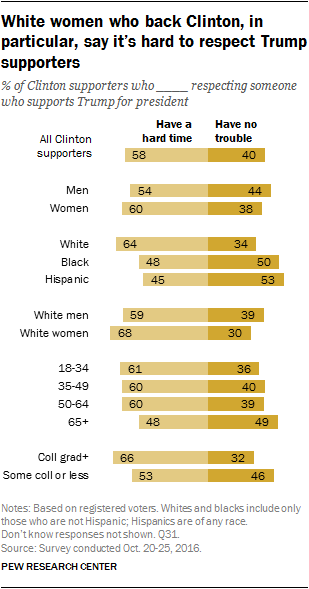
There are significant demographic differences among Clinton supporters. Whites, women, college graduates and younger Clinton backers are more likely to express difficulty respecting those who decide to vote for Trump.

About two-thirds of white Clinton supporters (64%) say they have a hard time respecting Trump supporters, while only about a third (34%) say they have no trouble. Black and Hispanic Clinton voters are more divided on this question: 48% of black Clinton backers say they have a hard time, while roughly as many (50%) say they have no trouble respecting someone who supports Trump for president. The balance of opinion is roughly the same among Hispanic Clinton backers (45% vs. 53%, respectively).

And while there are no significant differences between women and men who support Clinton on this question, white women who support her are particularly likely to express personal difficultly respecting Trump supporters: 68% say this (compared with 59% of white men who back Clinton).

Clinton’s supporters who are 65 and older are somewhat less likely than their younger counterparts to say they have a hard time respecting Trump supporters (48% say this, compared with about six-in-ten of Clinton voters under 65).

Clinton voters who have college degrees find it harder than those who do not to respect people who are voting for Trump: 66% of college graduates who are voting for Clinton say they have a hard time respecting someone who votes for Trump, while just 32% say they have no problem doing this. Among those with less education, views are roughly split (53% hard time, 46% no problem).

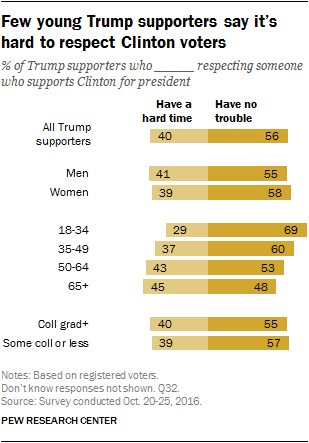
Among Trump supporters there are more modest demographic differences, but younger Trump voters are more likely than older Trump backers to say they have no trouble respecting someone who supports Clinton: Nearly seven-in-ten Trump backers under 35 (69%) say this, along with six-in-ten Trump supporters ages 35-49 (60%). Among older Trump supporters opinion is more divided, with about half (51% of those 50 and older) saying they have no trouble respecting someone who supports Clinton. There are no significant educational or gender differences among Trump supporters on this question.

4. How voters view Clinton and Trump’s respect for men and women, racial and religious groups

There are stark differences in how voters view the extent to which the two presidential candidates respect gender, racial and ethnic, religious and other groups in society. Majorities of registered voters say Hillary Clinton has “a great deal” or “a fair amount” of respect for women and men; for whites, blacks, Hispanics and Muslims; and for immigrants, veterans and blue-collar workers.

By contrast, Trump is generally viewed as having little or no respect for many of these same groups – fewer than half of voters say he has at least a fair amount of respect for Muslims, immigrants, Hispanics, blacks and women.

About eight-in-ten voters say Trump has a great deal or fair amount of respect for white people (83%) and men (82%), the highest shares among 12 groups tested. More voters think Trump than Clinton has at least a fair amount of men (82% vs. 65%); the only other group that significantly more voters think Trump than Clinton respects are evangelical Christians (59% say Trump has a at least a fair amount of respect for evangelical Christians vs. 51% for Clinton).

Voters are divided in views of Trump’s level of respect for people like them — 49% say he has a great deal or fair amount of respect for people like them, while an identical share says he has little or no respect. A majority of voters (57%) say Clinton has at least a fair amount of respect for people like them.

For the most part, voters believe both candidates have minimal respect for their opponent’s supporters. A wide majority of voters (69%) think Clinton does not have much respect for people who support Donald Trump; just about a quarter (28%) think she has a fair amount of respect or more. Opinions are similar regarding Trump’s respect for Clinton supporters: 71% think he has little or no respect for people who support Clinton, while 26% think he has at least a fair amount of respect for his opponent’s supporters.

Views of candidates’ respect for women and men, blacks and Hispanics

Nearly all of Hillary Clinton supporters (98%) think Clinton has at least “a fair amount” of respect for women, including 80% who think she has “a great deal” of respect.

A large majority of Donald Trump supporters (82%) think he has at least a fair amount of respect for women, though just 34% say he has a great deal of respect for women.

Roughly half of Trump supporters think Clinton has a great deal (18%) or a fair amount (31%) of respect for women. By contrast, just 6% of those who support Clinton say Trump has at least a fair amount of respect for women.

Overwhelming shares of Clinton (93%) and Trump (96%) supporters think their own candidate has a fair amount or more respect for men. But while three-quarters of Clinton backers say Trump has a great deal or fair amount of respect for men, Trump backers are far less likely to say the same of Clinton: Only about a third (34%) of his supporters think she has at least a fair amount of respect for men, including just 5% who think she has “a great deal” of respect.

Large majorities of Clinton supporters think she has a great deal or a fair amount of respect for whites (99%), blacks (94%) and Hispanics (94%). A comparably large majority of Trump backers say he has at least a fair amount of respect for white people (96%), but smaller majorities say the same about his respect for black people (87%) and for Hispanic people (77%).

Views of the opposing candidate vary across the racial and ethnic groups. A majority of Clinton supporters (76%) say Trump has a fair amount or more respect for white people, but just 10% think he has the same amount of respect for black people. Even fewer (4%) think he has that much respect for Hispanic people.

Trump supporters are less likely than Clinton backers to say the opposing candidate has a great deal or a fair amount of respect for white people: Roughly half (51%) say this about Clinton. Fewer think she has that much respect for black people (37%) or for Hispanic people (39%).

Assessments of candidates’ respect for religious groups, immigrants, veterans

Nine-in-ten Clinton supporters (92%) think she has a great deal or a fair amount of respect for Muslims. Somewhat fewer (81%) say she has the same amount of respect for evangelical Christians.

While Trump supporters widely think he has at least a fair amount of respect for evangelical Christians (85%), a smaller majority (59%) would say the same about his respect for Muslims.

Trump supporters are more than twice as likely to say Clinton has a great deal or a fair amount of respect for Muslims (47%) than to say this about her respect for evangelical Christians (19%). More Trump backers say Clinton has “a great deal” of respect for Muslims than say this about Trump (19% vs. 11%).

On the other hand, just 6% of Clinton supporters say Trump has at least a fair amount of respect for Muslims; 37% say he has respect for evangelical Christians.

An overwhelming share of Clinton supporters (94%) says she has at least a fair amount of respect for immigrants, including about half (49%) who say she has a great deal of respect. Among Trump supporters, a smaller majority (65%) thinks he has a great deal or a fair amount of respect for immigrants.

Just 5% of Clinton supporters say Donald Trump has a great deal or fair amount of respect for immigrants. Far more Trump supporters (47%) think Clinton respects immigrants.

An equal share of both Clinton and Trump supporters (92%) think their own candidate has at least a fair amount of respect for blue collar workers.

More than 90% of both Clinton supporters (94%) and Trump supporters (95%) say their candidate respects veterans, but Trump supporters are more likely to say he has a great deal of respect for them.

Nearly seven-in-ten Trump supporters (69%) say has a great deal of respect for veterans – the highest share among all 12 groups tested. Fewer Clinton supporters (56%) feel she has a great deal of respect for veterans.

A relatively large minority of Clinton supporters (40%) say that Trump has at least a fair amount of respect for veterans; just quarter of Trump supporters say Clinton has a fair amount or more respect for veterans.

When asked about the candidates’ respect for people like them, supporters overwhelmingly say their own candidate is respectful, and hold much more negative views of the opposing candidate.

And when asked specifically about respect for the opponent’s supporters, both Clinton and Trump supporters offer negative assessments. Just 15% of voters who support Clinton say Trump respects “Clinton supporters.” An equally (13%) small share of Trump voters say Clinton respects “Trump supporters.”

5. Confidence in election, views of U.S. democracy

Overall, a majority of voters say they have a great deal (32%) or fair amount (32%) of confidence that the presidential election will be open and fair. About one-in-three (35%) say they have little or no confidence the election will be fair and open.

Among Trump supporters, however, most (56%) say they have little or no confidence the election will be fair, while 43% have at least a fair amount of confidence.

Clinton supporters are overwhelmingly confident the election will be fair. Fully 88% of Clinton voters express this view, including 58% who are very confident the election will be fair and open. Among Trump supporters, just 8% have an equally high degree of confidence this will occur.

Voters who support Trump strongly are especially likely to have doubts the election will be fair and open. Nearly two-thirds (63%) say they have little or no confidence the election will be fair, while just 36% have at least a fair amount of confidence in this. Among those who back Trump less strongly, about half (48%) doubt the election will be fair and open. Among Clinton supporters, large majorities of those who support her strongly (92%) and less strongly (84%) express confidence in a fair election.

Views of candidates’ respect for democratic institutions

Most voters (63%) say Clinton has a great deal or fair amount of respect for the nation’s democratic institutions and traditions. Less than half (43%) of voters say the same about Trump.

While a large majority of Trump voters (86%) say he respects U.S. democratic traditions, just 41% say he has a great deal of respect for these traditions. Among Clinton supporters, 65% say their candidate has a great deal of respect for the nation’s democratic institutions and traditions.

There also are differences in how Trump and Clinton supporters view the opponent’s level of respect for democratic institutions. About a quarter of Trump supporters (27%) say Clinton has at least a fair amount of respect for these institutions, more than double the share of Clinton supporters who say that about Trump (11%).

What is important for a strong democracy?

When it comes to maintaining a strong democracy in the United States, large majorities of voters agree on the importance of a range of elements. Almost all voters (90%) say that open and fair elections are very important to maintaining a strong democracy. Wide majorities also agree that it is very important that people have the right to non-violent protest and to protect the rights of people with unpopular views (78% and 77% respectively).

Somewhat smaller majorities think it is very important for those who lose elections to recognize the legitimacy of the winners (65%), and for news organizations to be free to criticize political leaders (61%).

Supporters of both major-party candidates agree that open and fair elections are very important to maintaining a strong democracy: 93% of voters who support Clinton say this, as do 91% of voters who support Trump.

There are modest differences between Trump and Clinton supporters in views of the importance of protecting the rights of people with unpopular views and ensuring the right to non-violent protest – though majorities of both groups say each is very important

Overall, 82% of Clinton voters and 71% of Trump voters say it is very important to a strong democracy to protect the rights of those with unpopular views. Clinton supporters are 17 points more likely than Trump supporters to say it is very important to ensure that people have the right to non-violent protest (86% vs. 69%).

Large majorities of Clinton supporters also say it is very important that the losers of elections recognize the legitimacy of the winners (83%) and that news organizations are free to criticize political leaders (72%). Trump supporters are much less likely to see each as very important to maintaining a strong democracy: 49% say it is very important that news organizations are free to criticize leaders and 48% say it is very important that those who lose elections recognize the winners. Among Trump supporters, just 42% of those who back him strongly say it’s very important for the losers of elections to recognize the winners, compared with 57% of those who support him less strongly.

6. Views of domestic issues: race, immigration, health care, abortion, Supreme Court

The issue of race has been a flashpoint in the 2016 presidential campaign and Clinton and Trump supporters are divided over whether the country pays too much – or not enough – attention to racial issues these days.

Overall, 39% of registered voters say too much attention is paid to racial issues, while an almost equal share (41%) says too little attention is paid to these issues. Just 18% say that about the right amount of attention is paid to racial issues.

Nearly two-thirds of Trump backers (65%) say too much attention is paid to racial issues in this country, while only 18% say these issues get too little attention. Among Clinton supporters, views are the reverse:  59% say too little attention is given to issues of race, compared with just 18%who say too much attention is paid to this topic.

By 66% to 17%, blacks are more likely to say there is not enough than too much attention paid to issues of race in this country. Among whites, 43% say racial issues get too much attention, while 35% say these issues get too little attention (20% say they get about the right amount of attention).

About half (52%) of Hispanics say there is too little attention paid to racial issues, compared with 30% who say too much attention is paid to these issues.

There are significant differences among whites on this question depending on which candidate they support in the upcoming election. A majority of white voters who support Clinton (57%) say there is not enough attention paid to racial issues. Among whites who back Trump, nearly two-thirds (65%) say there is too much attention paid to these issues.

On immigration, most back path to legal status

Nearly all Clinton supporters (95%) say there should be a way for undocumented immigrants currently in the country to stay here legally, if certain requirements are met. A smaller majority of Trump supporters (60%) also holds this view. There is somewhat more agreement between the two groups of supporters on this aspect of the immigration debate than on some others, including views on building a wall on the U.S. border with Mexico.

Voters who say undocumented immigrants should not be allowed to stay in the country legally were asked a follow-up question about deportation.

Nearly four-in-ten Trump supporters (37%) believe undocumented immigrants should not be permitted to stay in the country, and the vast majority of these (32% of Trump supporters overall) say there should be a national law enforcement effort to deport the immigrants now in the country illegally. By comparison, only 1% of Clinton backers overall say there should be a national deportation effort.

Republicans are internally divided on the approach the country should take with undocumented immigrants. About as many Republicans and Republican-leaning independents who supported Trump in the primary say undocumented immigrants should not be allowed to stay in the country legally (48%) as say they should be allowed to stay if they meet certain requirements (49%). By contrast, a large majority (77%) of Republicans who supported one of the other candidates in the Republican primary support a path to legal status for undocumented immigrants currently in the country.

Most voters say abortion should be legal in most cases

Clinton and Trump supporters take opposing views on the issue of abortion. A wide 82%-majority of those who support Clinton believe abortion should be legal in all or most cases; only 16% say it should be illegal in all or most cases. More Trump supporters say abortion should be illegal (60%) than legal (36%), though views are somewhat less one-sided than among Clinton supporters.

As in the past, there is no gender gap in views of abortion: Most men and (60%) and women (62%) think abortion should be legal in all or most cases. And there are no significant gender differences among supporters of the two candidates. Eight-in-ten or more Clinton supporters, regardless of gender, say abortion should be legal; about six-in-ten Trump backers of both genders say abortion should be illegal.

Little change in views on the health care law

More than six years after its passage, the Affordable Care Act remains a divisive issue for voters. Currently, more registered voters say they disapprove (53%) than approve (45%) of the 2010 health care law.

Clinton supporters overwhelmingly approve of the health care law (82% approve, 15% disapprove). When asked what, if anything, should be done with the law now, a large majority (69%) favors Congress taking steps to expand the law. Two-in-ten say Congress should leave the law as it is, while few (8%) say the law should be repealed.

Trump supporters, by contrast, are nearly unanimous in their opposition to the ACA: 94% disapprove of the health care law and nearly nine-in-ten (88%) say they want Congress to repeal the law.

For more on public attitudes on the health care law, and how they have changed over time, see Pew Research Center’s Fact Tank blog.

Views on the Supreme Court and ‘constitutional originalism’

When it comes to how the Supreme Court should interpret the Constitution, voters are divided: 48% say the Court should base its decisions on its understanding of what the Constitution “meant as it was originally written,” while about as many (47%) say decisions should be made on what the Constitution “means in current times.”

Nearly three-quarters of Clinton supporters (74%) say the Supreme Court should base its rulings on an understanding of what the Constitution means in current times, while 22% say that justices should base their decisions on what the Constitution meant as it was originally written.

Most Trump backers (80%) believe that the Supreme Court should decide cases based on an originalist interpretation of the Constitution. Only 15% say the Court should base its decisions on an interpretation of what the Constitution means in current times.

Opinions about increasing taxes on higher-income households

On the issue of tax rates for higher-income earners, a plurality of voters (42%) believe that tax rates on household incomes over $250,000 should be increased. About a third (33%) say these rates should be kept the same as they are now and just 19% think tax rates on household income over $250,000 should be lowered.

About six-in-ten Clinton backers (59%) say tax rates on those who earn more than $250,000 should be increased, compared with 26% who say they should stay the same and 11% who think they should be lowered.

A greater share of Trump supporters (40%) say tax rates on household income over $250,000 should be kept the same as they are now than either support lowering (29%) or raising (24%) these rates.

No shift in anger, frustration with the federal government

Voters’ feelings about the federal government are little changed over the last several years. Today, 21% of registered voters say they are angry with the federal government, while 57% say they are frustrated and 20% say they are basically content.

Though few voters express contentment with the federal government, anger toward it is no higher among voters today than it has been since February 2014; and it remains lower than it was during the October 2013 (32%) federal government shutdown.

Feelings about government remain highly partisan, with GOP voters more likely than Democrats to express anger at government, and  the divide is little changed in recent months.

Similarly, feelings about government distinguish Clinton and Trump supporters. Overall, nearly four-in-ten Trump backers (38%) say they feel angry about the federal government, while 58% say it makes them feel frustrated and just 2% feel content about the federal government. Among Clinton supporters, just 6% express anger about government while 53% say they are frustrated, and nearly four-in-ten (38%) are content.

These divides are even more pronounced by strength of support for the two candidates: Fully 51% of Trump’s strong supporters say they are angry at government (compared with 22% of those who back him less strongly). Among Clinton supporters, those who back her strongly are more likely to say they are content with government (44%) than those who do not back her strongly (31%).

Views of personal finances among Clinton and Trump supporters

While Clinton and Trump supporters hold opposing views on a range of policies and issues, their assessments of the current state of their personal finances are almost identical. Among Clinton supporters, 55% say they are in either excellent or good shape financially, while 45% say they are in only fair or poor shape. Among those who support Trump, 52% describe their personal finances as excellent or good, compared with 47% who say their finances are only fair or poor.

Personal financial outlook reflects political divide

While current financial assessments among Trump and Clinton supporters are very similar, there is a wide gap in expectations for personal finances over the next year, with those who support Trump much more pessimistic than those who support Clinton.

Nearly three-quarters (73%) of Clinton supporters think their personal financial situation will improve a lot or some over the course of the next year, compared with just 10% who think their own situation will get a lot or a little worse (14% expect their finances to stay about the same).

By contrast, fewer than half of Trump supporters (45%) think their own finances will improve over the next year; 27% think they will get worse, and 15% expect them to stay about the same.

Attitudes among Trump supporters have become more negative over the past four months. In June, 61% of Trump supporters believed their situation would improve compared with 45% in the current survey. Clinton supporters are about as optimistic today that their personal financial situation will improve over the next year as they were in June (73%).

Clinton supporters are more optimistic than Trump supporters about their personal financial outlook across all levels of household income. For example, among those with family incomes of less than $30,000 a year, 69% of Clinton supporters expect their own finances to improve over the course of the next year, compared with just 47% of Trump supporters. Similarly, in households earning $75,000 a year or more, 76% of those who support Clinton – compared with 49% of those who support Trump – think their own financial situation will improve over the next year.

7. Opinions on U.S. international involvement, free trade, ISIS and Syria, Russia and China

Voters remain wary of U.S. global involvement. A majority (54%) says that the U.S. should deal with its own problems and let other countries deal with their problems as best as they can; 41% say the U.S. should help other countries deal with their problems. This is largely unchanged since April, when 57% said the U.S. should prioritize dealing with its own problems.

There are substantial differences between Clinton and Trump supporters in opinions about whether the U.S. should help other countries. A large majority of Trump supporters (70%) say that the U.S. should let other countries deal with their own problems, while just a quarter say the U.S. should help other countries.

Clinton supporters are more divided, but a greater share (56%) says the U.S. should help other countries, while 40% say the U.S. should let other countries deal with their own problems as best as they can.

As was the case in April, Democratic and Democratic-leaning registered voters are more likely than Republican voters to say the U.S. should help other countries deal with their problems.

But since then, the balance of opinion among Democratic voters has moved modestly toward helping other nations. Today, 54% say the United States should help other nations deal with their problems, while 42% say it should deal with its own problems and let other countries deal with their problems. In April, opinion among Democratic voters was divided (47% help other nations, 49% deal with own problems).

Views among Republican voters have remained virtually unchanged since then, with more than twice as many saying the U.S. should prioritize dealing with its own problems (66%) rather than help other countries with theirs (29%).

Aside from the partisan gap on helping other nations, there also are educational differences. Voters with postgraduate degrees are the only educational category in which a majority (57%) says the United States should help other nations deal with their problems. An identical share of those with less education (57%) say the U.S. deal with its own problems and let other nations deal with their problems.

Increasing GOP skepticism toward free trade agreements

Supporters of Donald Trump are largely critical of free trade agreements generally and of the proposed Trans-Pacific Partnership, or TPP. Clinton backers, by contrast, express generally positive views of both free trade in general and the TPP.

Roughly seven-in-ten Trump supporters (72%) say free trade agreements have been a bad thing for the U.S., while only 21% say they’ve been a good thing. Trump supporters’ views of the TPP are similar: Two-thirds (66%) say it would be a bad thing for the U.S., compared with 17% who say it would benefit the country.

By a two-to-one margin (58% to 29%), Clinton supporters say free trade has been a good thing for the country. Views of the proposed TPP agreement also continue to garner generally positive assessments from Clinton backers: 56% say it would be good for the U.S. and 24% say it would be a bad thing. About a quarter of Clinton backers (24%) do not express an opinion about how the TPP would impact the U.S.

Republicans’ views of free trade continue to grow more negative. Currently, about two-thirds of Republican and Republican-leaning registered voters (68%) say free trade has been a bad thing for the U.S. Only about a quarter (24%) say it has been good for the country. The share saying free trade has been a bad thing has edged higher since August. Sentiment is much more negative than it was in May 2015 when 51% of Republican voters said free trade was a good thing for the U.S. and just 39% said it was a bad thing.

Democrats, on the other hand, remain largely positive about free trade. A majority (56%) of Democratic and Democratic-leaning registered voters say free trade agreements have generally been a good thing for the U.S. These views are little changed since August and have been relatively stable over the course of the last few years.

Differing views in how well U.S. military action against ISIS is going

More than twice as many voters say the U.S. military campaign against Islamic militants in Iraq and Syria is going not too or not at all well (64%) as say it is going very or fairly well (31%). And this negative view of how the campaign is going is particularly pronounced among Trump supporters.

Nearly eight-in-ten (79%) of those who plan to vote for Trump say that the military campaign against ISIS is not going well. Just 18% say that the campaign is going at least fairly well. By contrast, Clinton supporters are more divided, with nearly as many saying the military campaign against ISIS is going not too well or worse (49%) as say it’s going very or fairly well (45%).

Voters remain divided when it comes to their bigger concern about the military campaign against ISIS. As many say their greater concern is that the U.S. will go too far in getting involved in the situation in Iraq and Syria, as say they are more concerned about the U.S. not going far enough (45% each).

More Clinton supporters say their bigger concern is that the U.S. will go too far in getting involved (58%) than say they’re concerned the U.S. will not go far enough (31%). The balance of opinion is reversed among Trump supporters: Two-thirds (67%) say their greater concern is that the U.S. will not go far enough, while only a quarter (25%) say they are more worried about the U.S. going too far in getting involved.

Overall, there is little change in views of how the U.S. military campaign against ISIS has been going since April of this year. However, Republican and Republican-leaning registered voters are now more likely to say the campaign is not going well.
In April, a majority of Republicans (70%) said the campaign against ISIS was going not too (44%) or not at all well (24%). Today, that share has increased 10 points to 80%.

Views of how the military campaign against ISIS is going among Democratic and Democratic-leaning registered voters have remained largely the same since April.


Most say U.S. does not have responsibility to accept refugees from Syria

More voters say the U.S. does not have a responsibility to accept refugees from Syria into the country (54%) than say the U.S. does have such a responsibility (41%).

While Clinton and Trump supporters differ on many issues, the divide over accepting Syrian refugees is particularly striking.

Trump supporters overwhelmingly say that the U.S. has no responsibility to accept refugees from Syria: 87% say this, while just 8% say they the U.S. does have a responsibility. By contrast, just 27% of Clinton supporters agree that the U.S. does not have a responsibility to take in refugees from Syria. More than twice as many Clinton backers (69%) say the U.S. does have a responsibility to accept these refugees.

Young voters are more likely than older voters to say the U.S. does have a responsibility to accept refugees from Syria into the country. Nearly half of voters under the age of 30 (49%) and ages 30 to 49 (47%) each say the U.S. does have such a responsibility, compared with just 34% of those ages 65 and older.

Opinions also are divided along education lines. Voters with postgraduate degrees (62%) are the most likely to say the U.S. has a responsibility to take in Syrian refugees, while just 30% of those with no more than a high school diploma agree.

Views of Russia and China

As in the past, roughly half of voters view both Russia and China as serious problems but not adversaries (48% Russia, 51% China). A quarter says Russia is an adversary, while 19% says the same of China. And comparable shares regard each country as “not much of a problem” (21% Russia, 25% China).

Similar shares of Clinton and Trump supporters view Russia as an adversary (29% of Clinton supporters, 24% of Trump supporters), but Clinton backers are 13 percentage points more likely to say Russia is a serious problem (53% vs. 40%). And while 30% of Trump supporters say Russia is not much of a problem, only 13% of Clinton backers say the same.

By contrast, Clinton supporters are more likely than Trump backers to think of China as not much of a problem (31% vs. 19%).

Since April, views of Russia among Republican voters have shown very little change. But the share of Democratic voters saying Russia is an adversary has increased from 21% to 28%. And the share of Democrats saying they don’t see Russia as a problem has fallen from 27% to 15%.


8. The state of the parties, Obama approval

Eight-in-ten registered voters (80%) say the Republican Party is mostly divided when it comes to its views on issues and vision for the future, while just 17% say the GOP is united.

By contrast, a majority of voters (58%) say that the Democratic Party is mostly united in its views on issues and vision for the future; 39% say the party is mostly divided on these matters.

Seven-in-ten GOP voters (70%) think their party is divided; only about a quarter of Republican and Republican-leaning voters (27%) say the party is united.

Republican voters who did not support Donald Trump in the GOP primaries are particularly likely to see disunity in the Republican Party: 76% say there is division in the party; a smaller majority (61%) of voters who backed Trump in the primaries say this.

Two-thirds of Democrats (67%) say their party is generally united on issues and vision for the future. Majorities of both those who supported Bernie Sanders (61%) and Clinton (73%) in the primaries say this; though Sanders primary backers are somewhat less likely than Clinton’s to say the party is unified.


Party images show modest improvement

Among the general public, assessments of both the Republican and Democratic parties have ticked up in recent months. Views of the Democratic Party are in net positive territory for the first time since June 2013: 52% currently rate it favorably while 45% rate it unfavorably.

Public views of the GOP have improved from earlier in the year, but they remain in negative territory: 55% now have an unfavorable view of the Republican Party while 40% view it favorably.

As in past election years, the views of partisans have grown more favorable toward their own party as the election approaches. About eight-in-ten Republicans (82%) now have a favorable opinion of the GOP; that’s identical to the share who had a favorable view in August, but up from 69% in June.

Democrats continue to hold highly positive views of their party. Fully 94% have a favorable opinion of the party. Independents’ ratings of the Democratic Party remain more positive than those of the Republican Party (45% vs. 35%).

Views of Barack Obama’s job performance

Barack Obama’s job approval rating now stands at 54%, up 8 points since the start of the year, and as high as it has been since December 2012. Though little changed over the last few months, ratings of the president’s job performance have ticked up gradually over the course of 2016.

More positive views of the president can be attributed to stronger ratings from Democrats (currently, 90% approve of the job he is doing, up 9 points from the beginning of this year) and independents (52% now approve of Obama’s job performance, also up 9 points from January). Republican ratings of Obama have changed little over the course of the year; just 11% approve of his performance.

Methodology

The analysis in this report is based on telephone interviews conducted October 20-25, 2016 among a national sample of 2,583 adults, 18 years of age or older, living in all 50 U.S. states and the District of Columbia (647 respondents were interviewed on a landline telephone, and 1,936 were interviewed on a cell phone, including 1,184 who had no landline telephone). The survey was conducted by interviewers at Princeton Data Source and Abt/SRBI under the direction of Princeton Survey Research Associates International. A combination of landline and cell phone random digit dial samples were used; both samples were provided by Survey Sampling International. Interviews were conducted in English and Spanish. Respondents in the landline sample were selected by randomly asking for the youngest adult male or female who is now at home. Interviews in the cell sample were conducted with the person who answered the phone, if that person was an adult 18 years of age or older. For detailed information about our survey methodology, see https://alpha.pewresearch.org/pewresearch-org/methodology/u-s-survey-research/

The combined landline and cell phone sample are weighted using an iterative technique that matches gender, age, education, race, Hispanic origin and nativity and region to parameters from the 2014 Census Bureau’s American Community Survey and population density to parameters from the Decennial Census. The sample also is weighted to match current patterns of telephone status (landline only, cell phone only, or both landline and cell phone), based on extrapolations from the 2015 National Health Interview Survey. The weighting procedure also accounts for the fact that respondents with both landline and cell phones have a greater probability of being included in the combined sample and adjusts for household size among respondents with a landline phone. The margins of error reported and statistical tests of significance are adjusted to account for the survey’s design effect, a measure of how much efficiency is lost from the weighting procedures.

The following table shows the unweighted sample sizes and the error attributable to sampling that would be expected at the 95% level of confidence for different groups in the survey:

Sample sizes and sampling errors for other subgroups are available upon request.

In addition to sampling error, one should bear in mind that question wording and practical difficulties in conducting surveys can introduce error or bias into the findings of opinion polls.

Pew Research Center undertakes all polling activity, including calls to mobile telephone numbers, in compliance with the Telephone Consumer Protection Act and other applicable laws.

Pew Research Center is a nonprofit, tax-exempt 501(c)(3) organization and a subsidiary of The Pew Charitable Trusts, its primary funder.